Ticker for May 29, 2025
MESONET TICKER ... MESONET TICKER ... MESONET TICKER ... MESONET TICKER ...
May 29, 2025 May 29, 2025 May 29, 2025 May 29, 2025
Less is not more
Cooling Degree Days (and Heating Degree Days) are something most folks don't
understand too well, and since I'm like most folks (except worse in just about
every way, including self-esteem), here's a feeble attempt to explain it.
Cooling Degree Days are a way to measure how hot the weather has been and how
much people might need to use air conditioning to stay comfortable, so in proxy
how much moolah you're spending on your electric bill!
Think of it like this...let's assume that most people feel comfortable when the
temperature is 65°F. If the temperature is higher than 65°F, it’s considered
"hot enough” that you might want to cool your home.
So a Cooling Degree Day is counted for every degree the DAILY AVERAGE
temperature (Tmax + Tmin, then divided by 2) is above 65°F.
Here's a quick example:
If the high for the day is 85°F and the low is 65°F, the average is:
(85+65)/2=75°F
That’s 10 degrees above 65°F, so it would count as 10 Cooling Degree Days for
that day.
So the more Cooling Degree Days you have, the more likely people are using
their air conditioners—and that means more energy use, and less money in the
bank account.
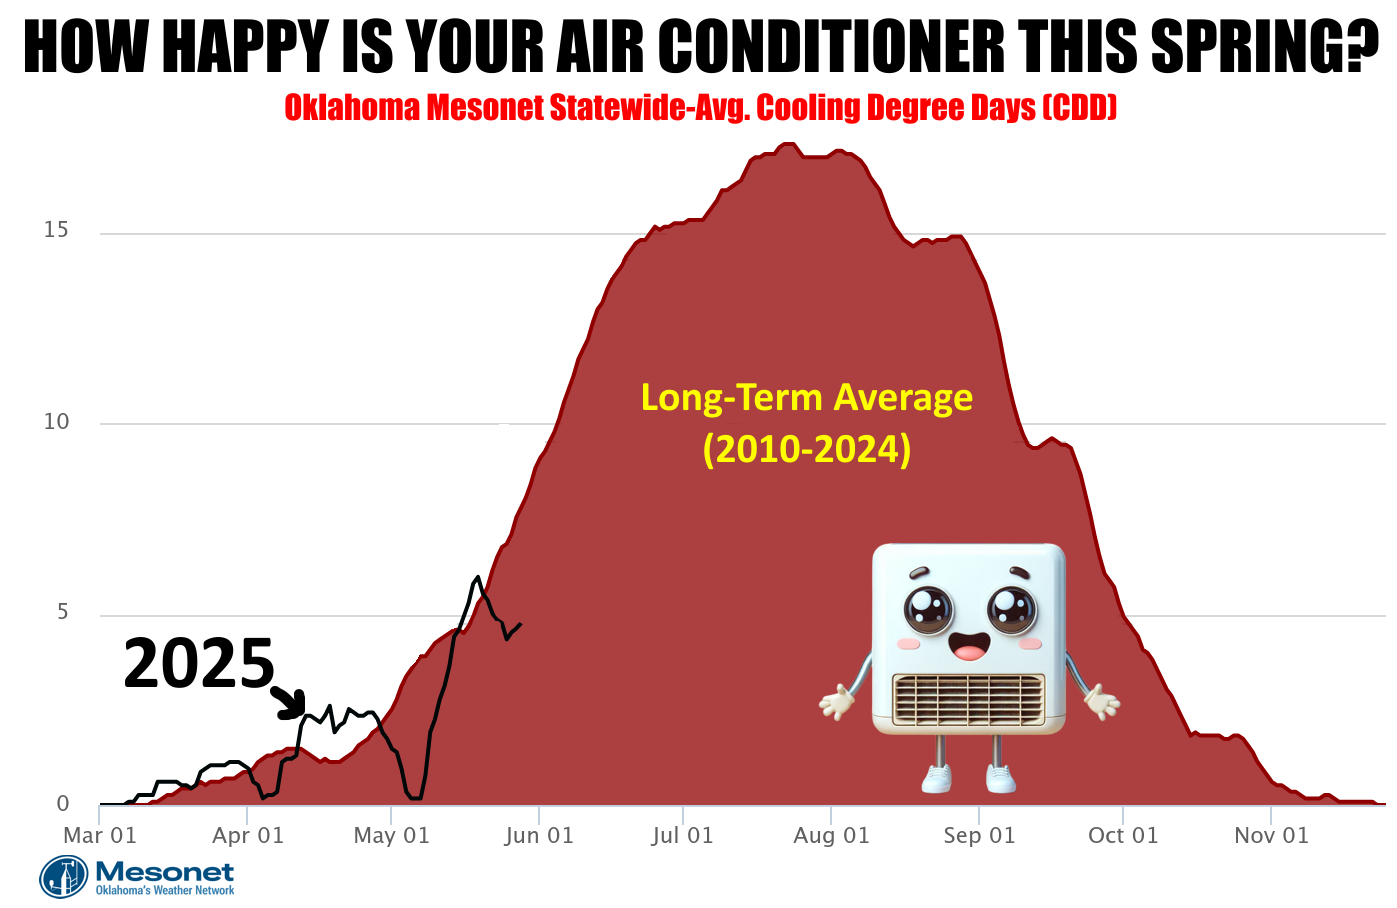
Okay, every completely confused? Good! Now as you can see from the top graphic,
our CDDs have been well below normal through most of May thus far, just as we'd
normally see those air conditioners go into high use. In fact, our CDDs were
actually higher during a lot of April vs. what we've had during May.
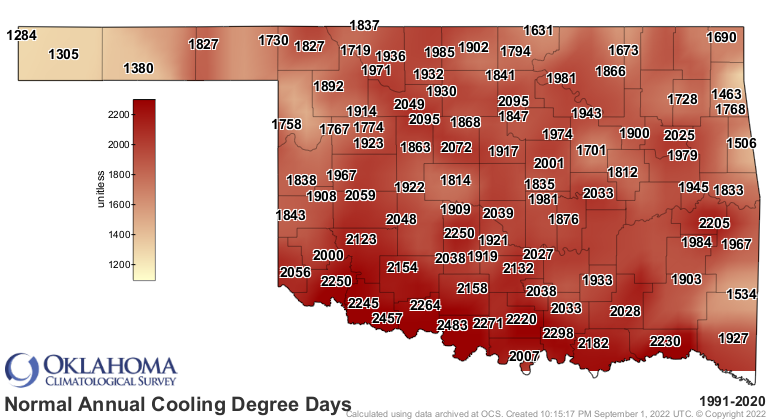
Here's what the average ANNUAL CDDs look like across the state. Not shockingly,
they're higher along the Red River, in general.
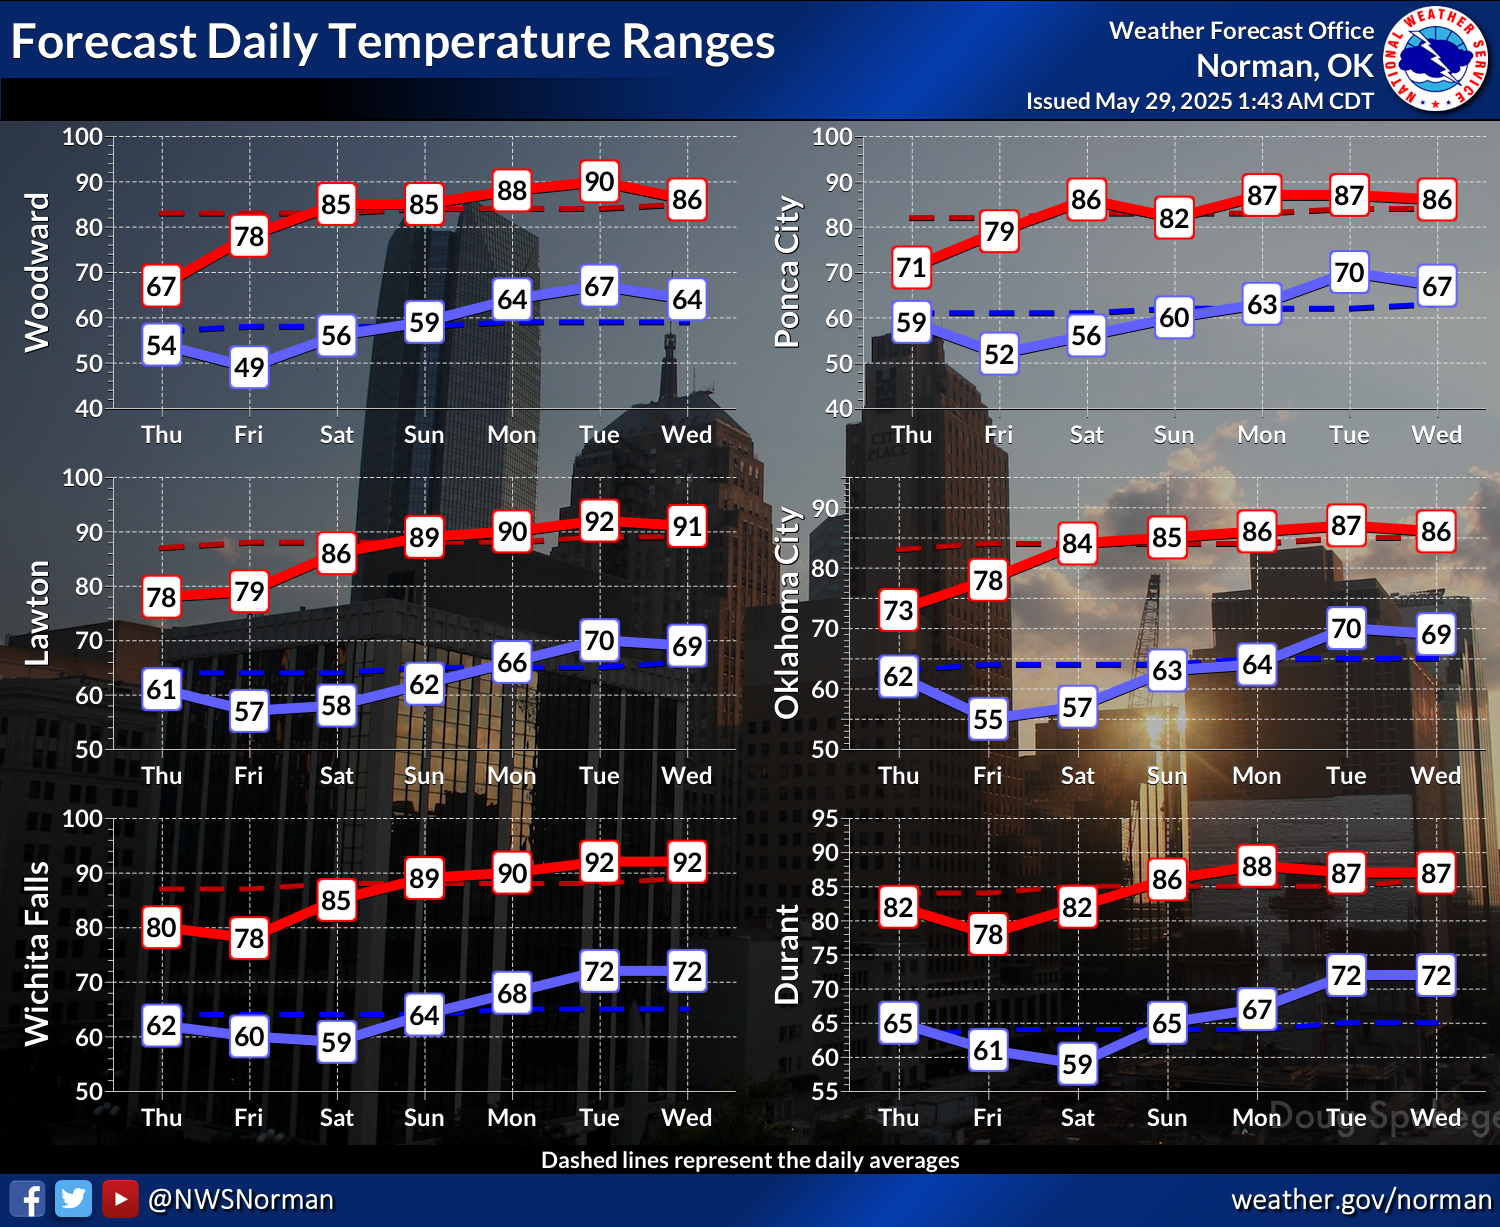
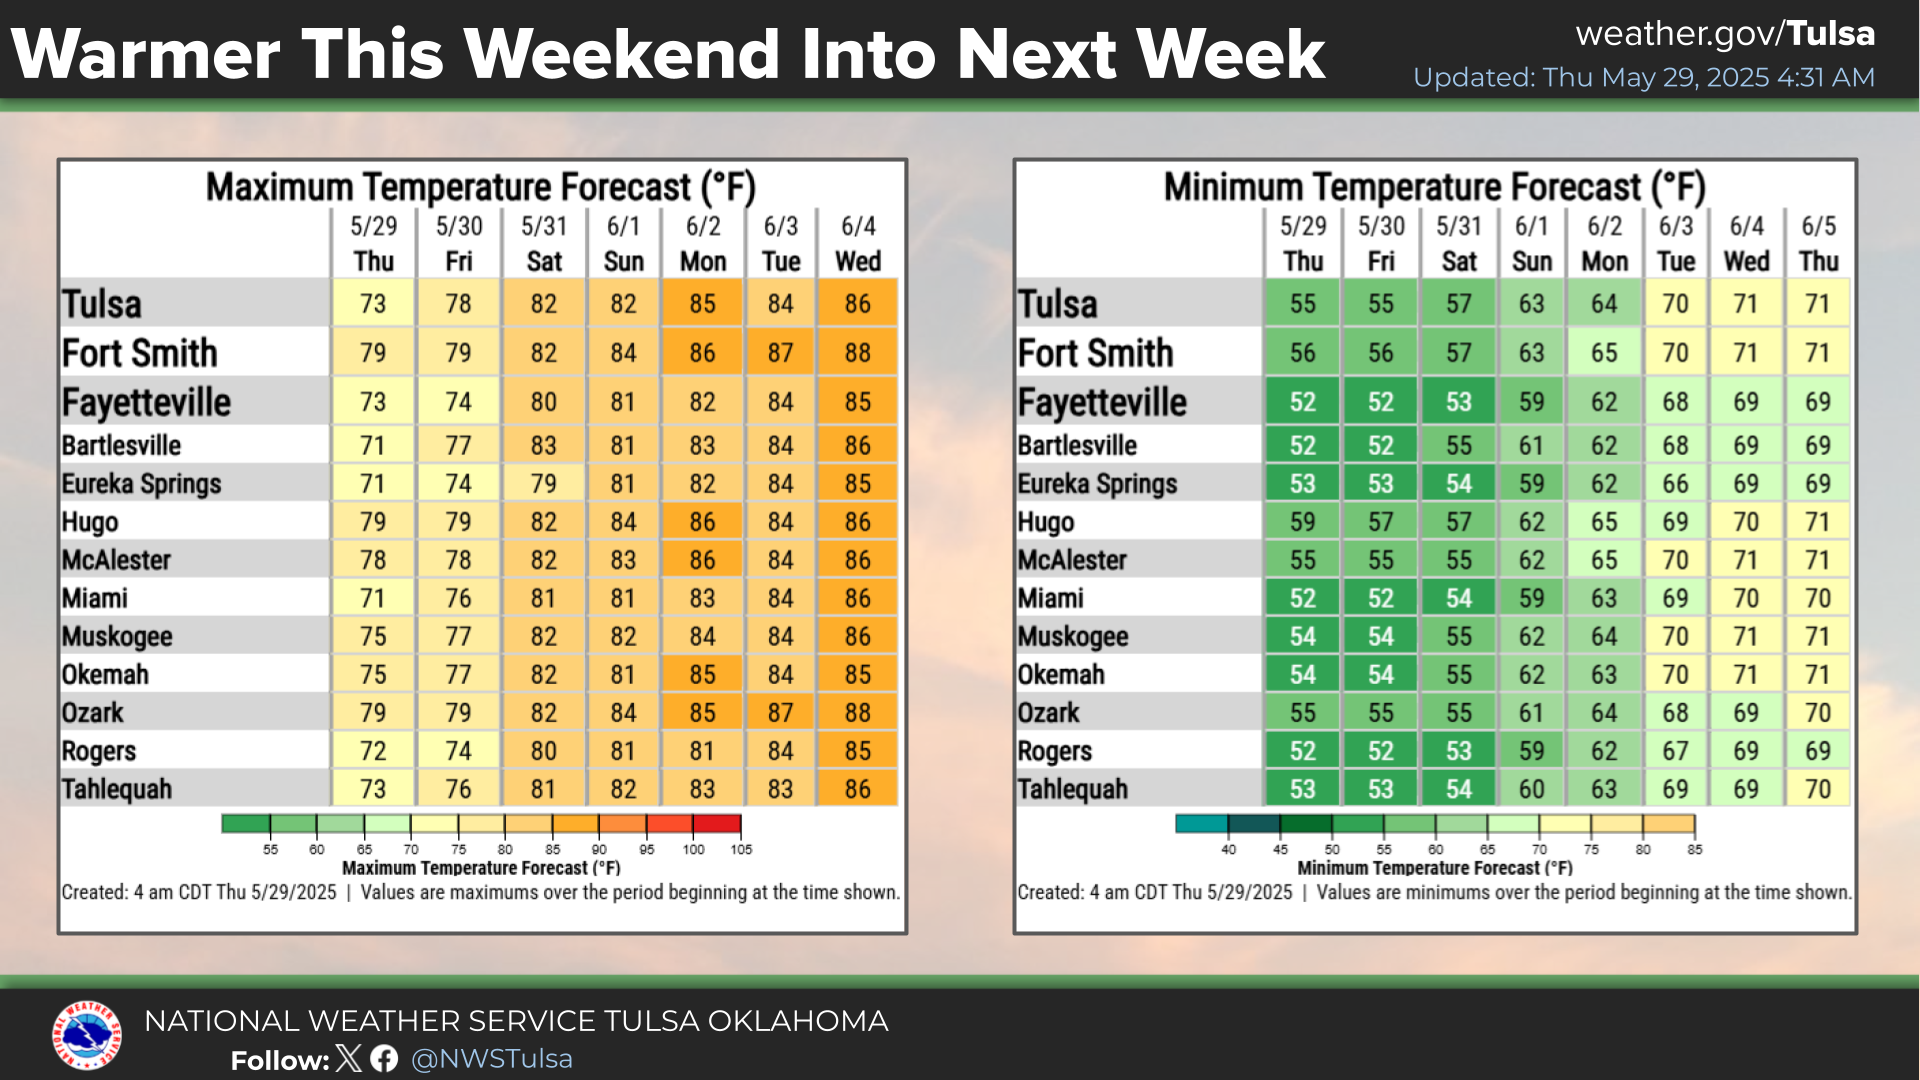
Now that's a perfect segue (remember when Segways were gonna be the next big
thing?) to show how our ACs might have to start working a bit more as we get
into next week, as our temperatures start to look a bit more early-June looking.
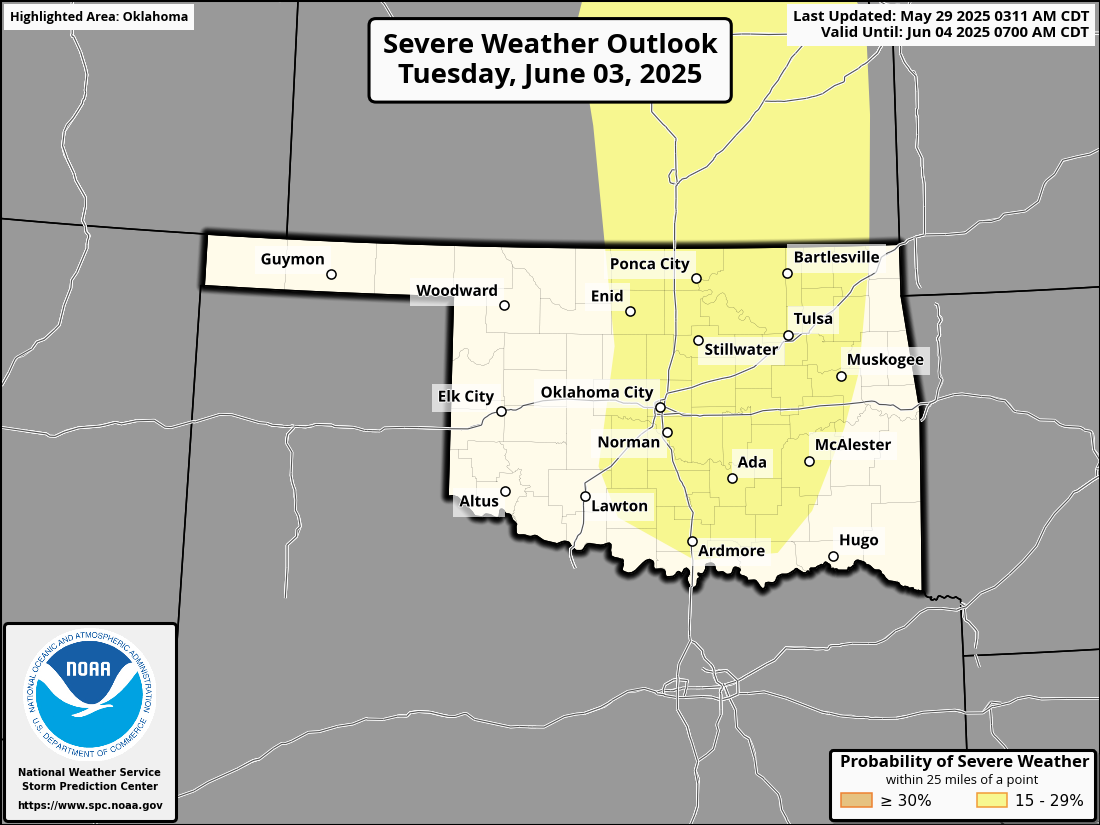
There'll be a chance of storms off an on, and even some heightened awareness
days next week, like Tuesday where the Storm Prediction Center is already
painting us in an elevated risk day.
We have knocked down drought to just about a 4-year low since this larger
drought episode started back in Aug. 2021.
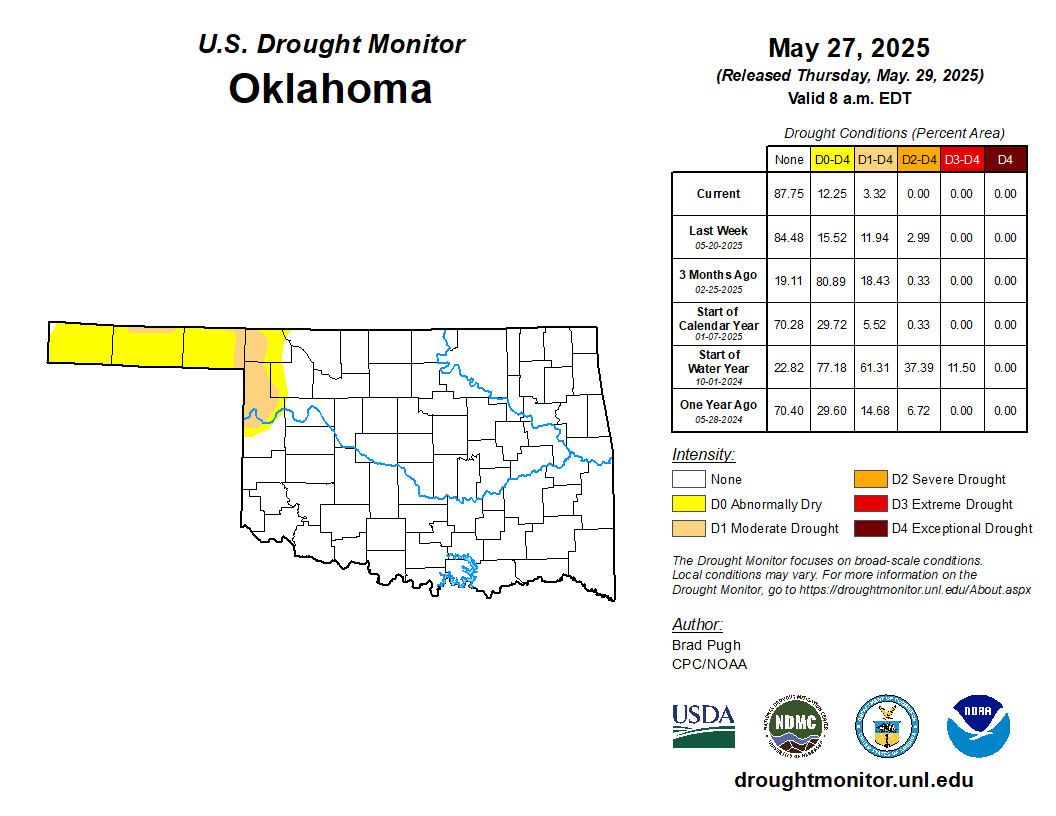
Maybe we get to our first ZERO drought map in the state since July 2019?
Gary McManus
State Climatologist
Oklahoma Mesonet
Oklahoma Climate Survey
gmcmanus@ou.edu
May 29 in Mesonet History
| Record | Value | Station | Year |
|---|---|---|---|
| Maximum Temperature | 107°F | BEAV | 2011 |
| Minimum Temperature | 42°F | KENT | 2019 |
| Maximum Rainfall | 5.19 inches | HECT | 2001 |
Mesonet records begin in 1994.
Search by Date
If you're a bit off, don't worry, because just like horseshoes, “almost” counts on the Ticker website!