Mesonet Ticker for September 22, 2026

                
MESONET TICKER ... MESONET TICKER ... MESONET TICKER ... MESONET TICKER ...
September 22, 2026 September 22, 2026 September 22, 2026 September 22, 2026


Jumping Jack Drought


An afternoon Ticker? How odd. Sort of like supper for breakfast (here, have some
goulash with extra garlic at 7am), or being a fan of Wes Anderson movies (NAME
ONE GOOD ONE!).

In actuality, I was at the Governor's Emergency Drought Committee meeting at
the OK Dept. of Agriculture. I figured I'd show you my slides from that update,
as short as it was, to get a gist of what I was gisting about. And we all know how
painful that can be.

I didn't have a lot of time, so this isn't that comprehensive. Just the
highlights (or in this case...the lowlights).


Slide 1: Here is an overview of what I am going to talk about. Hint: Drought,
El Nino, and hope.


Slide 2: This shows a timeline of U.S. Drought Monitor changes from July 1, 2021,
through last week. The top graph shows the disastrous and particularly nasty 2021-
2025 drought that was finally eradicated in the summer of 2025, with a nice three
month break in drought afterwards, then the resurgence of drought that fall. Two
flash droughts bumped drought back to the horrible stage, and I've expanded that
period over the least year out to show those rapid-drought intensifications
during spring of last year and of course the current flash drought episode.


Slide 3: This shows the rapid onset, spread, and intensification of drought over
the last seven weeks, going from 44% of the state in drought as of July 28, to
basically 100% last week. And our Extreme-Exceptional drought (D3-D4) tripled
over that period from 16% to 50%, the most we've seen since February 2023. Yes
folks, flash drought can be both rapid onset AND intensification.


Slide 4: This one speaks for itself. Well, I speak for it, but you know what I
mean. Well, I'm actually writing for it, but you know, I spoke for it at the
meeting. BACK TO THE POINT...both short-term and long-term deficits are profound.


Slide 5: Another one that is self-explanatory (no, we're not doing that again).
Drought begets heat, heat begets drought, and they feed off of each other.
The basic point here is that we have seen unprecedented heat over the last 13+
months, in the overall period and smaller periods within the larger one.


Slide 6: This doesn't do the impacts justice, but just a quick reminder of what
drought is doing to the state's ag producers. That's dead mesquite in that
picture from Jefferson County, for crying out loud!


Slide 7: This shows the "January-ification" of our landscape across the state
from this point last year to this year via our OK-FIRE's relative greenness
maps. The western half of the state might as well be on the moon. Last year at
this time we were coming off of a 3-month period of no drought and this crap
was just getting started, heading into yet another La Nina episode last fall
through spring.


Slide 8: Ahhhh, our old (new) friend El Nino, with those hopeful CPC 3-month
outlook maps for Nov-Dec through Jan-Feb, until we start to see El Nino's
impacts start to fade late next winter through spring. At least that's what
is in the outlooks. What we DON'T see are any hints of increased odds of
below-normal precip. You know, like we've seen continually since last summer?
And look what happened there.


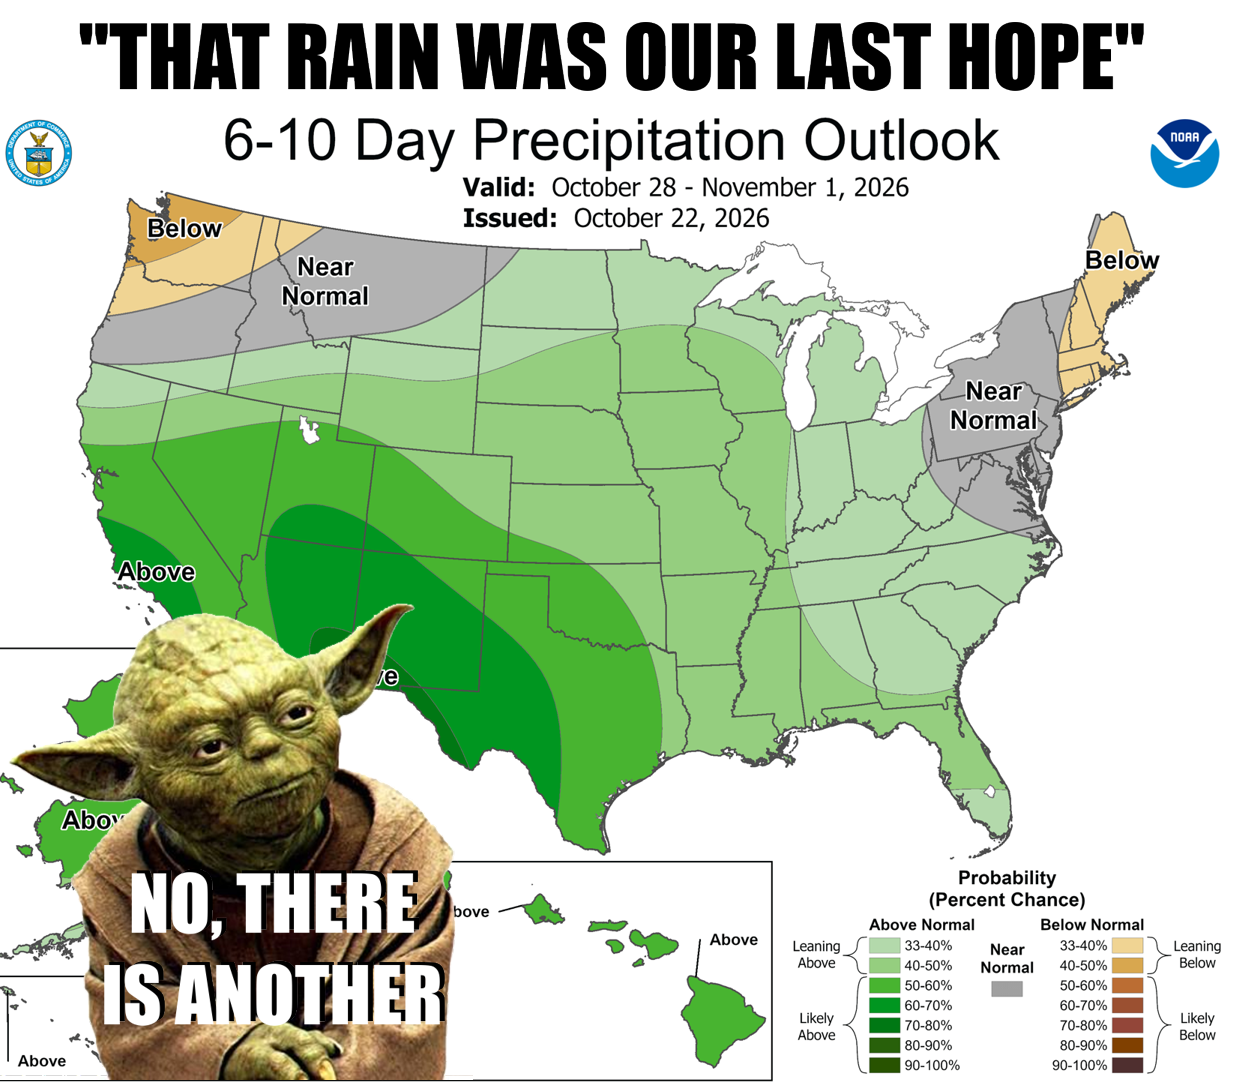
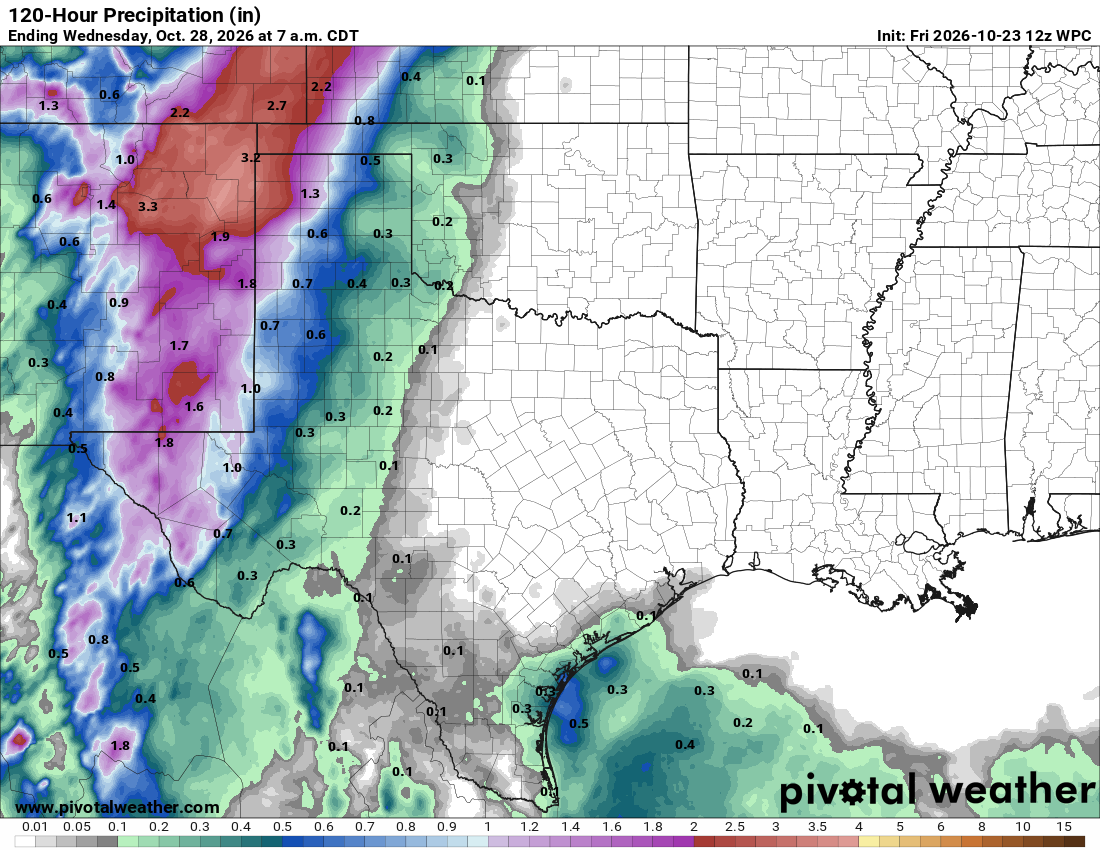
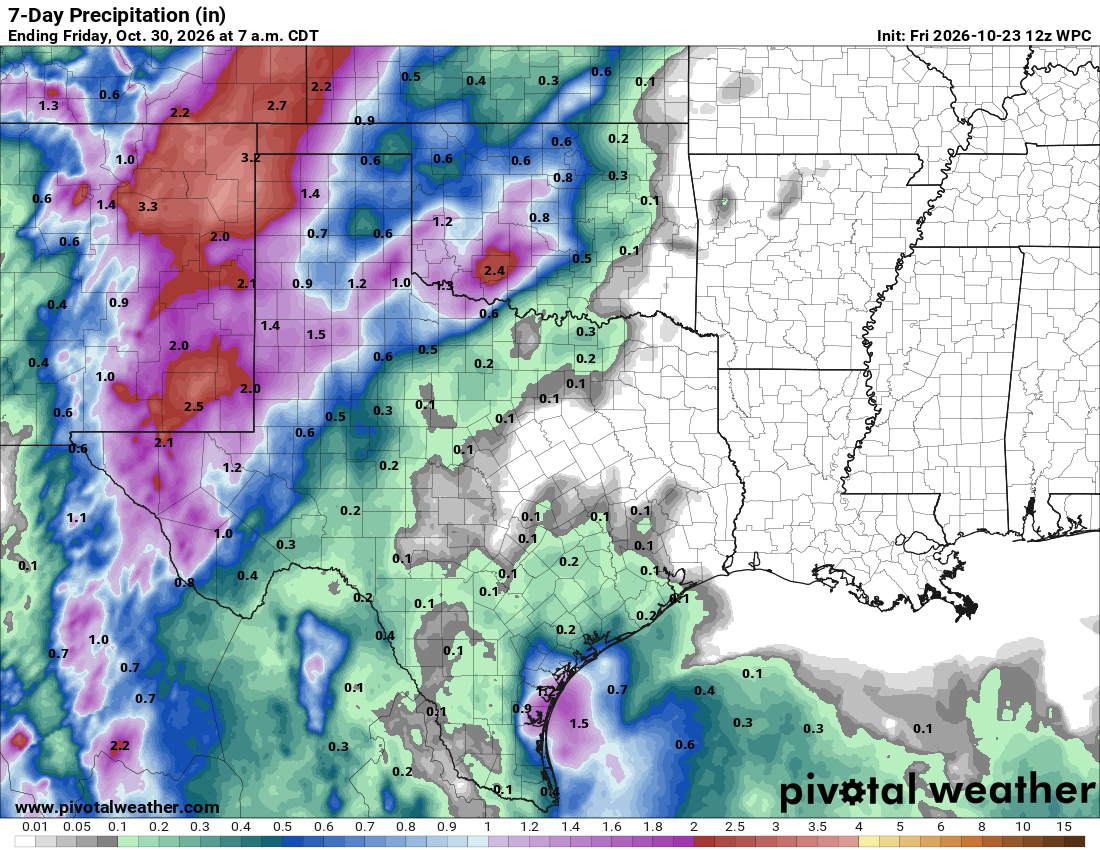
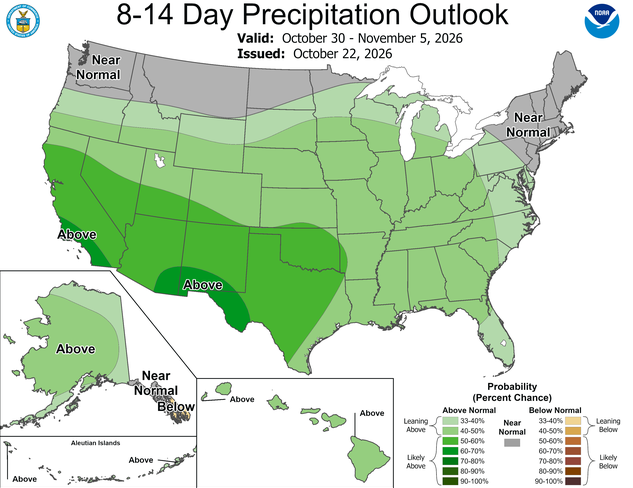
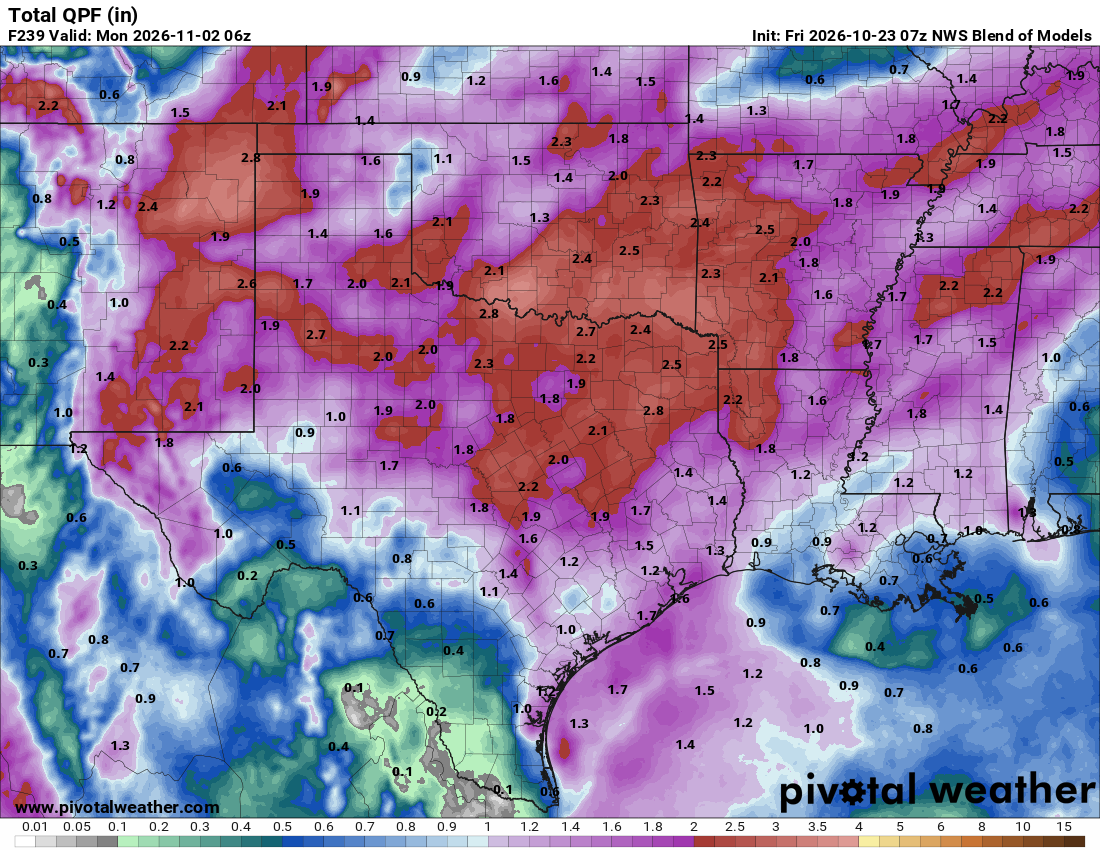
Slide 9: Short-term outlook. These maps will have changed today, but they show
the High Plains moisture plume from the Tropics, and a general wet pattern as
we head from September into October.


Slide 10: Not sure why they got out of order. "No, YOU'RE OUT OF ORDER! THIS
WHOLE SLIDE DECK IS OUR OF ORDER!" Where's my Oscar nomination? This once again
shows the classic El Nino footprint, and I've showed you these last week.
Increased odds of above normal precipitation, and equal chances of above-,
below- and near-normal temperatures. The key there is no increased odds of
above-normal temperatures, like we've seen continuously on the outlooks since
last summer.


Slide 11: The pretty one. The CPC's drought outlook through December, based off
those Oct-Dec outlooks of above-normal precip and the nondescript temperature
one...drought should improve (but not be removed completely) over much of the
state, and be removed completely in a few smaller areas.


Slide 12: You're still here? It's Over. Go Home. Go.

Gary McManus
State Climatologist
Oklahoma Mesonet
Oklahoma Climate Survey
gmcmanus@ou.edu

September 22 in Mesonet History

Record Value Station Year
Maximum Temperature 102°F HOLL 2023
Minimum Temperature 36°F EVAX 2018
Maximum Rainfall 7.63 inches SEIL 1997

Mesonet records begin in 1994.

Contact the Ticker

Follow the Ticker via the Mesonet social media accounts on Bluesky, X, or Facebook, or subscribe to our RSS feed.

To subscribe to or unsubscribe from the Ticker mailing list, or for questions about the Ticker or its content, please contact the Ticker Manager at OCS:

(405) 325-2253

ticker@mesonet.org