Ticker for June 3, 2022
CORRECTION: I inadvertently characterized "sensible heat flux" as "latent heat
flux." Many thanks to the several of you who caught my mistake. It's an important
concept so I'm sending out a corrected Ticker.
Apologies to your e-mail inboxes.
"Inadvertently," the
MESONET TICKER ... MESONET TICKER ... MESONET TICKER ... MESONET TICKER ...
June 3, 2022 June 3, 2022 June 3, 2022 June 3, 2022
Pool fail

There are three big things that help keep out summers on the mild side (that was
my anthem in my younger days..."Take a walk on the mild side"):
1) Abundant soil moisture
B) Rain (i.e., cloudiness)
III) Poorly formatted lists
The abundant soil moisture works in two ways...no, I will NOT attempt another list.
The first thing it does is keep our vegetation green and lush, like how I prefer
my bread. You keep that vegetation going during the summer and you give the sun
less chance to heat the surface (and evaporate more soil moisture). So you keep
the sensible heat flux down. In other words, you keep the sun's rays from being
absorbed by the earth's surface and being transformed into heat energy.
So let's take a look at soil mositure. And moisture, for those that can
spell.
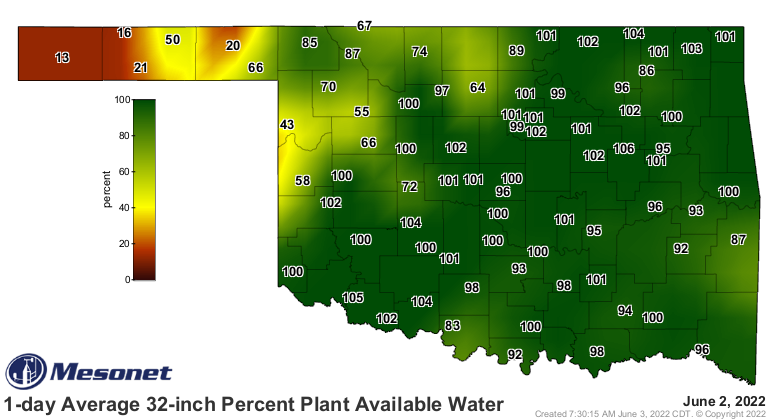
The 32-inch plant available water plot from the Mesonet shows that column of
soil from the surface down to, uhhh, 32 inches, is fairly moist over much of
the state. Some resilient dryness, especially in the Panhandle and west central
OK, but a LOT better than we saw previously. Here's a bit more about our
plant available water data.
"The 1-day Average 32-inch Percent Plant Available Water map is
derived by dividing the current daily 32-inch Plant Available
Water value by the theoretical maximum 32-inch plant available
water amount for each individual Mesonet site. The percent reported
is for the soil column from the soil surface down to the 32-inch
depth. Percents may go above 100% or below 0% due to variation
between individual sensors and sensor locations. The theoretical
maximum plant available water was calculated from depth specific
soil analysis for each Mesonet site. Plant Available Water values
are 24-hour averages, updated each day after midnight. Most plants
experience water stress when less than 50% of the maximum plant
available water remains in the active root zone."
So that should help keep that vegetation green for the foreseeable future. How
is the vegetation doing? Well, a LOT better than it was. Here is a plot of our
current relative greenness.

Still pretty sparse in the southwest. Some of that is probably due to how the
drought impacted plant life for the last year...some died and never came back.
But we also probably have a lot of wheat fields that failed and obviously not
replanted in the midst of a drought. But give it time with the current soil
moisture and time of year...I think it can make a comeback. The Panhandle
is obviously hurting. To see a good spring, we only have to go back to last
year at this time for comparison.

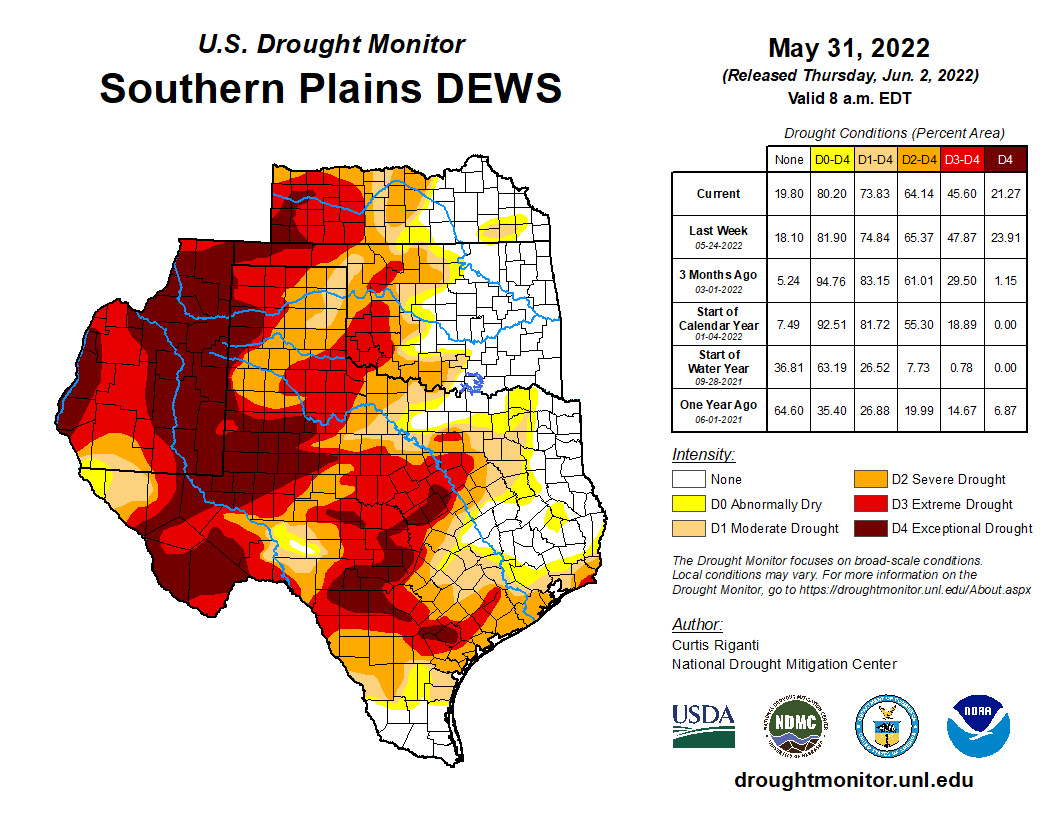
The western Panhandle is in REALLY bad shape, which is why much of it is still
in extreme to exceptional drought.
These are areas of "weakness," I'd say, where the sun can do some work and
create some problems...that sensible heat transfer business that heats up the
surface and right above it, where we live.
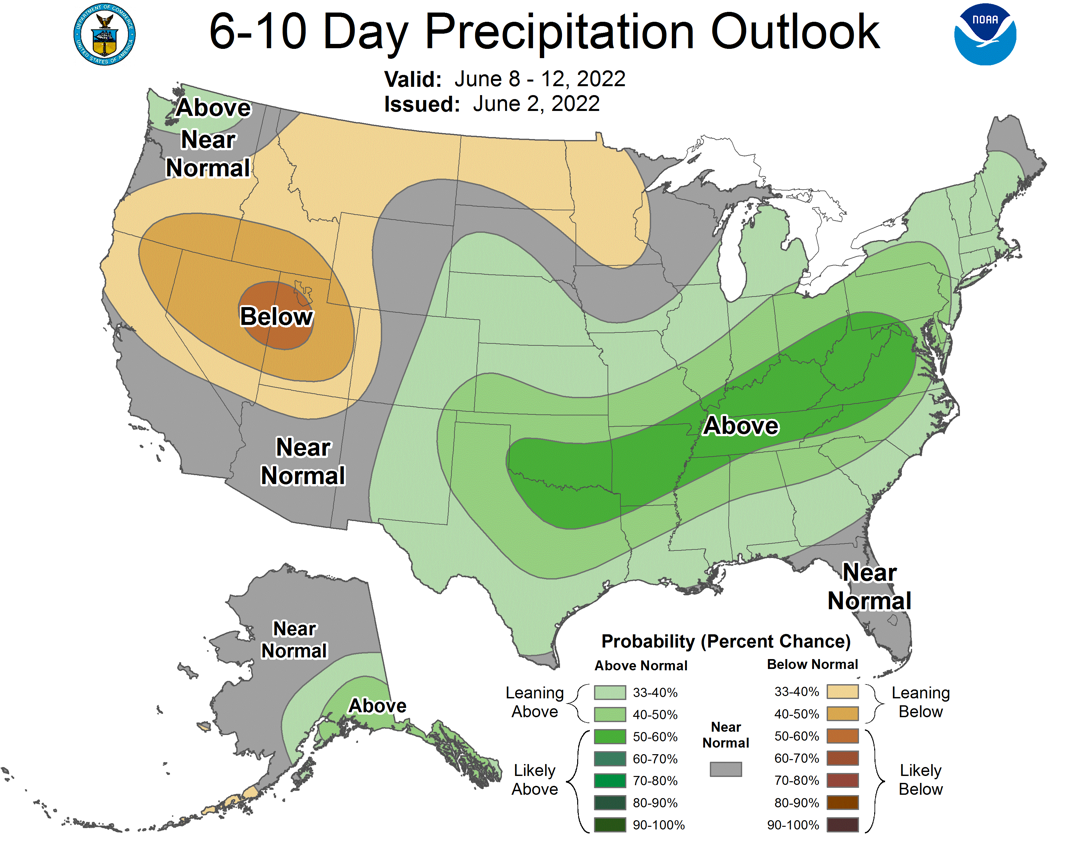
So how about rain? When it rains, it's cloudy. SCIENCE! It would appear our
rainy season is not close to being finished, not only this weekend but well into
next week.
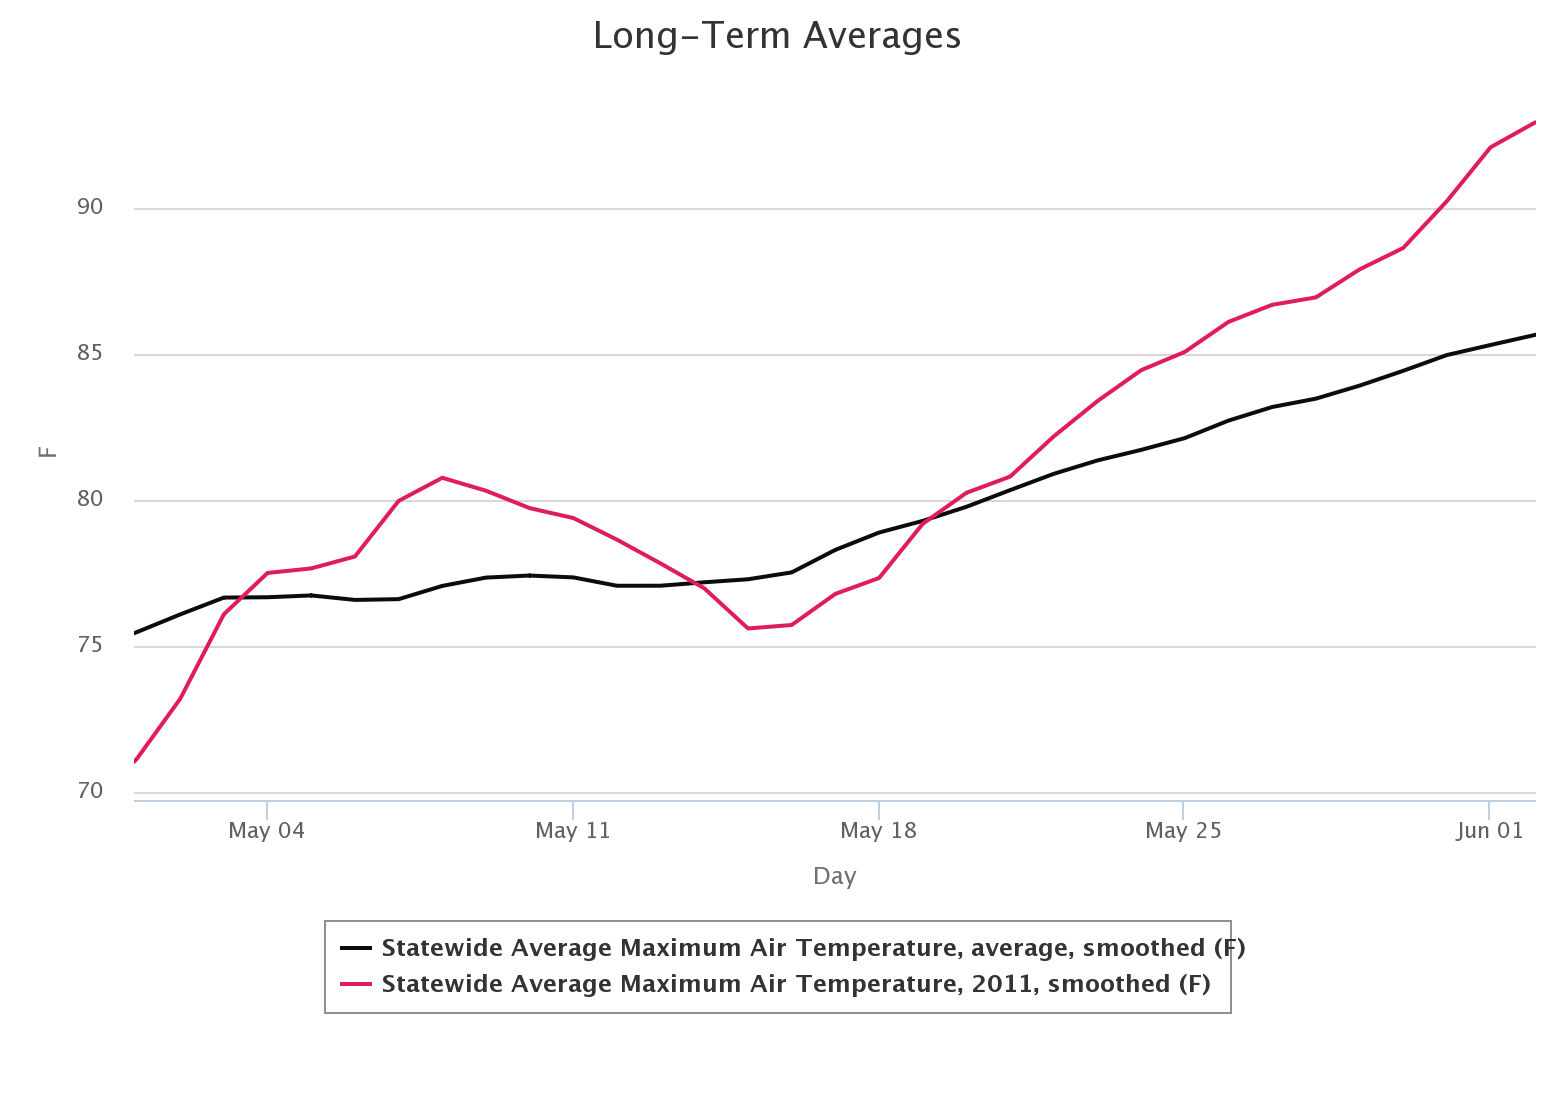
So our worries about having another summer of 2011 "probably" are and were
unfounded. Oh, there was some cause for alarm, with all that heat across the
western half of the state early on in May. It did look eerily like 2011, but
that abruptly came to a halt the last week of last month, and it ain't changing
anytime soon.
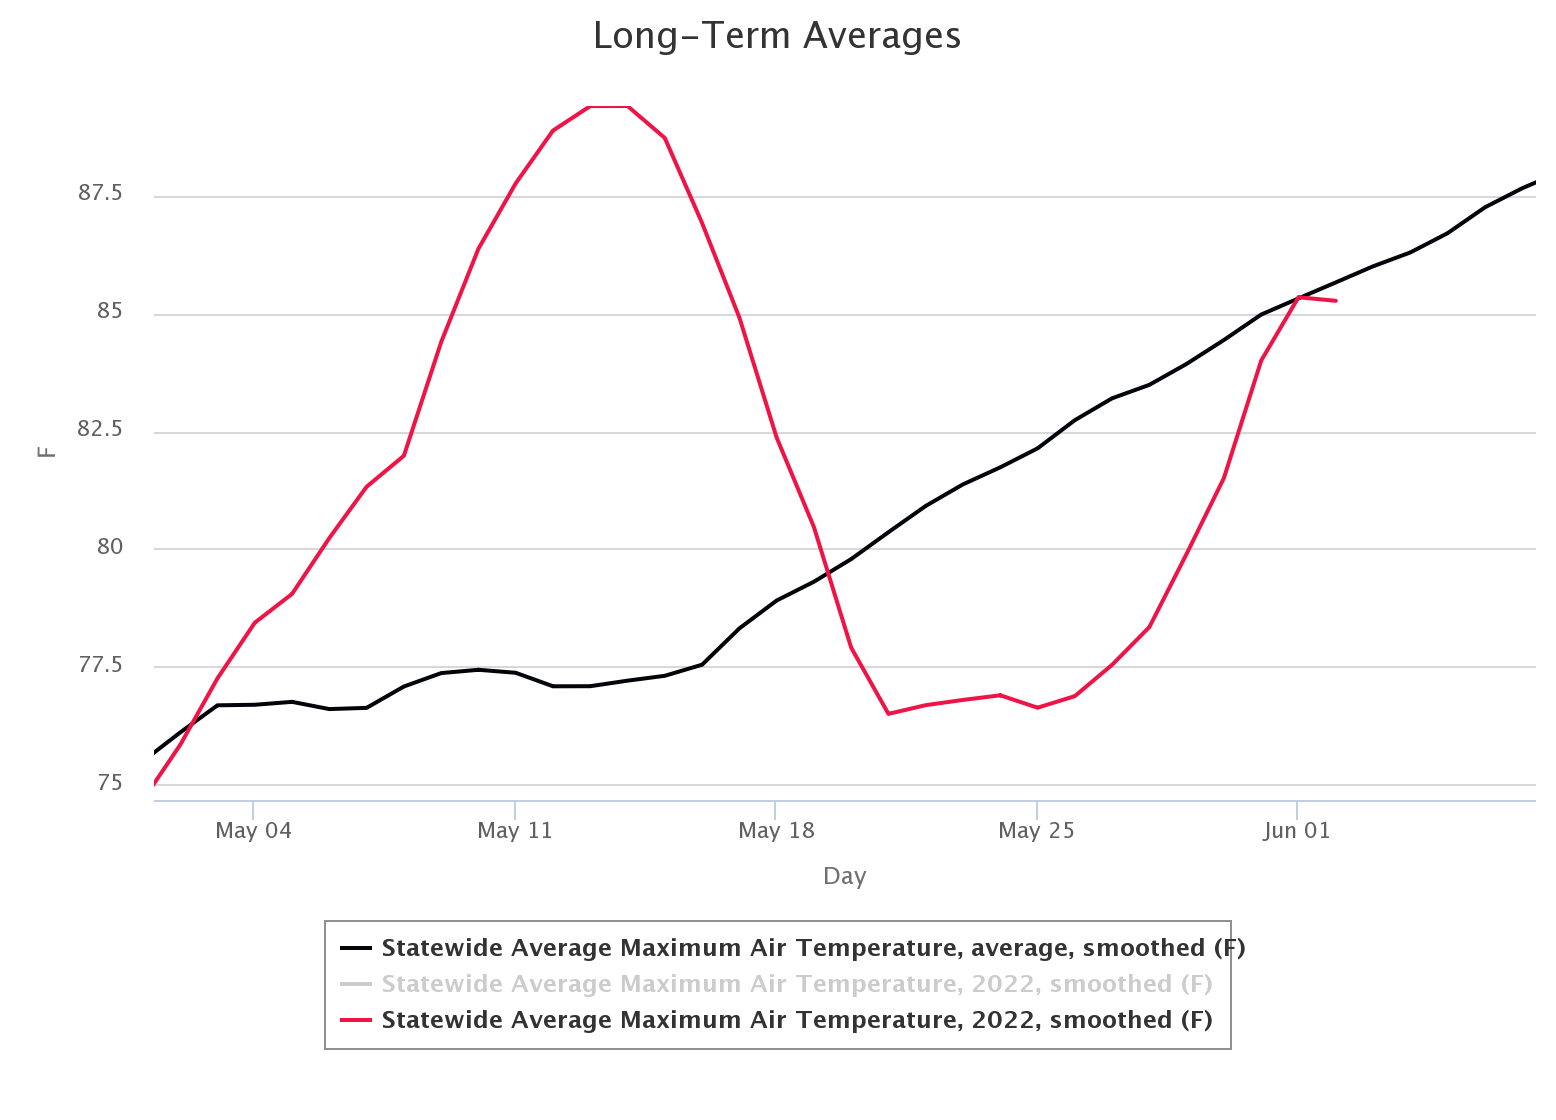
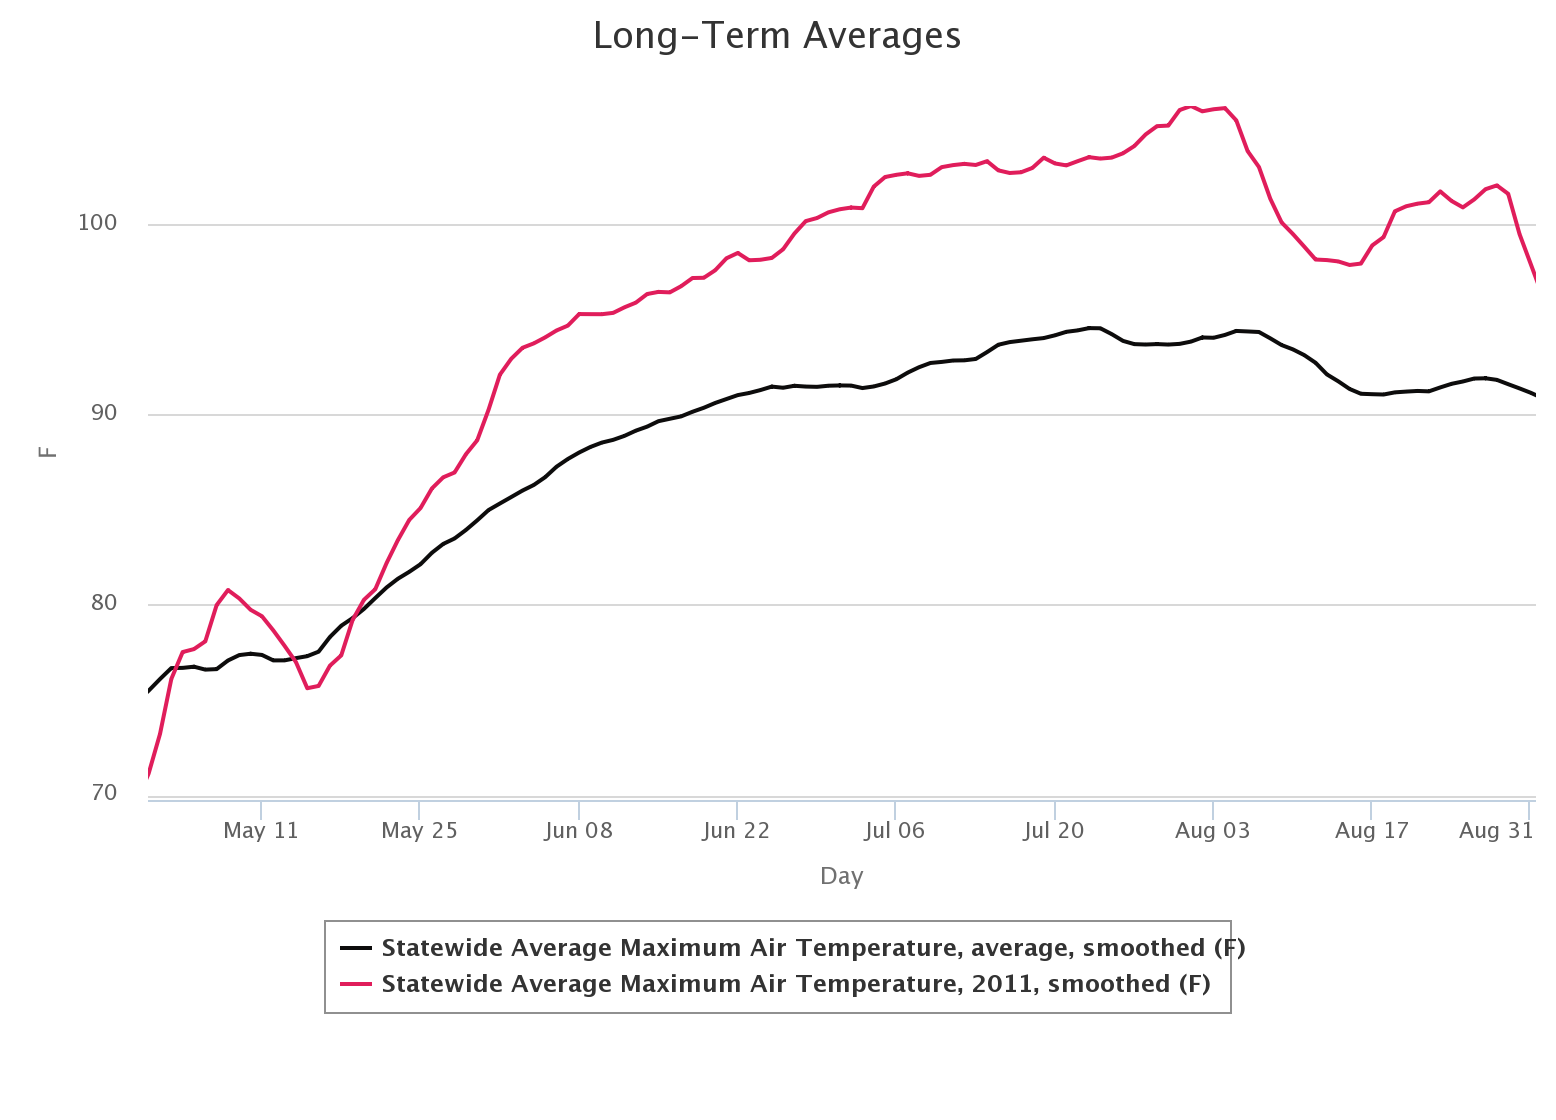
But compare that with that same time frame in 2011, and there is no large dip
in statewide highs corresponding with a bunch of rain that killed some of that
sensible heat flux...it was close to average, but also steadily marching upwards.
And here you can see what it did for the rest of that summer. Obviously we're
not headed in that direction currently, at least for the next couple of weeks.
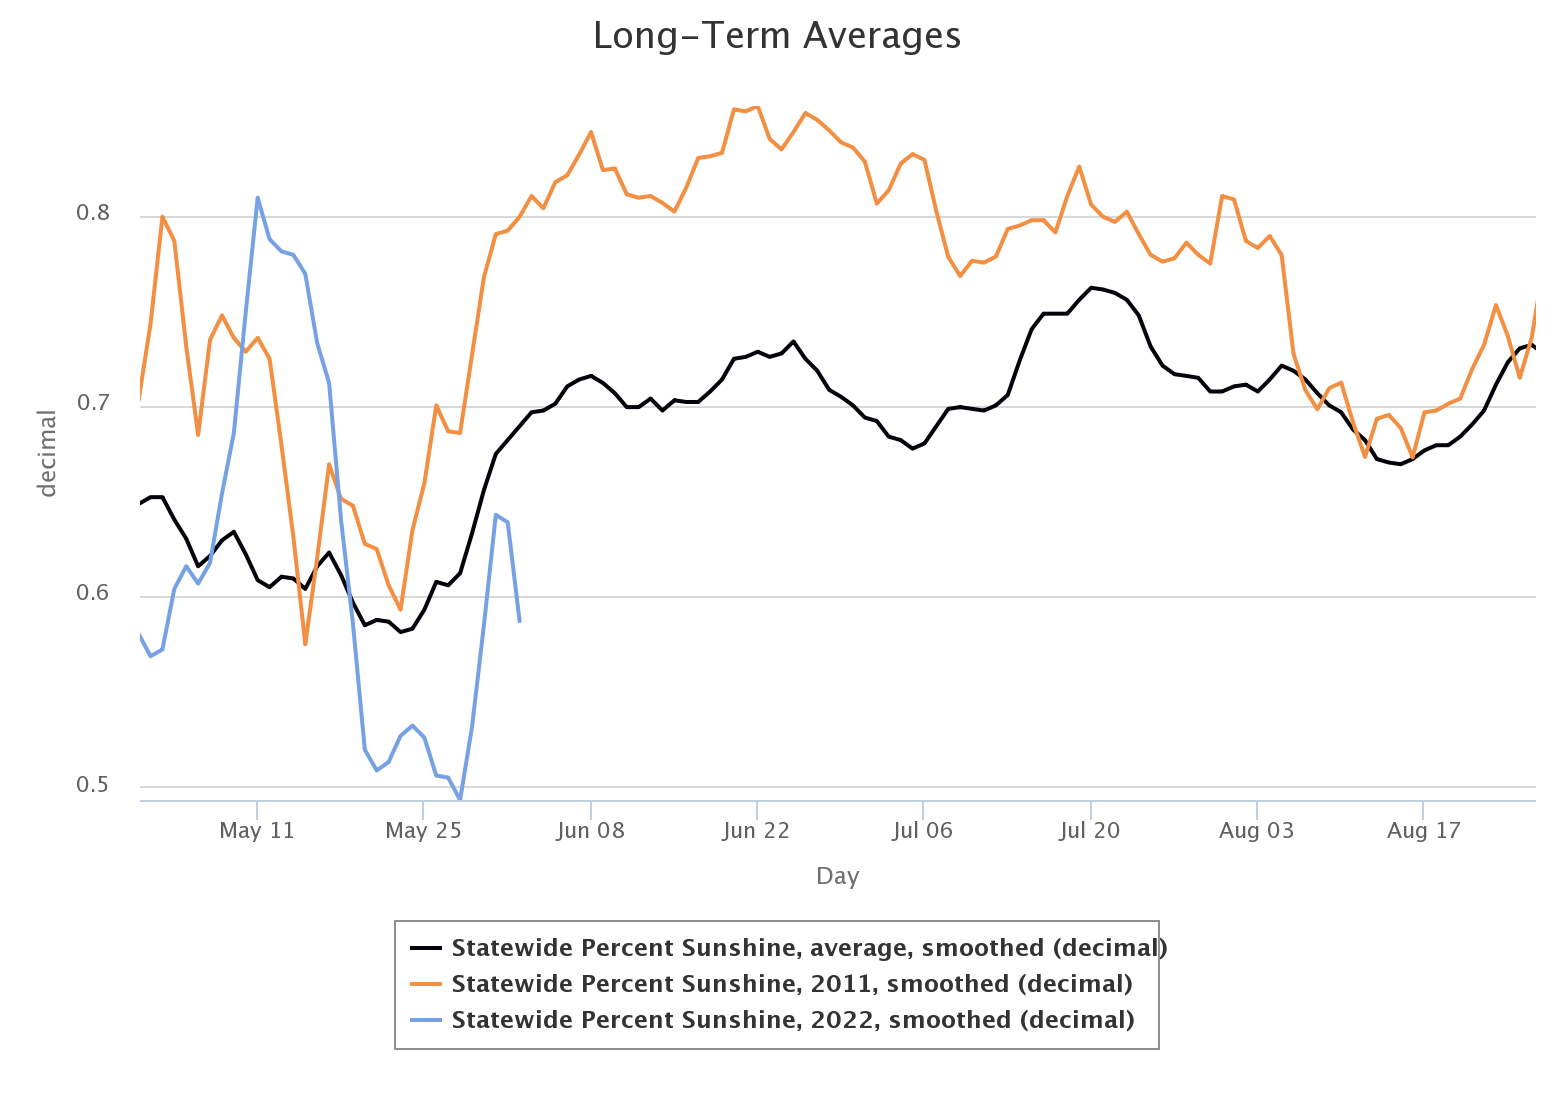
More proof of this cloudy/sunny connection to our bad summers, check out the
percent possible sunshine for the May-August period in 2011 (orange) vs. this
year (blue), also vs. that long-term average (black).
Hey, this ain't rocket science. It's CLIMATE science. Wetter summers normally
equal cooler summers in OK, as these long-term graphs of our statewide summer
(June-August) temperatures and precip show. I threw a few lines in to help you
match up the years.

The summer of 2011 extremes stand out quite remarkably.
So there you have it, my prediction of a milder summer, which will probably be
completely wrong and we'll be in dire shape by the end of August. The one worry
is all that heat and drought poised to our South and West.
That's a lot of trouble that could blow up our way on sustained southwesterly
windy days.
Anyway, still looking to warm that pool? Might take a bit longer.
Gary McManus
State Climatologist
Oklahoma Mesonet
Oklahoma Climatological Survey
gmcmanus@mesonet.org
June 3 in Mesonet History
| Record | Value | Station | Year |
|---|---|---|---|
| Maximum Temperature | 108°F | ALTU | 2008 |
| Minimum Temperature | 45°F | EVAX | 2018 |
| Maximum Rainfall | 5.20 inches | FTCB | 1995 |
Mesonet records begin in 1994.
Search by Date
If you're a bit off, don't worry, because just like horseshoes, “almost” counts on the Ticker website!