Ticker for March 15, 2021
MESONET TICKER ... MESONET TICKER ... MESONET TICKER ... MESONET TICKER ...
March 15, 2021 March 15, 2021 March 15, 2021 March 15, 2021
Spring Break normalcy
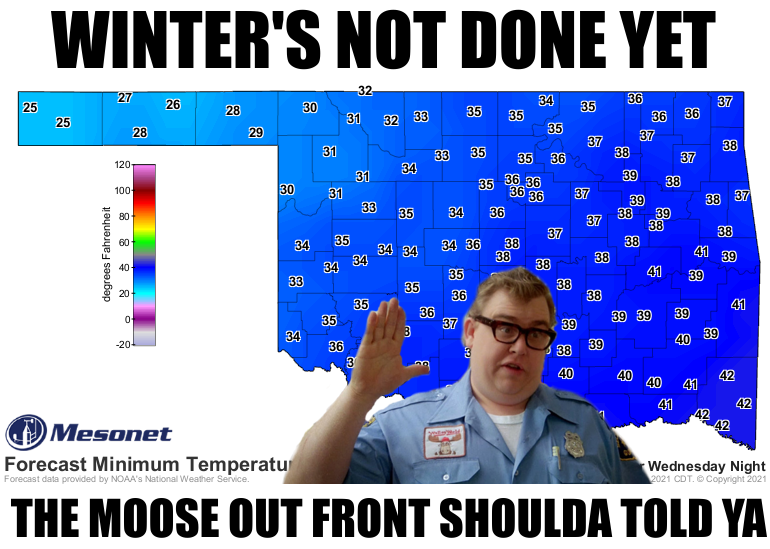
So let me get this straight...we could see tornadoes and other fun severe weather
modes Tuesday evening, then snow in the Panhandle that night into the next
morning? Oh yeah, it's definitely spring break in Oklahoma. Here are the
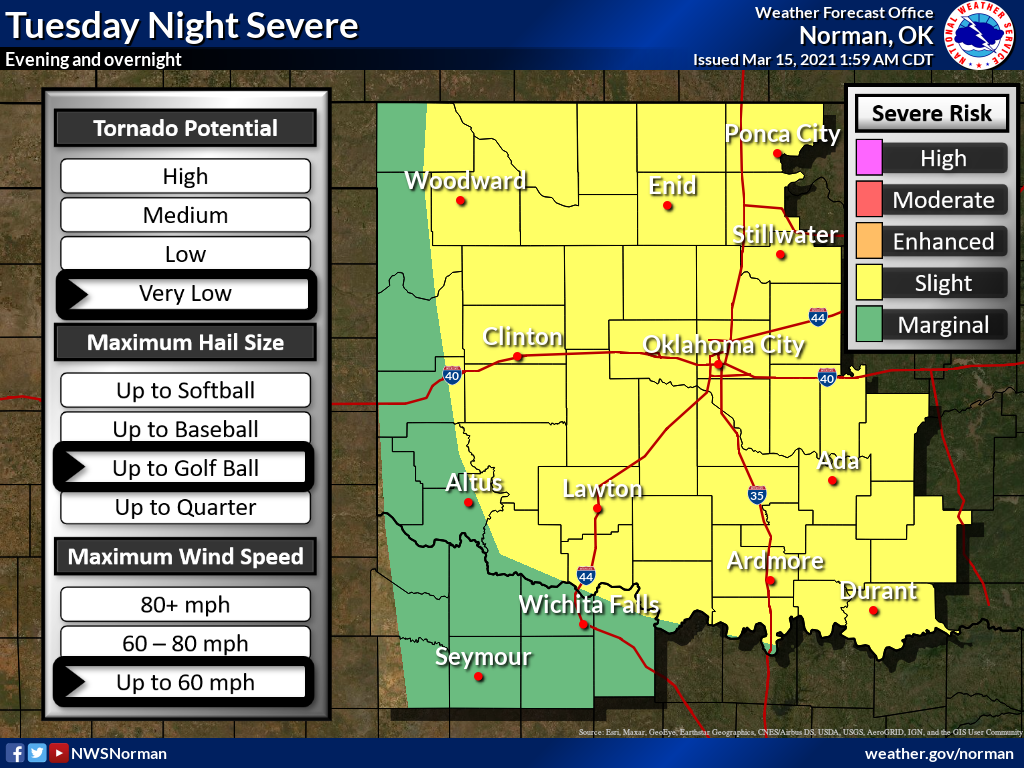
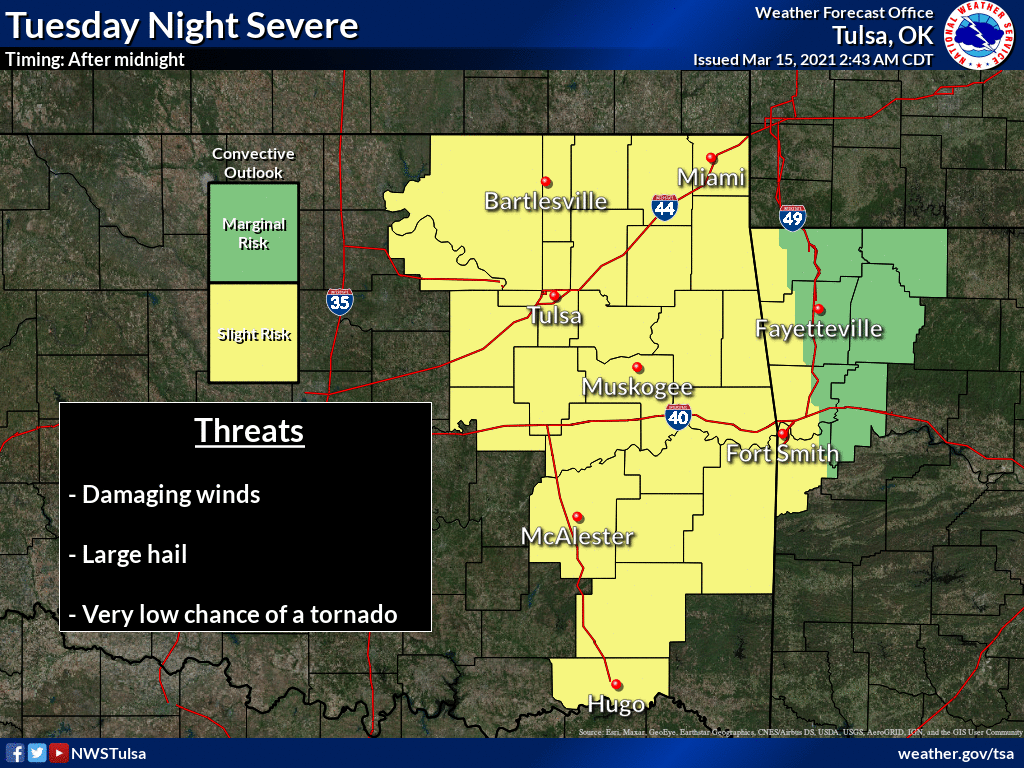
representations of the crazy weather for Tuesday/Wednesday from our NWS friends.
STORMS:
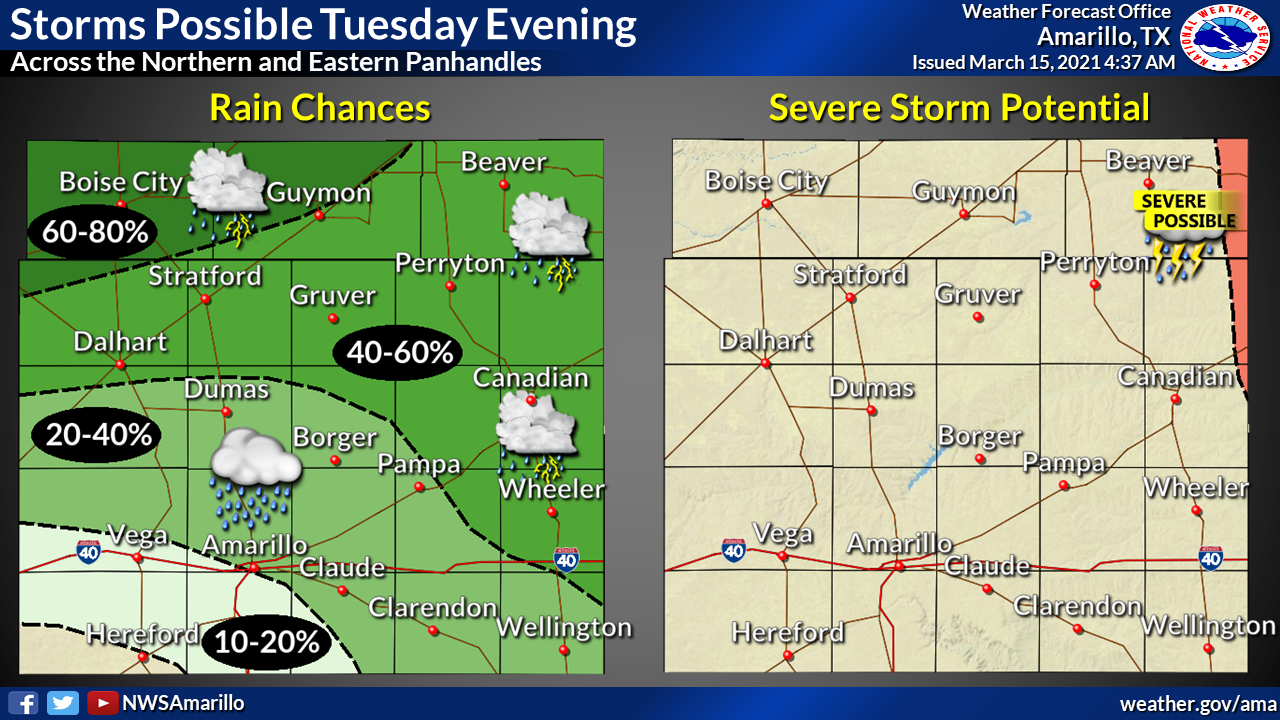
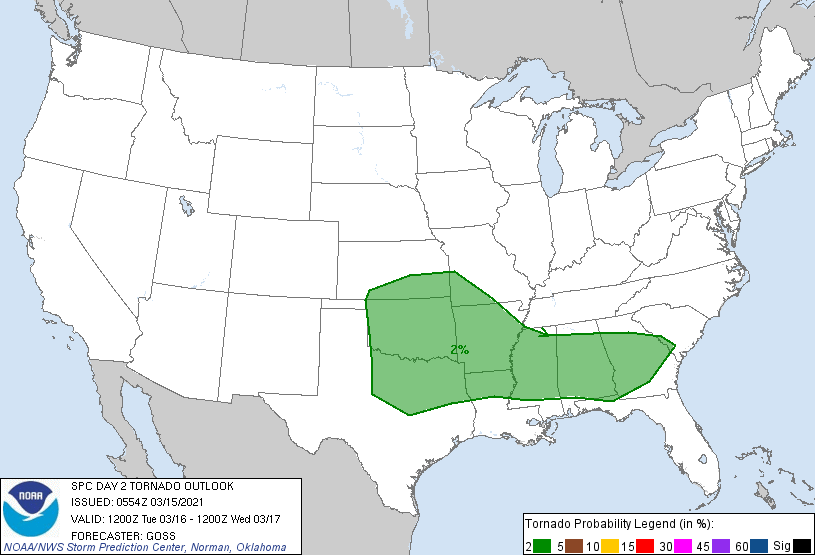
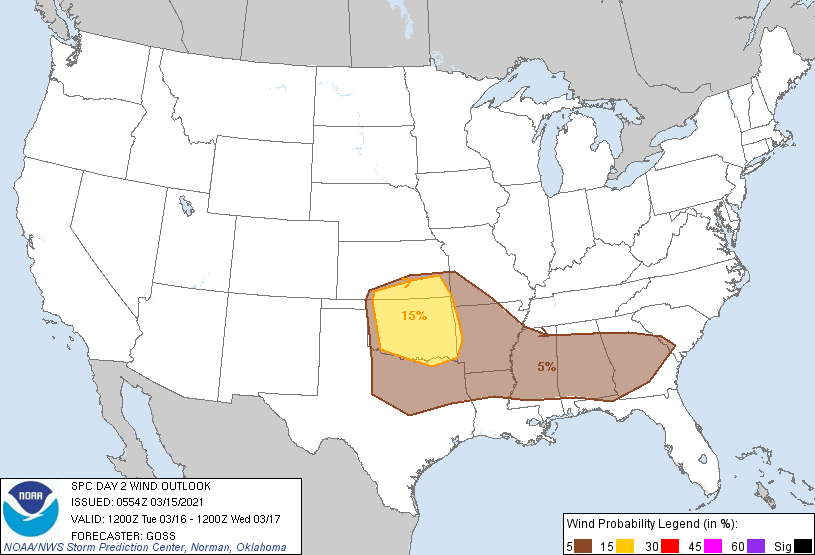
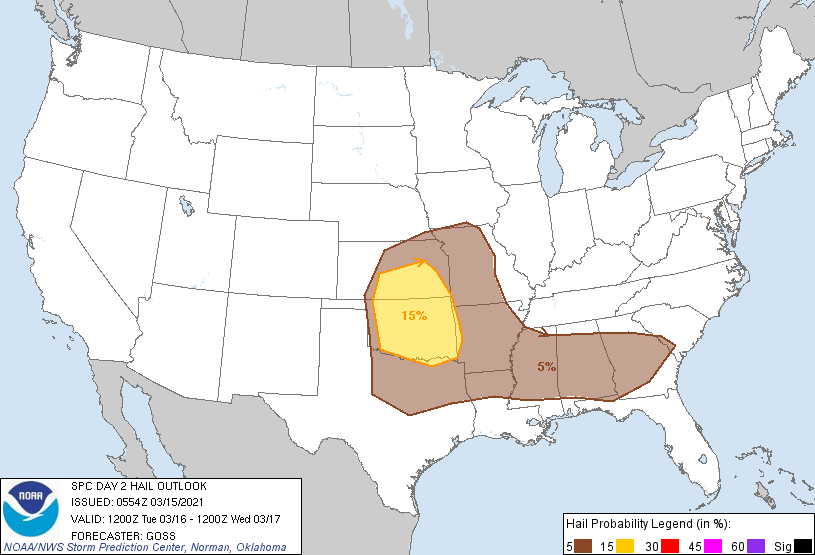
SNOW:
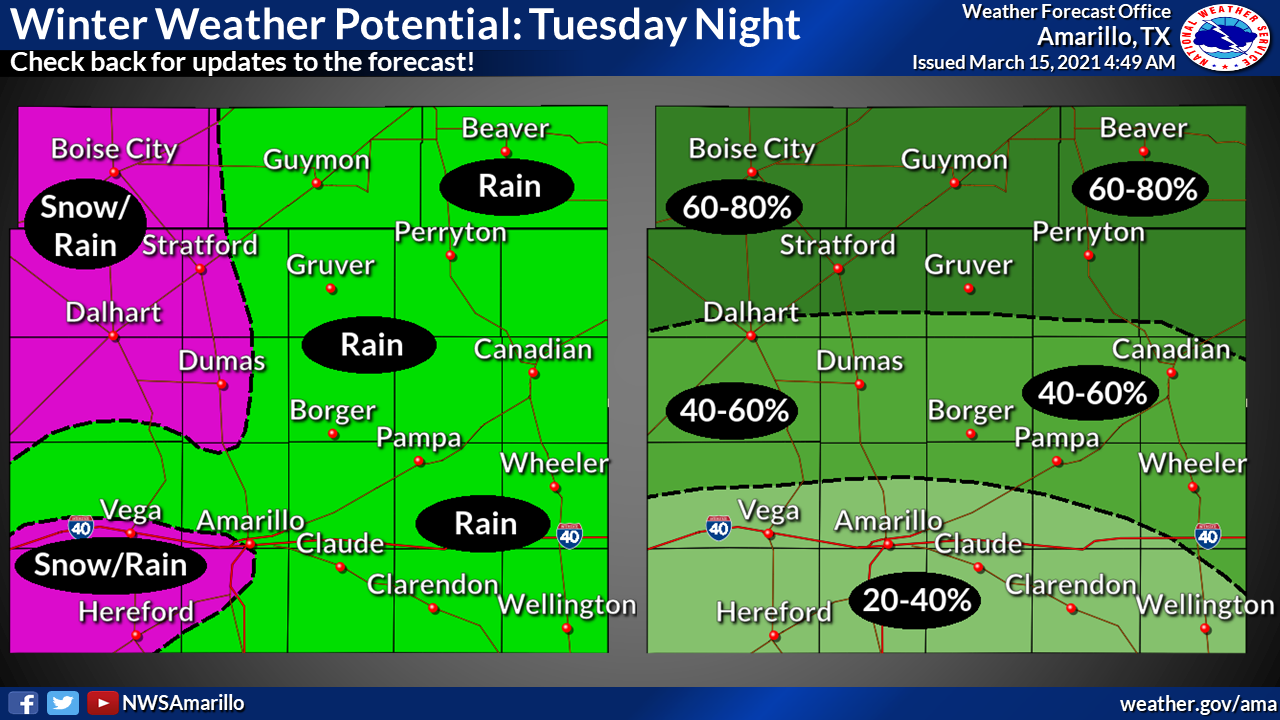
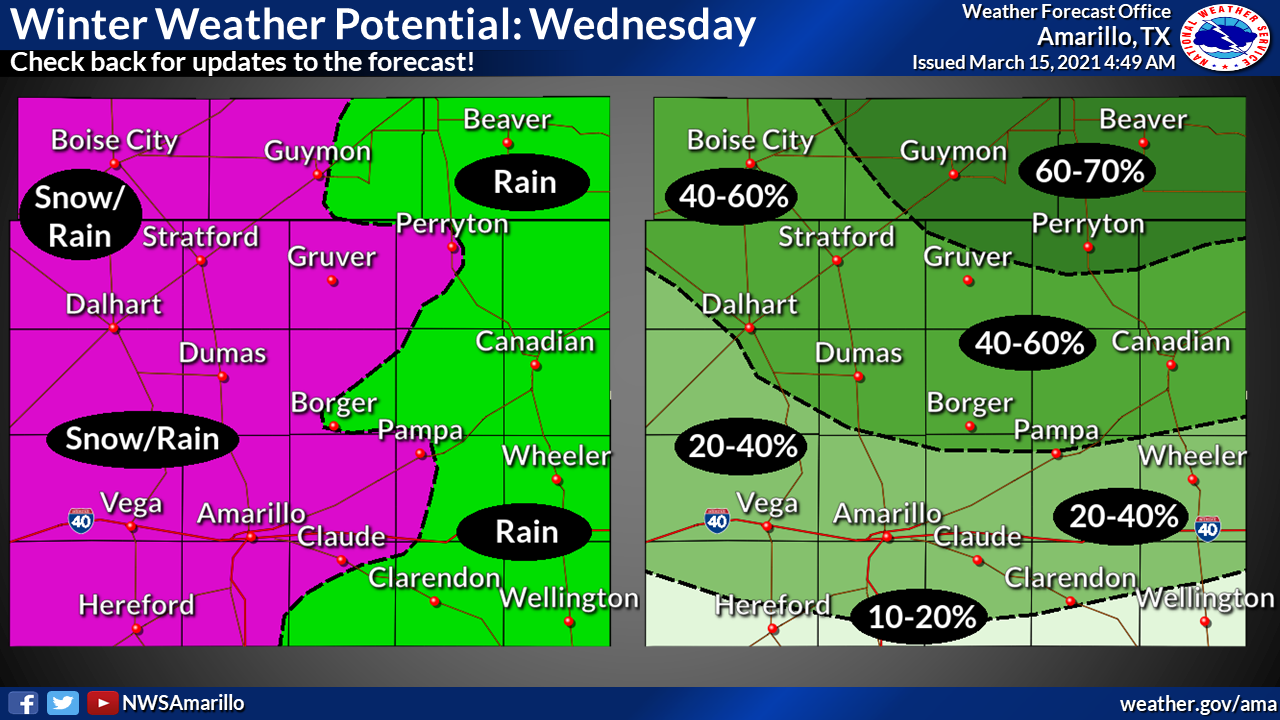
All of that is subject to change, of course, but that's the way it's looking
right now. There could be several inches of snow in the western Panhandle
by Wednesday, or just a dusting. There could be several tornadoes across the
main body of the state Tuesday evening, or just some wind and hail. Tomorrow
is definitely a day to stay weather aware.
It does look like the NW will have another good (bad?) freeze. Wednesday
morning and Thursday morning will like dip below 32 degrees in that area of
the state, especially on Thursday.
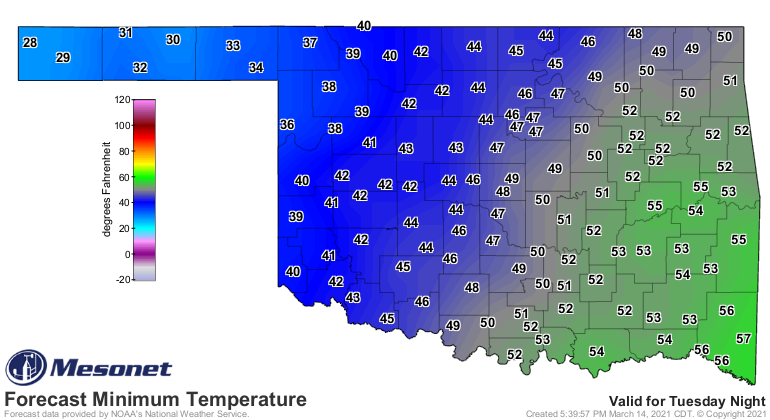
This is after a really warm (and windy, obviously) Tuesday afternoon. Speaking
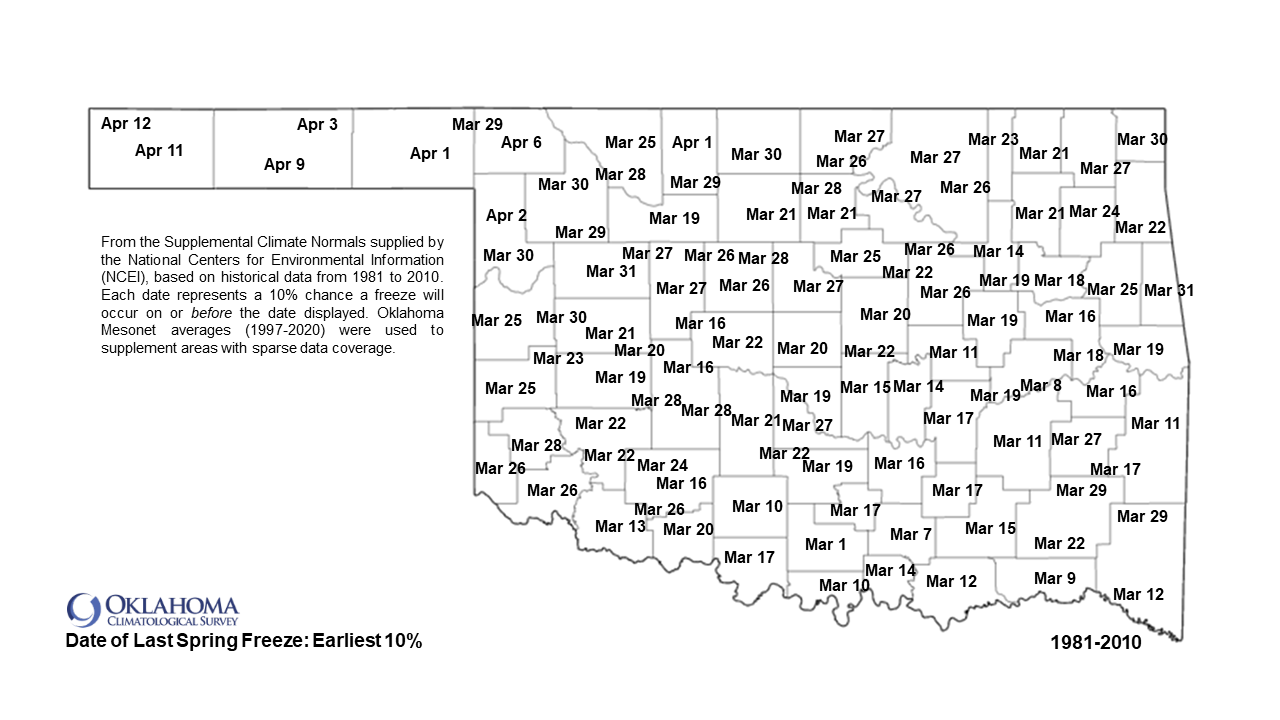
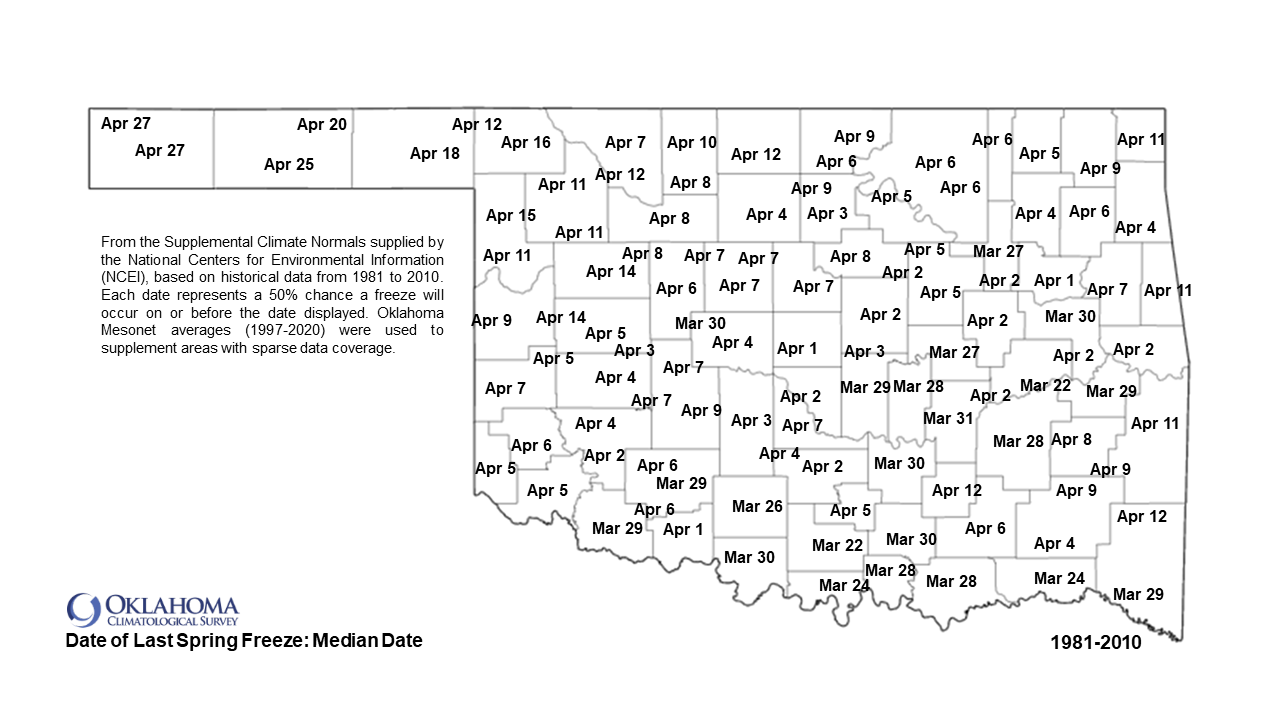
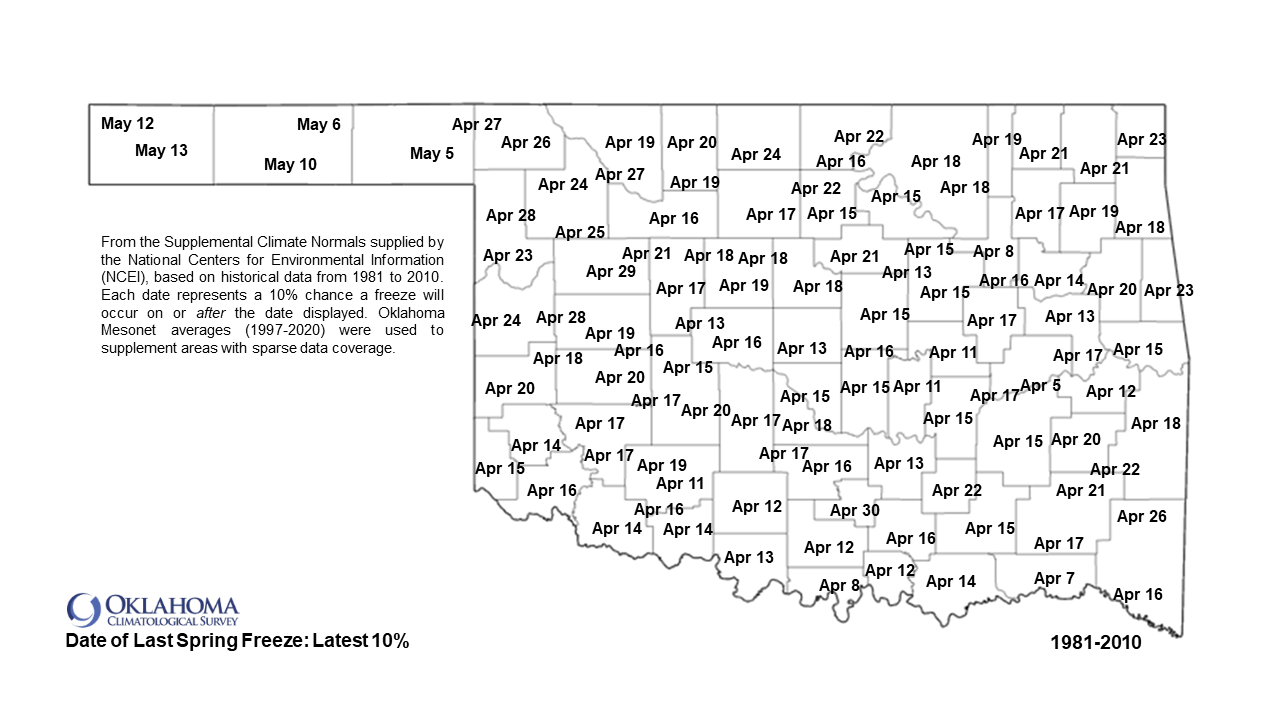
of freezes, we have reconfigured our spring freeze maps. Where previously we
used color contours to represent freeze dates, we decided to just go with the
actual dates themselves since there are at times significant differences within
short differences in those freeze dates. NCEI produced supplemental climate
normals (1981-2010) with those freeze dates for most NWS cooperative observing
sites in the state. However, in the case of eastern Oklahoma, where somewhat
large gaps were left in coverage, we used our own Mesonet data (1997-2020) to
compute those freeze dates. The dates on these maps are percentiles, so they're
not the single-earliest or single latest dates, since those are biased towards
extreme events. The earliest final spring freeze is represented by the 10th
percentile dates, meaning each date represents a 10% chance a freeze will occur
on or BEFORE the date displayed. The average final spring freeze date is the
50th percentile date, so it is also not biased towards any abnormally early or
late final freezes. And the latest final spring freeze is represented by the
latest 10%, meaning there is a 10% chance a freeze will occur on or AFTER the
date displayed.
After all that gobblety-goop, here are the maps. This week's freeze should not
come as a shock, since we're still a month away from the average final freeze
in NW OK, and a good 2-3 weeks for much of the rest of the state.
If you see anything hokey, be sure and let us know. If you state at those maps
long enough, date madness sets in. NCEI will release the new climate normals
for 1991-2020 this May, so we will see those maps updated by then. We'll update
the fall first freeze maps after that as well.
Gary McManus
State Climatologist
Oklahoma Mesonet
Oklahoma Climatological Survey
(405) 325-2253
gmcmanus@mesonet.org
March 15 in Mesonet History
| Record | Value | Station | Year |
|---|---|---|---|
| Maximum Temperature | 88°F | ALV2 | 2013 |
| Minimum Temperature | 14°F | SLAP | 1997 |
| Maximum Rainfall | 3.96″ | WILB | 2014 |
Mesonet records begin in 1994.
Search by Date
If you're a bit off, don't worry, because just like horseshoes, “almost” counts on the Ticker website!