Ticker for August 17, 2015
MESONET TICKER ... MESONET TICKER ... MESONET TICKER ... MESONET TICKER ...
August 17, 2015 August 17, 2015 August 17, 2015 August 17, 2015
Godzilla El Nino explained, Okie style
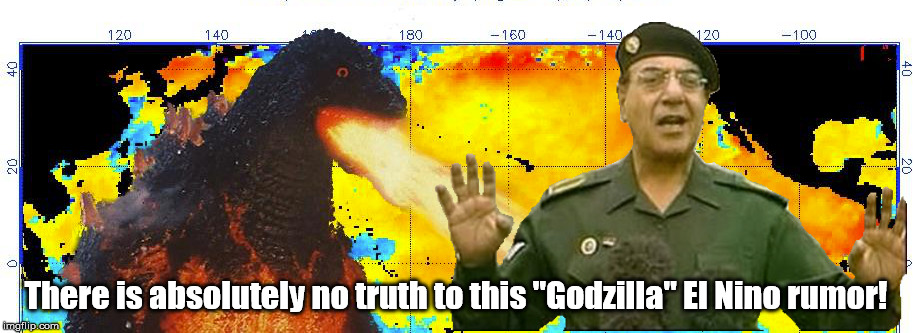
The climate community is really hyping this El Nino. Godzilla. Bruce Lee. Fat
Elvis (that one is mine!). All meant to convey a sense of urgency for a CLIMATE
phenomenon, of all things. It's like naming winter. I know, how about "winter."
Of course, somebody named fall "autumn" so I guess there is precedent. But have
you ever seen the Ticker hype ANYTHING?
We now interrupt this Ticker for some important breaking weather news:
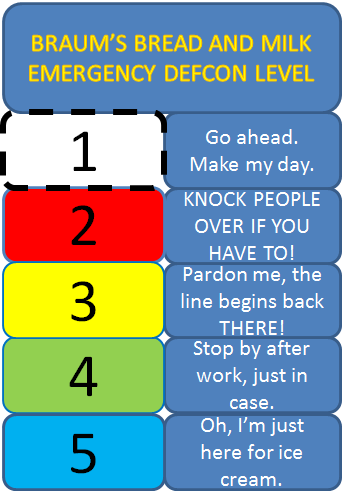
Watch out for December 13th, folks. We're already seeing indications of
a BIG winter storm on that day. So big that we already have the BRAUM'S
BREAD AND MILK DEFCON set at LEVEL ONE!!
Okay, we're back. Again, the constant hype does seem counter-productive at
times, but I guess it does get you to pay attention. This one is still a bit
fuzzy to deal with though, especially when it's a teleconnection (i.e., it doesn't
impact us directly, its ramifications are a few chain-of-events down the road from
its origin in the equatorial south pacific). You've heard lots of things one way or
another about this El Nino, even from the Ticker staff. I have used it as justification
concerning the odds of 2015 beating our record statewide average rainfall total
from 1957. But how about we cut through some of the chaff and see if we can
interpret some of what is going on, pure Okie style.
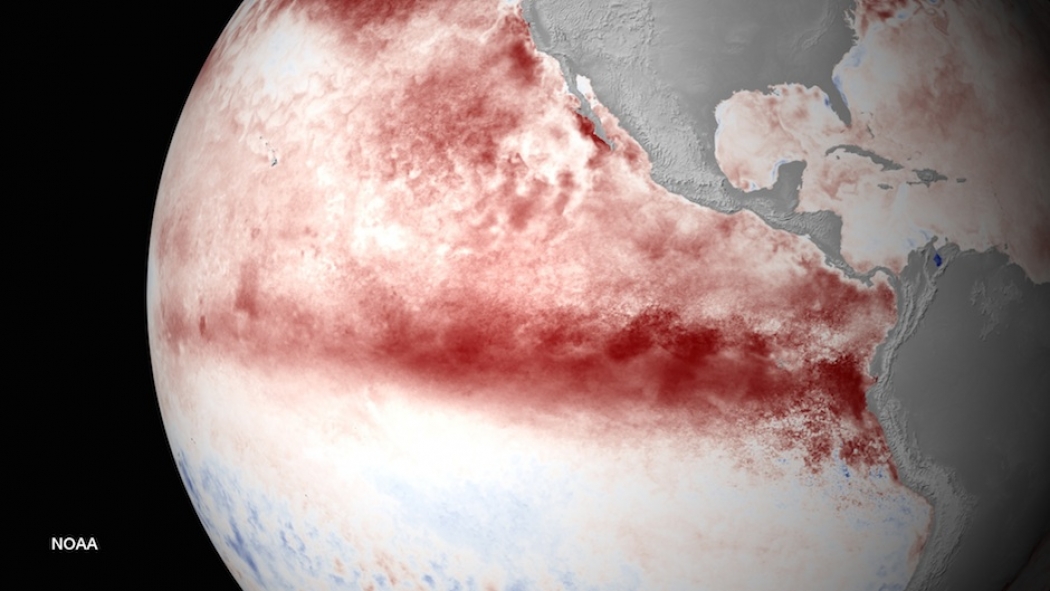
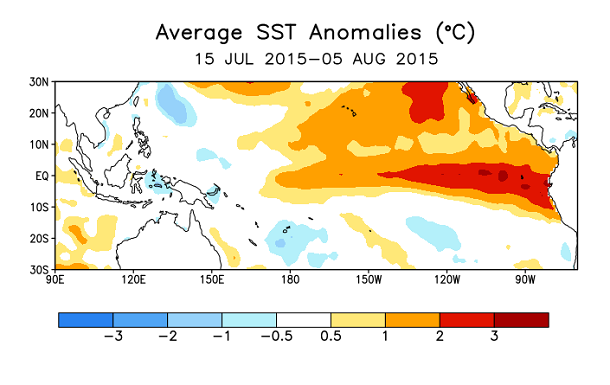
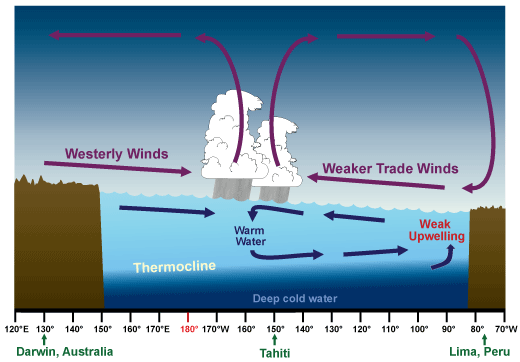
Yes, we are in the midst of a significant warming of the ocean waters in
conjunction with a lessening of the easterly trade winds in the equatorial
pacific. That's sort of a chicken-and-egg conundrum with the winds and SST
anomalies, both of which are needed to drive an El Nino event. The lessening
of those Easterlies allow some of the warm water that has piled up in the western
pacific to slosh back to the east, setting up the type temperature pattern we see now
(illustrated so nicely by NOAA and CPC).
Here's what the process looks like normally, and then during an El Nino, as illustrated
by the fine folks in the NWS Southern Region Headquarters in Ft. Worth.

Now here's where it starts to get interesting (and complicated). I've seen this
explained in various ways, each more confounding than the last, and sometimes
even conflicting. Let me give it a go in my brain's own simplistic (is
there any other choice?) way. The relatively warm water off the west coast of South
America shifts the area of greatest convection from the western Pacific to the
central and eastern side, which in turn causes the dip in the jet stream
produced by that area of convection to also shift to the east. The stronger
the El Nino, the farther to the east that dip will set up. That brings a steady
supply of storms into Southern California and then across the southern tier of
the U.S. Here is a diagram of that process, again courtesy of the fine folks in the
NWS Southern Region HQ.
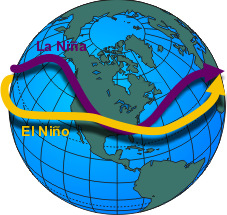
It also shows the position of the trough during a La Nina event, when the
eastern pacific waters are cooler then normal, hence less rising motion and
therefore the dip in the jet stream is much farther to the west. This is the
pattern we had in the cool seasons of 2010-11 and 2011-12 that helped contribute
to our lovely 5-year drought. Here's another more complicated explanation,
should you desire a headache, from the ENSO blog at CPC.
https://www.climate.gov/news-features/blogs/enso/how-enso-leads-cascade-global-impacts
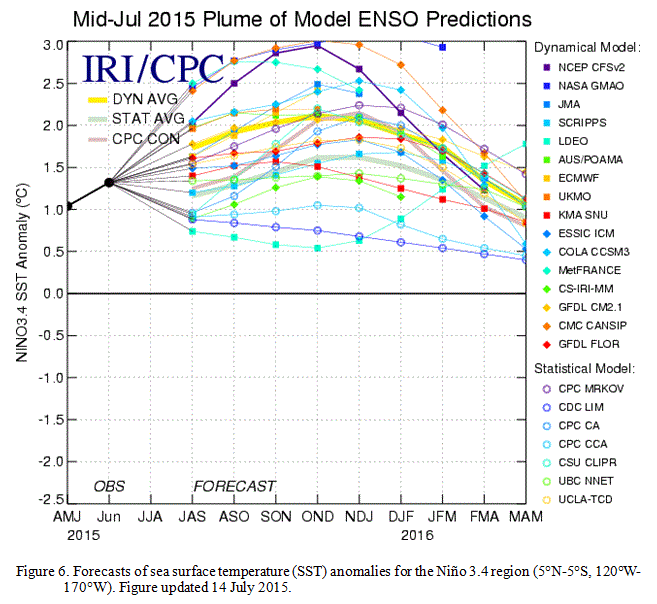
Everybody lost yet? Let's keep going. The word from those that monitor these
things is that the temperature anomalies for late spring through mid-summer
have been as high as they have ever seen for that time of year, and the forecasts
are for the El Nino to strengthen even more as we get into fall and early
winter. This "spaghetti plot" of modeled SST anomalies from IRI/CPC give an idea
of just how high some of the different models are predicting those SST
anomalies to grow. Some models even have the SST anomalies to grow to about 3.5C
above normal, which would make it a notorious "SUPER El Nino" (or Bruce Lee/
Godzilla El Nino). In other words, one of the strongest on record (since 1950).
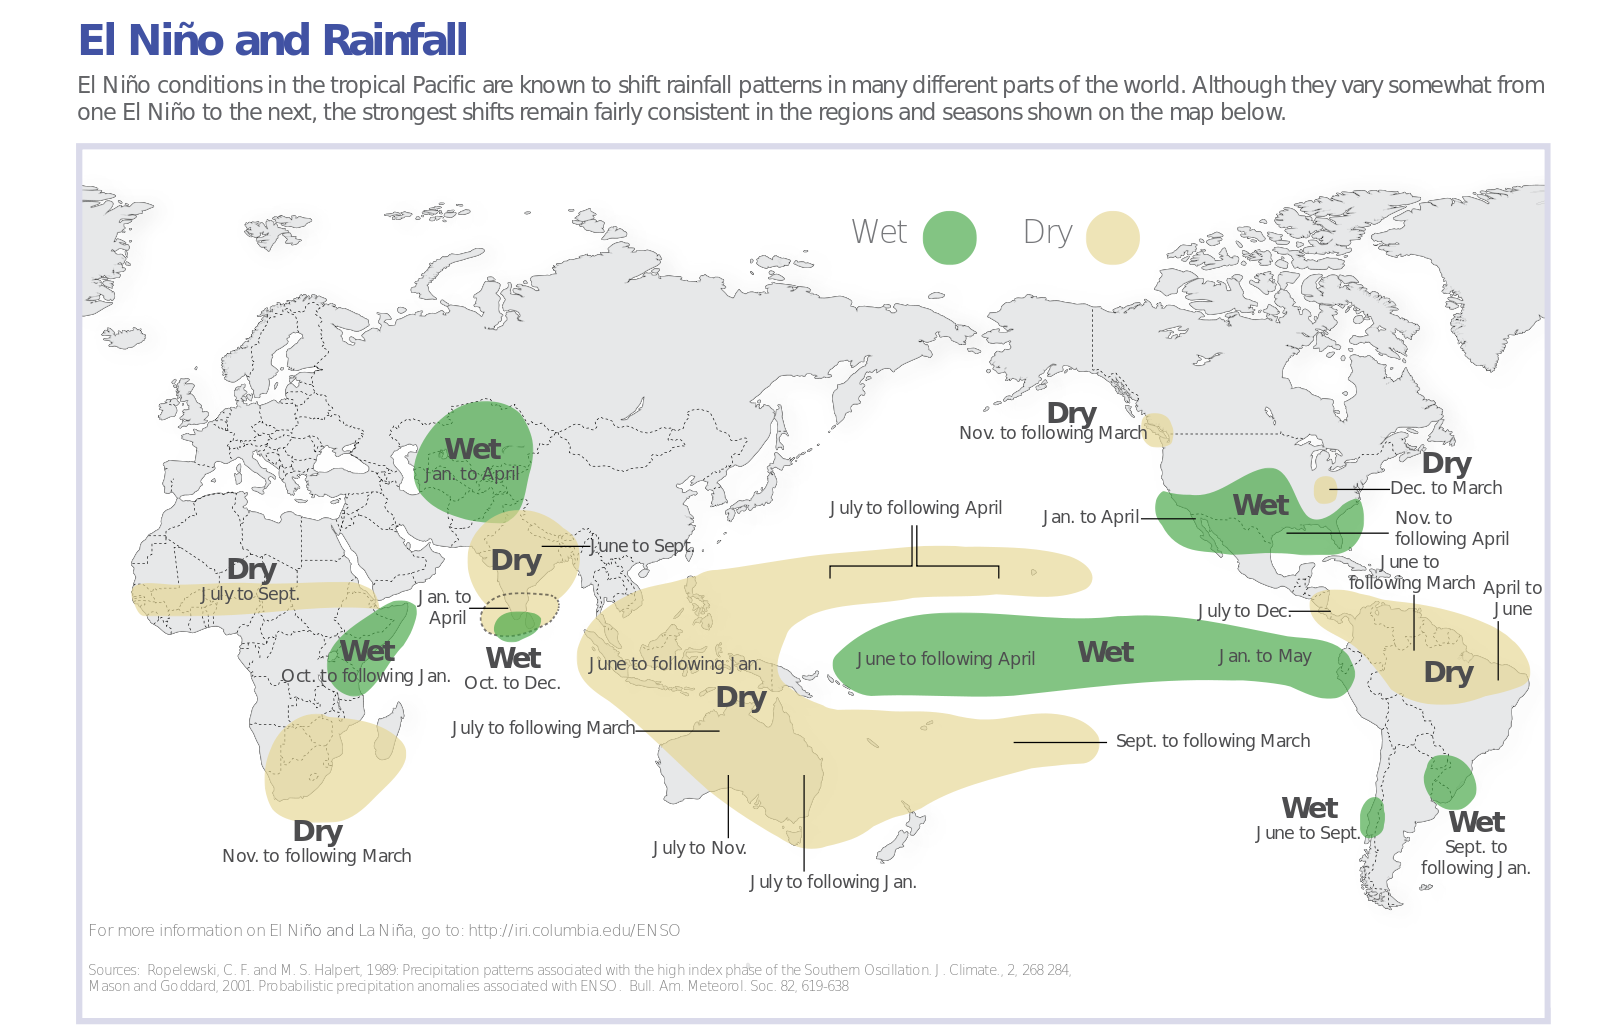
Here are some of the impacts from an El Nino event, both at the source and also
due to the teleconnections of the event. The southern tier of the U.S. is
generally a winner from an El Nino (should they need the moisture), while
places like Australia are severely impacted.
Now of course this brings us to the inevitable comparisons of past strong El
Ninos and what they can bring for Oklahoma. ENSO conditions are classified
by CPC using what's called the Oceanic Nino Indeed (ONI), as explained and by
the folks at Golden Gate Weather Services ( http://www.ggweather.com ).
"The Oceanic Ni?o Index (ONI) has become the de-facto standard that
NOAA uses for identifying El Ni?o (warm) and La Ni?a (cool) events
in the tropical Pacific. It is the running 3-month mean SST anomaly
for the Ni?o 3.4 region (i.e., 5 degrees N-5 degrees S, 120 degrees-170
degrees W). Events are defined as 5 consecutive overlapping 3-month
periods at or above the +0.5C anomaly for warm (El Ni?o) events and at
or below the -0.5C anomaly for cold (La Ni?a) events. The threshold
is further broken down into Weak (with a 0.5 to 0.9 SST anomaly),
Moderate (1.0 to 1.4), Strong (1.5 to 1.9) and Very Strong (≥ 2.0)
events."
Now after reading all of that, perhaps this graph will put things into proper
perspective.
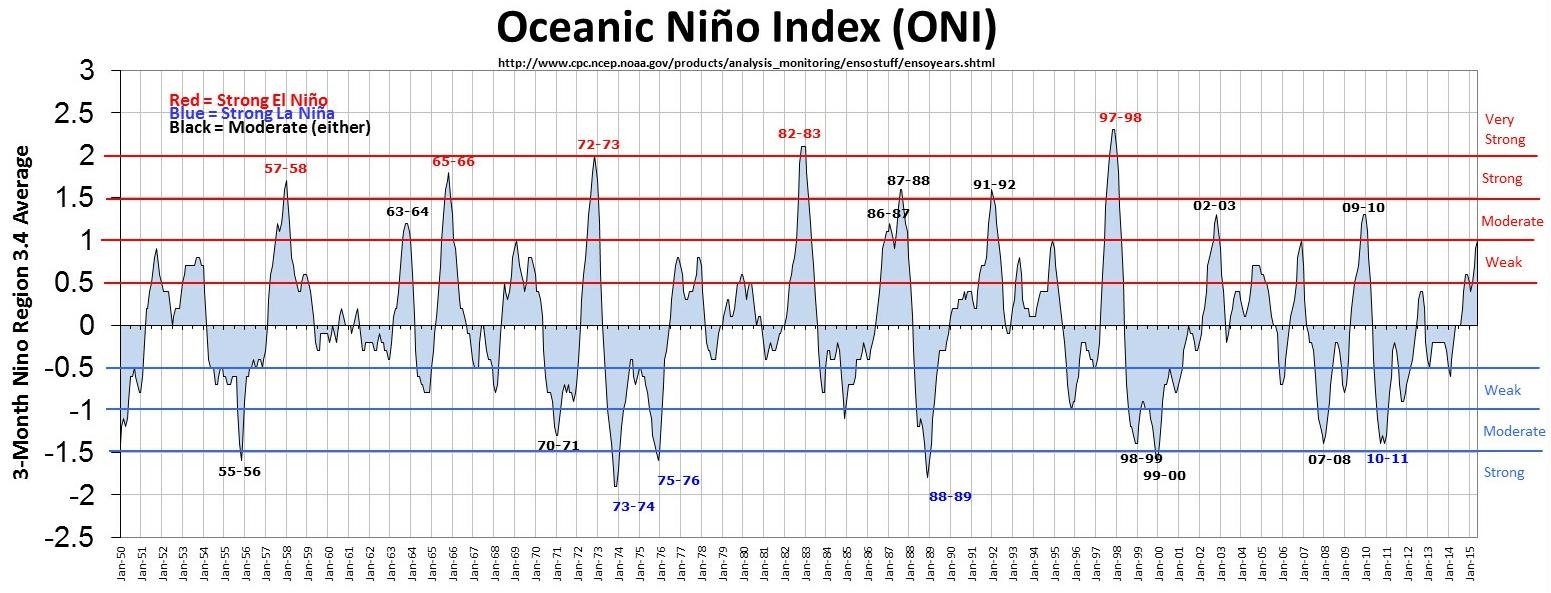
I think the two that most folks are pointing towards due to their comparable
strength (should the "GODZILLA" forecast verify) would be the 1982-83 and 1997-
98 "very strong" events. For our purposes, let's look at the October-March
precipitation stats for each of those events, and we'll even through the merely
"strong" events in there as well.
This table shows the rainfall totals averaged over each OK climate division,
as well as the statewide average, for each of the five strong events. The
departures are versus the 20th century average. Again, the 1982-83 and 1997-98
are the two "very strong" events. Green shows above normal departures, red
show below normal departures.
*Note: these statistics, and even events, are different from previous versions
we have shown since the SST values have been improved upon in the last decade,
giving different magnitudes of ENSO events (in this case, El Nino).

The first thing that jumps out is that the 1965-66 event was not a good one for
Oklahoma, and the 1957-58 event was nothing special either. However, we already
know from previous posts that 1957 was the rainiest year on record for the
state as a whole due to an incredibly wet first half of the year, much like
2015. But, in general, the rule holds true...the odds are definitely tilted to
the wetter side in Oklahoma for strong events.
But let's look at the two Godzillas (CRAP! Now I'm doing it!), 1982-83 and 1997-
98.
--------------------------------------------------------------------------------------
1982-83
Not bad...an inch or two above normal in general across the state. Now some
have reckoned that since El Nino tilts the odds to cooler than
normal and wetter than normal for the southern tier of the U.S., then that means
more snow. That's where it gets fuzzy. Check out the snowfall map for that snow
season, we'll go from Oct. 1-April 30th.
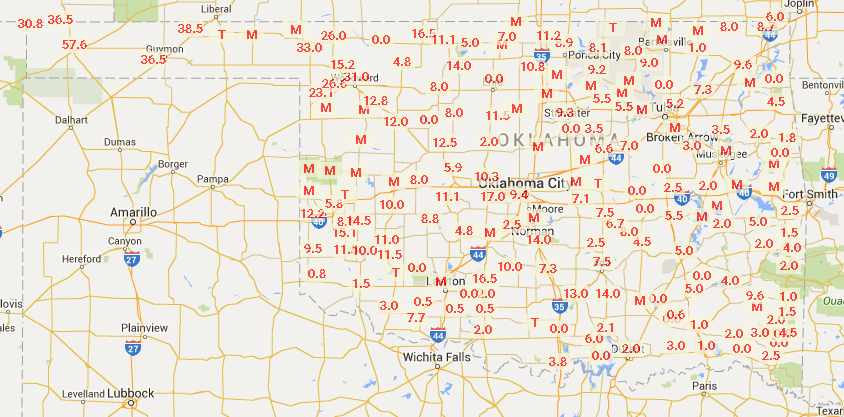
A bit snowy, I guess, especially in the Panhandle and NW. Boise City had a whopping
56.6 inches, and the stations in the NW generally had from 2-3 feet. Union
City came in with 17 inches, but OKC and Tulsa only came in with 9.4 inches and
5.2 inches, respectively. That's about an inch above average for OKC and around
4 inches below for Tulsa. But it's important to not focus on specific locations
and look at the overall pattern. There were decent snows in some areas, while
some places needn't bother with the sled. In other words, a fairly typical
winter for OK, save for the NW corner. That 6-month statewide avg. temperature
was normal at 46 degrees. The winter (December 1982-February 1983) was actually
about a degree above normal.
---------------------------------------------------------------------------------------
1997-98:
A really wet event this time around, and luckily we have the Mesonet to generate
some really nice rainfall maps.
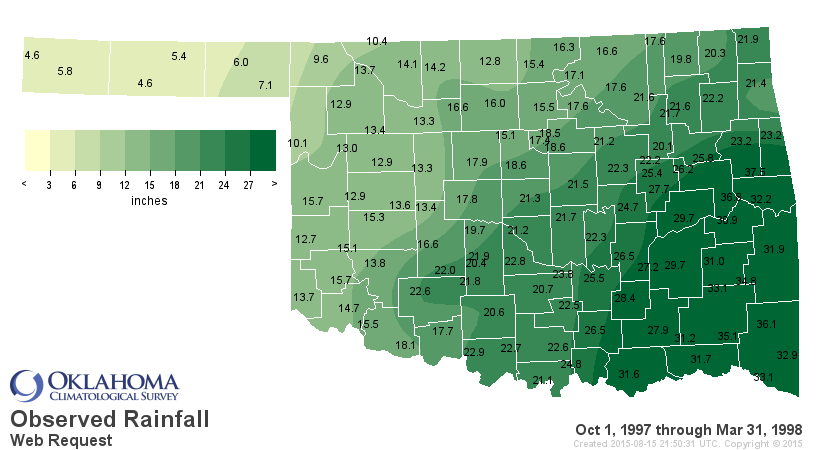
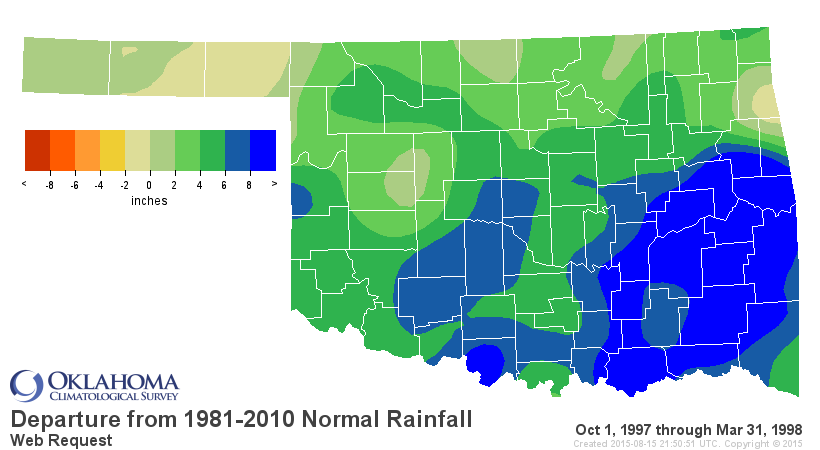
Officially the 3rd wettest Oct-March for Oklahoma dating back to 1895, this
El Nino obviously impacted the state in a significant way. That's not surprising
considering it's the El Nino that all El Ninos are measured against now. That
period was also cooler than normal, about 1.8 degrees below normal, to be
approximate. The winter months, however, were just a bit above normal. So
how did we come out with respect to snow? Well, much like the 1982-83 event, the
Panhandle and NW OK were impacted the most, while the rest of the state...no
so much.
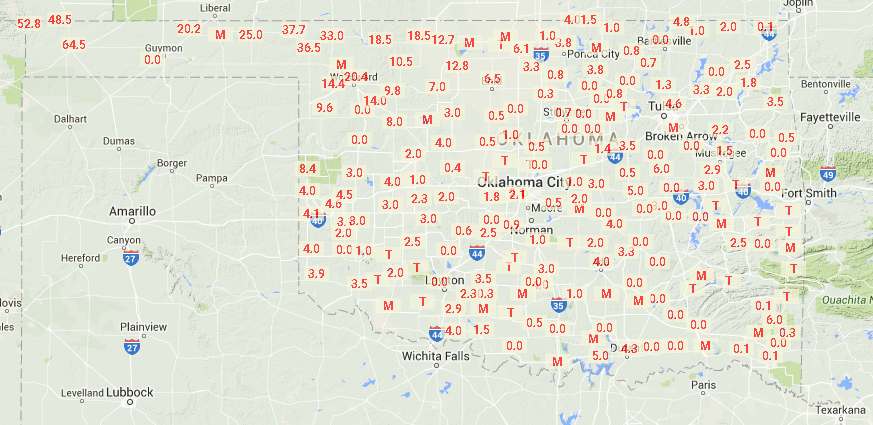
Boise City was again the big winner with a whopping 65 inches of snow (their
normal total is 32.5 inches), but places like Gate, Laverne and (AHEM!) Buffalo
had around 3 feet or so as well. Again, OKC and Tulsa had rather unremarkable totals
of 2.1 inches and 4.6 inches.
--------------------------------------------------------------------------------------
So what do we take away from all that mess? Heck if I know! But, I'll give it a shot
anyway.
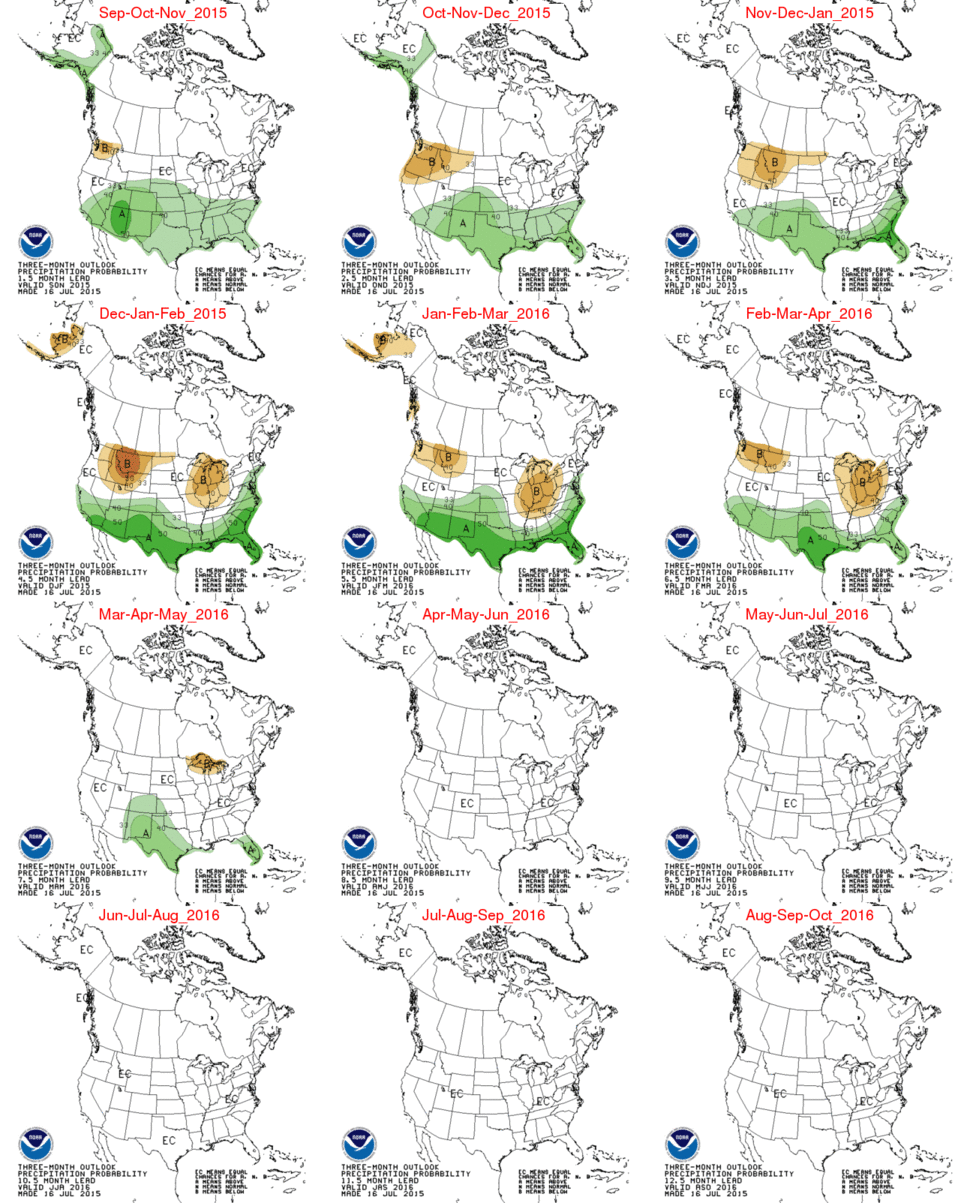
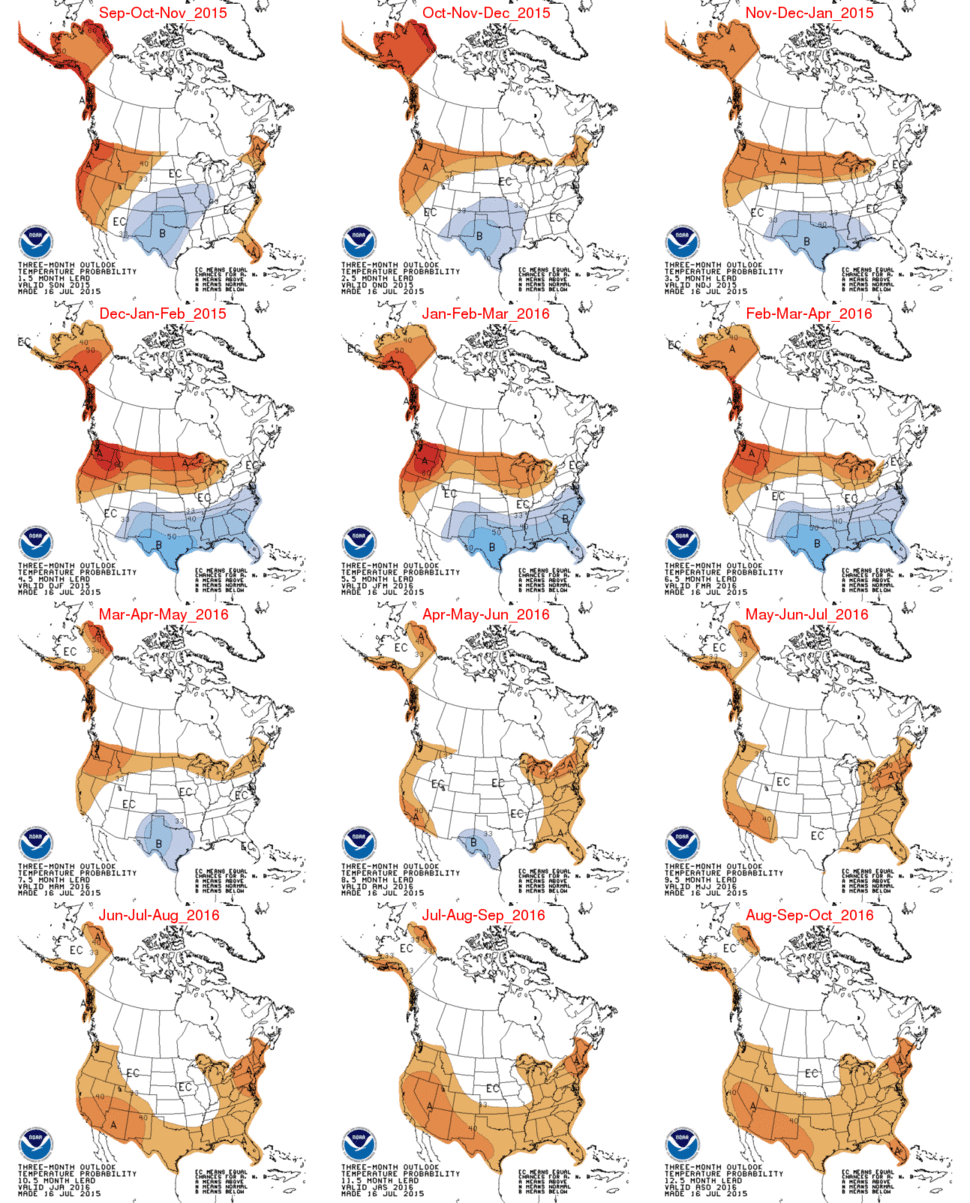
1. Strong El Nino events do tend to tilt the odds to a wetter than normal cool season
into Oklahoma, which can last into spring. And we're seeing that reflected on the CPC
seasonal outlook maps. CPC goes with the standard cooler than normal impact as well.
But, it's not a guarantee. If you were betting money, you could still lose.
2. We can see some big snows, apparently more pronounced across NW OK and the Panhandle.
But otherwise, it seems to be left up to the vagaries of Mother Nature. And let's
remember that we had hefty snowfall seasons during both the moderate El Nino of 2009-
10 and the strong La Nina of 2010-11. Tulsa's all-time seasonal snowfall record of
26.1 struck during 2010-11, but they also had 22.8 inches during the moderate El Nino
during 2009-10. OKC had 19.6 inches of snow for the 2010-11 season but beat that the
season before with 23.2 inches during 2009-10 (Christmas Eve Blizzard of 2009, anyone?).
So there might be something else at play in that regards. Recent research has pointed
towards things as the blocking pattern in the North Atlantic, possibly tied to arctic
ice loss and early season Siberian snow pack amounts. That research is still in its
infancy, however, so we'll have to wait and see where that leads us in future years.
3. It still does appear possible to top that record wet year of 1957 across the state.
To run through the stats again, they ended up with a total of 47.88 inches. Through
yesterday, the statewide year-to-date average according to the OK Mesonet was 35.72
inches. January-August of 1957 had a total of 35.87 inches, but we do have a good
little rain system coming through early this week that can keep us on pace with 1957.
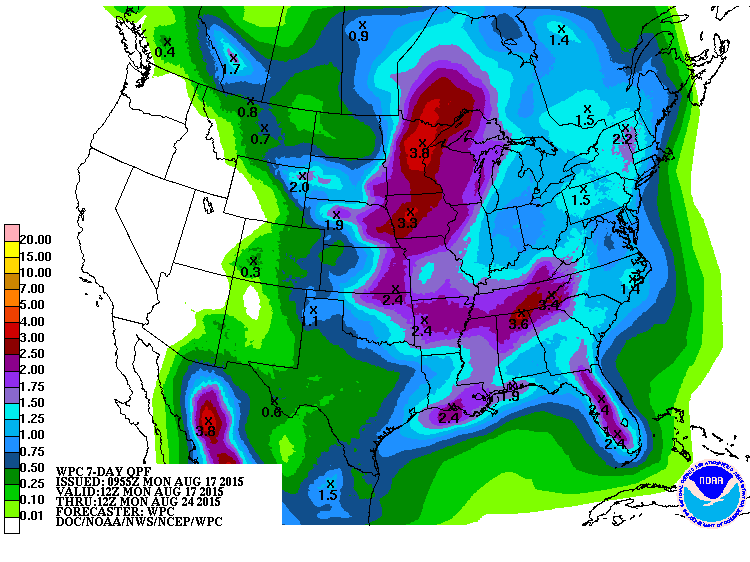
The state only needs to average a bit over 12 inches of rain through the end of the
year to top 1957. Normal for that time frame is actually 13.53 inches. With the odds
stacked in our favor thanks to Godzilla, that should be a snap, right?
4. Unknowns. At best, ENSO (El Nino or La Nina) can explain about a third of our
naturally varying climate, or so I've read a time or two. That leaves a lot of
variability on the table, and a lot of uncertainty. What about that big blob of
warm water off the West Coast that seems to have exacerbated the so-called "death ridge"
of high pressure for that area, bringing them tremendous drought and heat? Who wins
when Godzilla meets the Blob? If we set up with the same pattern over the last few
winters, big ridge in the west and trough in the east, which side of that battle line
will we be on? Will the jet stream be dragged too far south for Oklahoma to feel an
impact, with Texas making off with all the moisture?
5. Finally, just remember that weather extremes of any sort can happen during a more
broad-based climate event. For example, the blizzards of 2009-11 during both an El Nino
and La Nina, the state's record cold reading of -31 degrees from Nowata Mesonet on
Feb. 10, 2011, or the February record 6 tornadoes of 2009.
Remember, prepare for climate by putting the right clothes in your closet ... prepare
for the weather by what you put on each day. Sounds kind of hokey, but there's a bit
of sense there.
Here are some resources for you to bookmark and look through if you should desire.
CPC ENSO blog: https://www.climate.gov/news-features/department/8443/all
CPC ENSO page: http://www.cpc.ncep.noaa.gov/products/analysis_monitoring/enso_advisory/index.shtml
NWS SR HQ ENSO page: http://www.srh.noaa.gov/jetstream/tropics/enso.htm
And always remember...if things get too bad, you know who to call. No, not the
Ghostbusters.
MOTHRA!

Gary McManus
State Climatologist
Oklahoma Mesonet
Oklahoma Climatological Survey
(405) 325-2253
gmcmanus@mesonet.org
August 17 in Mesonet History
| Record | Value | Station | Year |
|---|---|---|---|
| Maximum Temperature | 114°F | GRA2 | 2023 |
| Minimum Temperature | 53°F | ANTL | 1999 |
| Maximum Rainfall | 5.78″ | MEDF | 2009 |
Mesonet records begin in 1994.
Search by Date
If you're a bit off, don't worry, because just like horseshoes, “almost” counts on the Ticker website!