Ticker for August 25, 2014
MESONET TICKER ... MESONET TICKER ... MESONET TICKER ... MESONET TICKER ...
August 25, 2014 August 25, 2014 August 25, 2014 August 25, 2014
Not-So-Cool Hand August
Some months you just can't reach. So you get what we had here the last two weeks,
which is the way August wants it... well, it gets it.
Now I'm far from Paul Newman, and I definitely can't eat 50 eggs (but I did
once eat a whole big bag of M&Ms at the movies), but I can definitely tell when
a month has quit shaking the bush (you REALLY need to watch "Cool Hand Luke" to
get this Ticker). Remember the first 10 days of the month or so when August
resembled the rest of the summer before it...wet and mild (downright cool at
times)? Yeah, well, that was a nice memory, and that's all it is now.
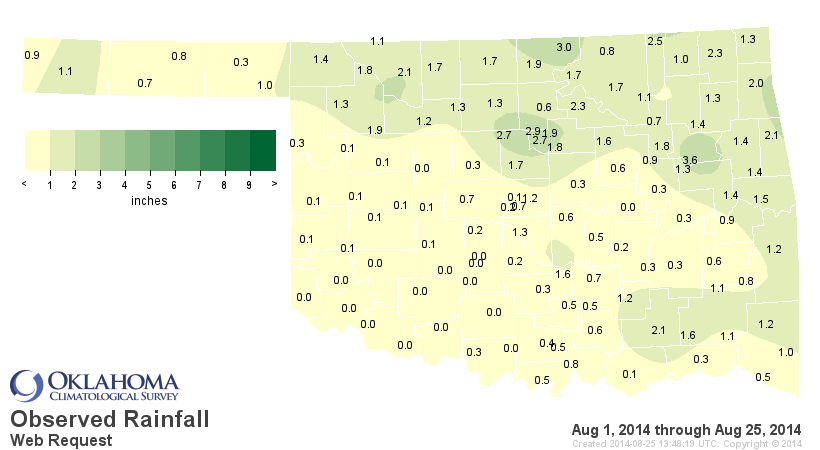
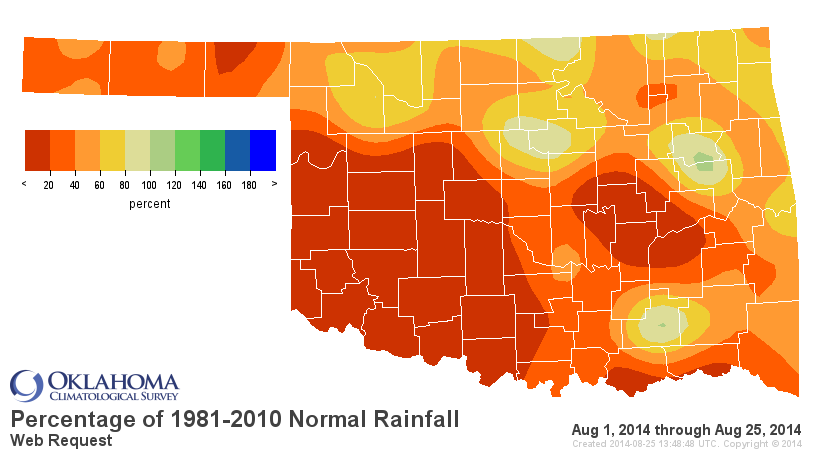
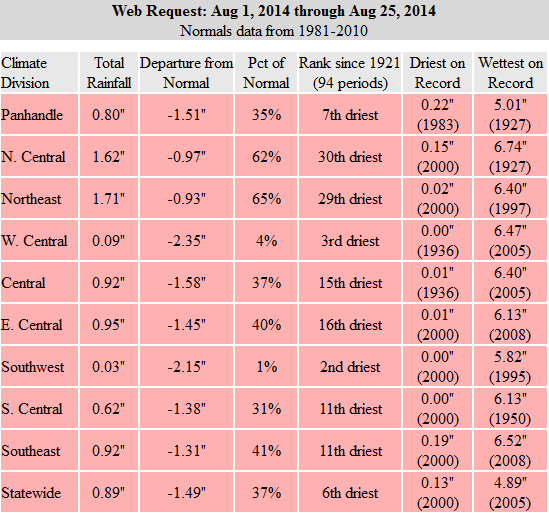
First off, the rain has really been a disappointment after what we saw from
late-May through July. I showed these maps last week, and they haven't really
changed much. The August thus far is now the 6th driest since at least 1921
with a statewide average of 0.89", 1.5" below normal. For SW OK, they've only
seen 0.03" of rain for the month, the 2nd driest such period since at least
1921! That will barely wet your gauge, and when you have your 2nd wettest August
on record, well...that's saying something.
The temperatures have really tried to acclimate for a hot summer against our
will over the last couple of weeks as well. Again, remember through that first
week of August, our number of 100 degree days was really a shade of its former
self compared to a normal Oklahoma summer. Here are the number of 100 degree
days for the Mesonet through August 5th.
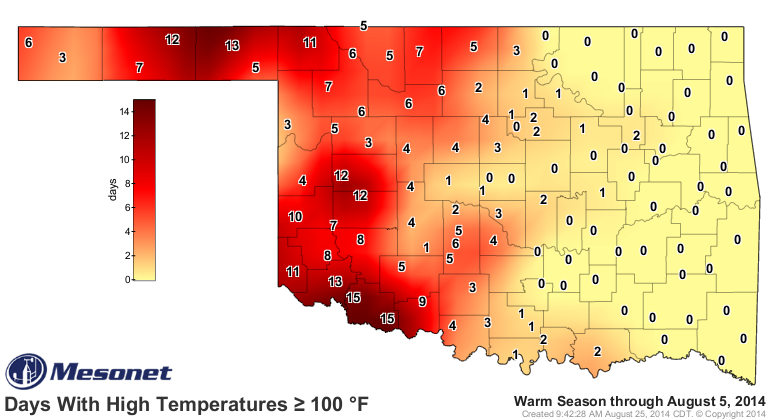
15 days was the highest total from both Tipton and Grandfield down there in
D4 Drought Central Station (i.e., Tillman County). 15! Somebody that moved in
from out of state must have thought all those tales of hot Oklahoma summers
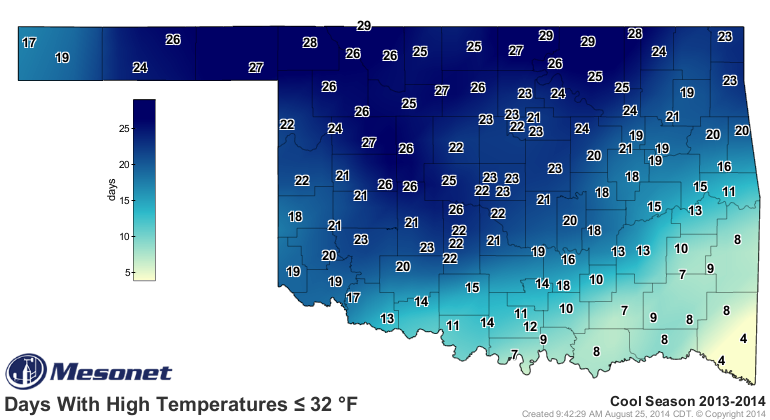
were a bit exaggerated. In fact, as one astute Ticker reader observed, we had
seen more days with highs below 32 degrees during 2014 than we had with highs
above 100 degrees!
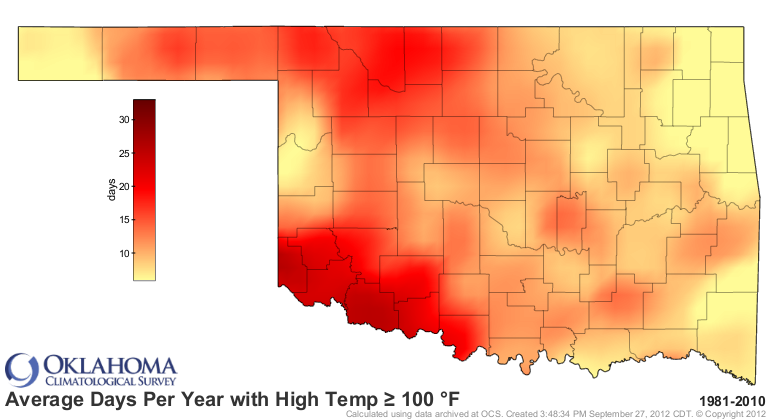
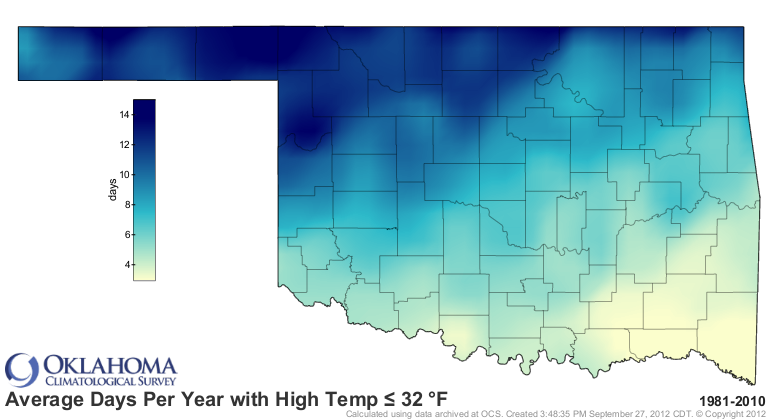
Here are the annual normal maps for both of those, by the way, so you can
compare. Keep in mind these are for the calendar year, so both have a chance
to add numbers ... the 100s map in the next month, the below 32 degrees map as
we get into November-December.
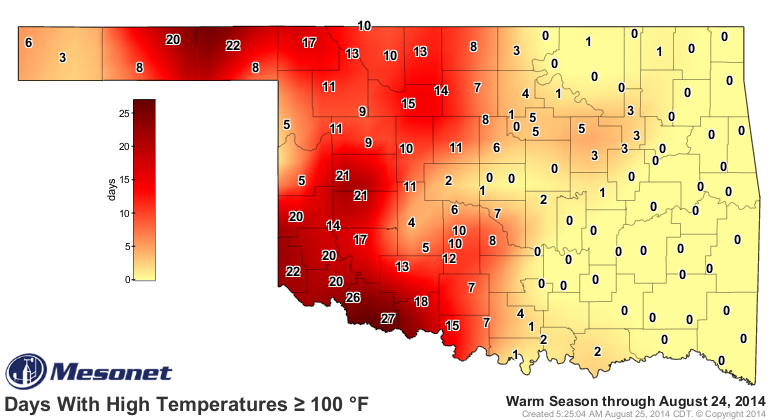
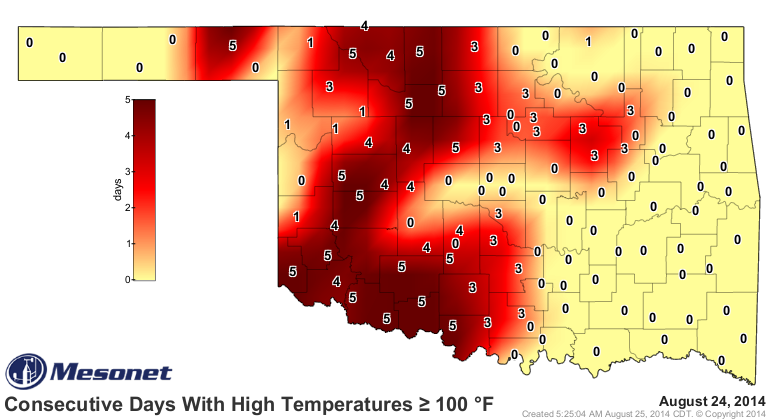
Anyway, here's what that 100s map now looks like. As you can see, the number
of days across the Mesonet have gone up considerably across western Oklahoma.
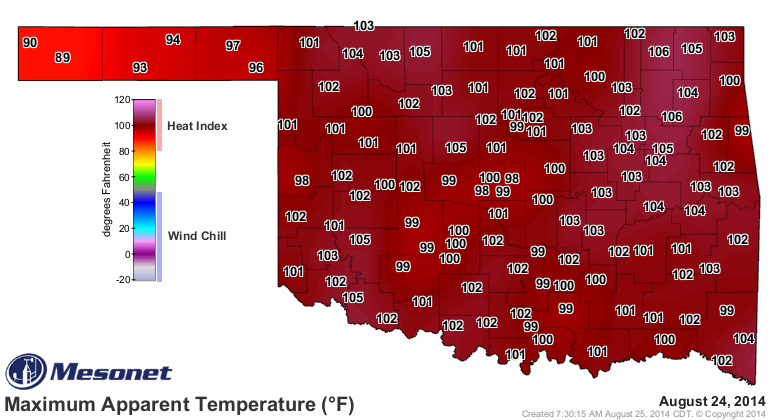
Eastern Oklahoma actual air temperatures are still being modulated somewhat
by the moisture they've received, but that just means more fuel for higher
heat indices.
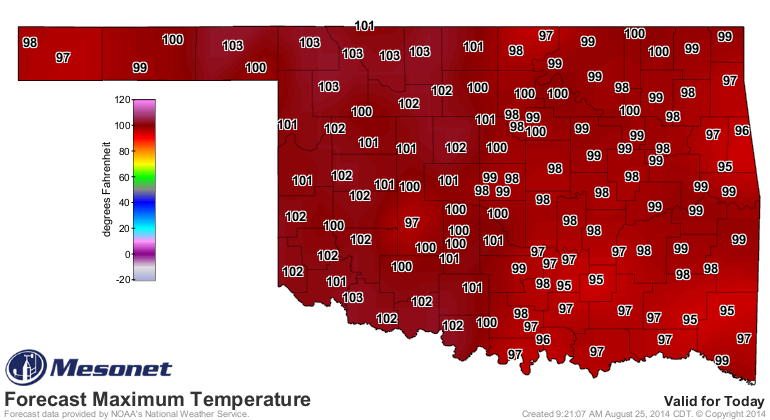
Okay, now for the bad news first...the 100s map is going to grow for the next
couple of days, I'm afraid.
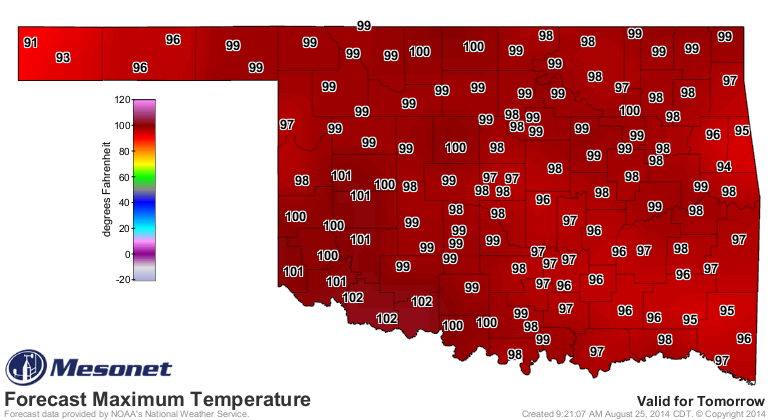
The good news...a nice cool front will then bring us some cooler weather later
in the week, along with a chance of rain, finally!

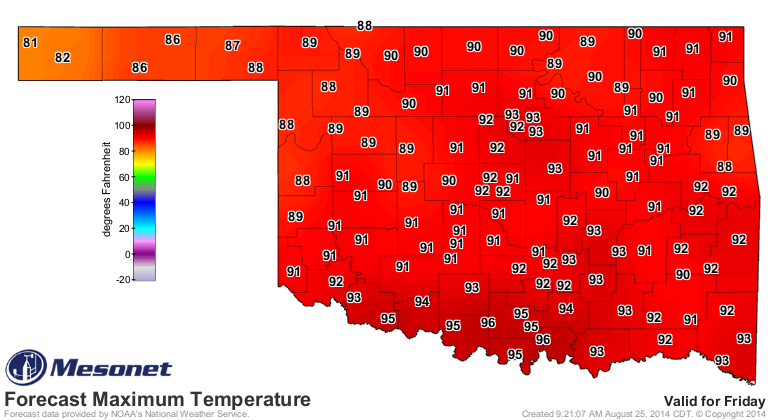
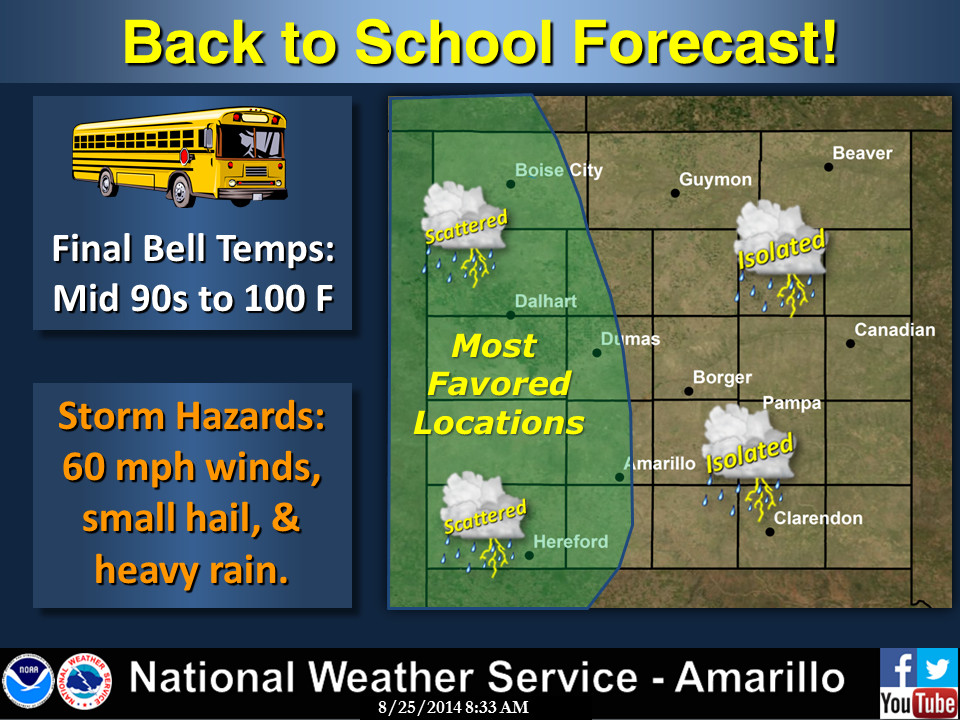

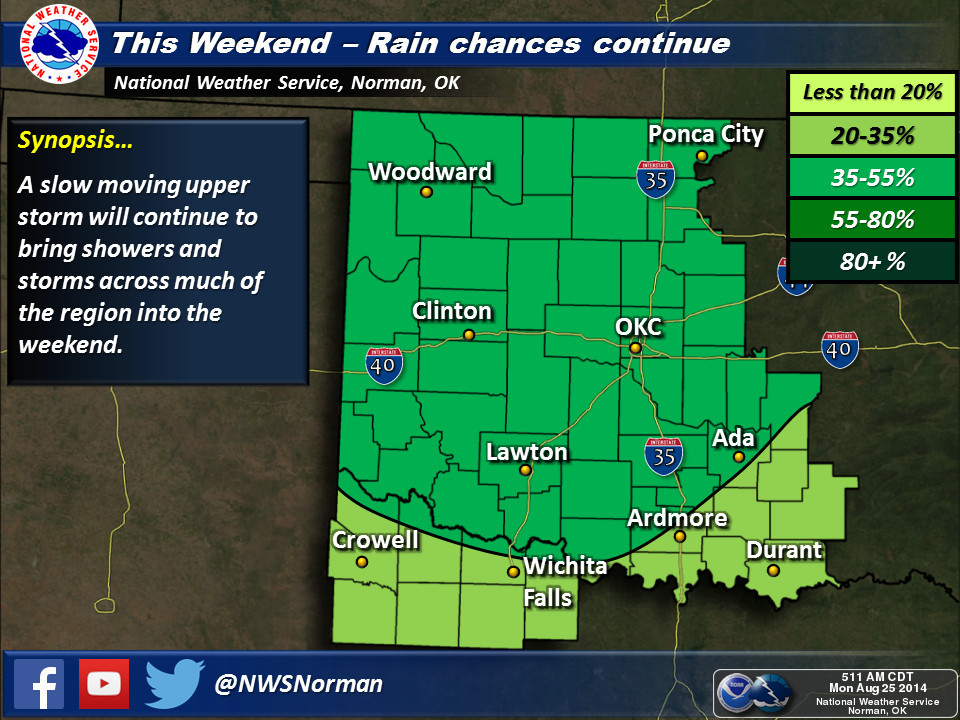
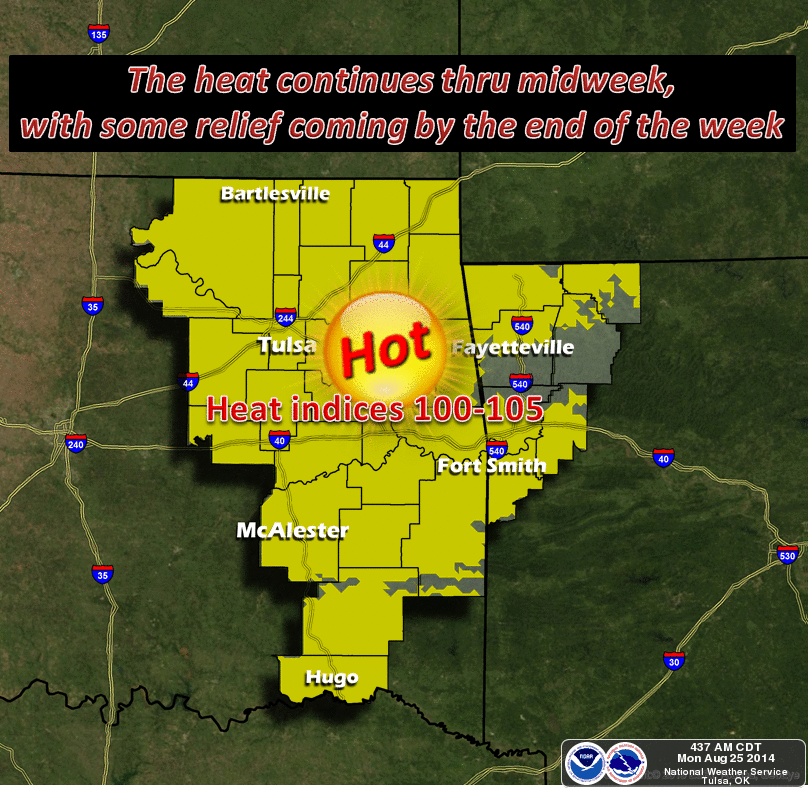
Amounts aren't major at this time, but significant for this August nonetheless.

The goal is to stop this streak this week.
Maybe Wednesday...maybe Thursday. An early look at next week says another
streak might start up again, so enjoy this weekend. Football's starting, which
means fall is right around the corner.
About those 50 eggs? I'm ready to try!

Gary McManus
State Climatologist
Oklahoma Mesonet
Oklahoma Climatological Survey
(405) 325-2253
gmcmanus@mesonet.org
August 25 in Mesonet History
| Record | Value | Station | Year |
|---|---|---|---|
| Maximum Temperature | 109°F | FREE | 2024 |
| Minimum Temperature | 46°F | BEAV | 2010 |
| Maximum Rainfall | 4.69″ | MEDI | 2017 |
Mesonet records begin in 1994.
Search by Date
If you're a bit off, don't worry, because just like horseshoes, “almost” counts on the Ticker website!