Ticker for August 14, 2014
MESONET TICKER ... MESONET TICKER ... MESONET TICKER ... MESONET TICKER ...
August 14, 2014 August 14, 2014 August 14, 2014 August 14, 2014
Ring of Fire
The release of the latest U.S. Drought Monitor report could not work its magic
this Thursday and cause it to rain somewhere in the state. Unfortunately, the
Mesonet rain maps are looking mighty bare lately.
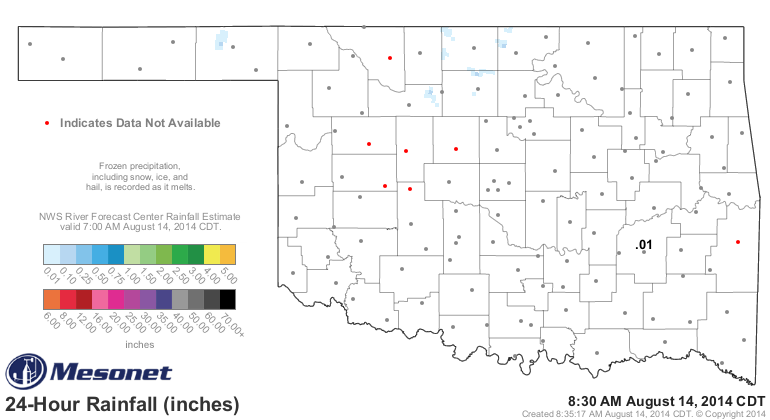
(thank you, McAlester, for screwing up my point, and you too, blue spot west of
Beaver!)
However, that doesn't mean that this week's DM map was without moisture to work
with, because it did rain here and there last week and over the weekend. We'll
just go back 10 days to check it out.

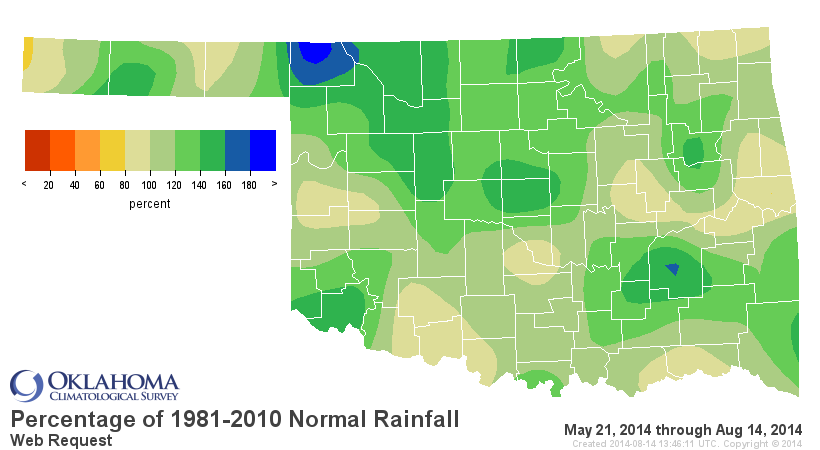
So there WAS some nice rains to add to the longer-term totals we've seen since...
yes, May 21. And thus, we have the newest DM map with some nice changes, and
unfortunately some bad changes.

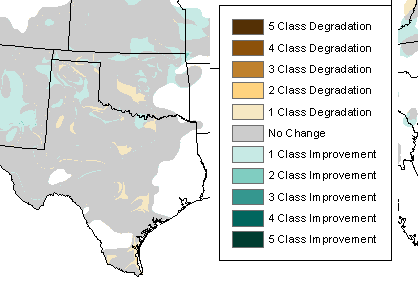
We had some spread of the Abnormally Dry (D0) area in central Oklahoma, some
Severe Drought (D2) drop to Moderate Drought (D1) in the northwest and then
the same thing up in the northeast. But we also had some intensification just
southwest of OKC from Custer County down to Garvin County. You can see those
changes a bit better on this map, showing the changes from last week's map.
The intensification is due to a long-term gradient between those two areas, and
it is punctuated by the rainfall amounts in the four Oklahoma County Mesonet
sites compared to the Norman site on the 90-day totals map.
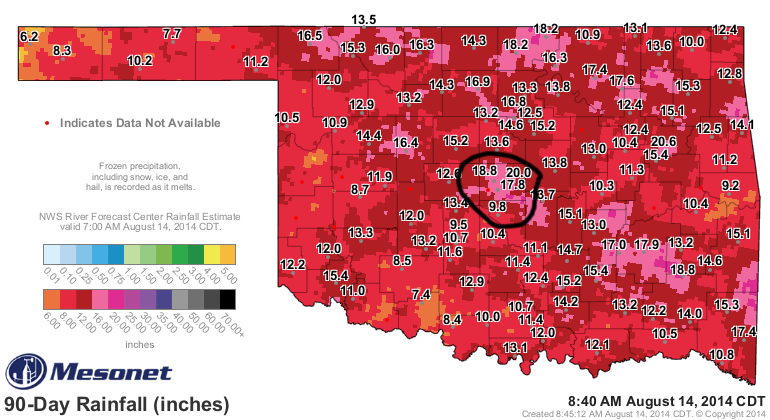
It's what has become known amongst weather circles here at the National Weather
Center as the "Norman Bubble," some mysterious force that causes Norman to get
9.8 inches of rain over the last 90 days while Oklahoma City receives from
18-20 inches. Now as you can look at that map, you can actually see many
"bubbles." Surely Walters down in Cotton County is crying crocodile tears for
Norman with only 7.4 inches over the same period. Here is the complete set of
maps for that May 21-August 14 period, complete with stats.
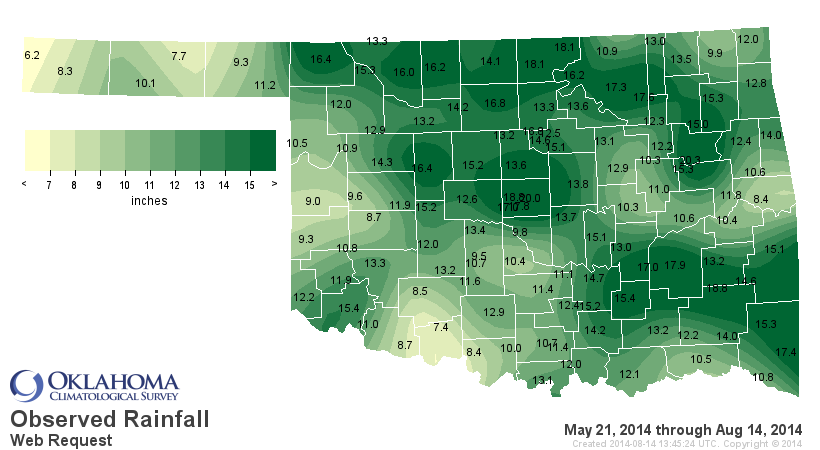

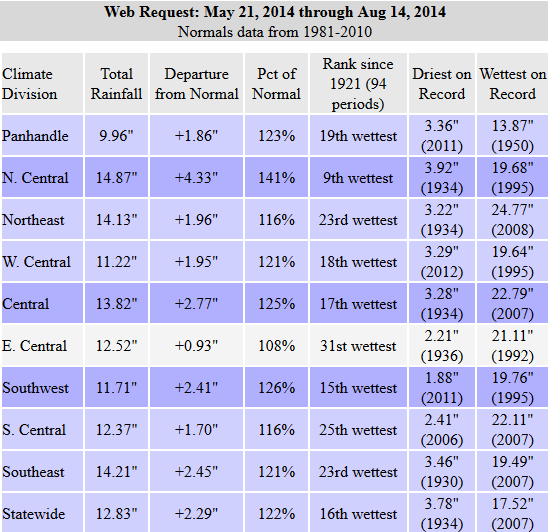
Those statistics are wonderful, but especially in the N. Central (9th wettest),
Central (17th wettest) and Southwestern (15th wettest) climate divisions. And
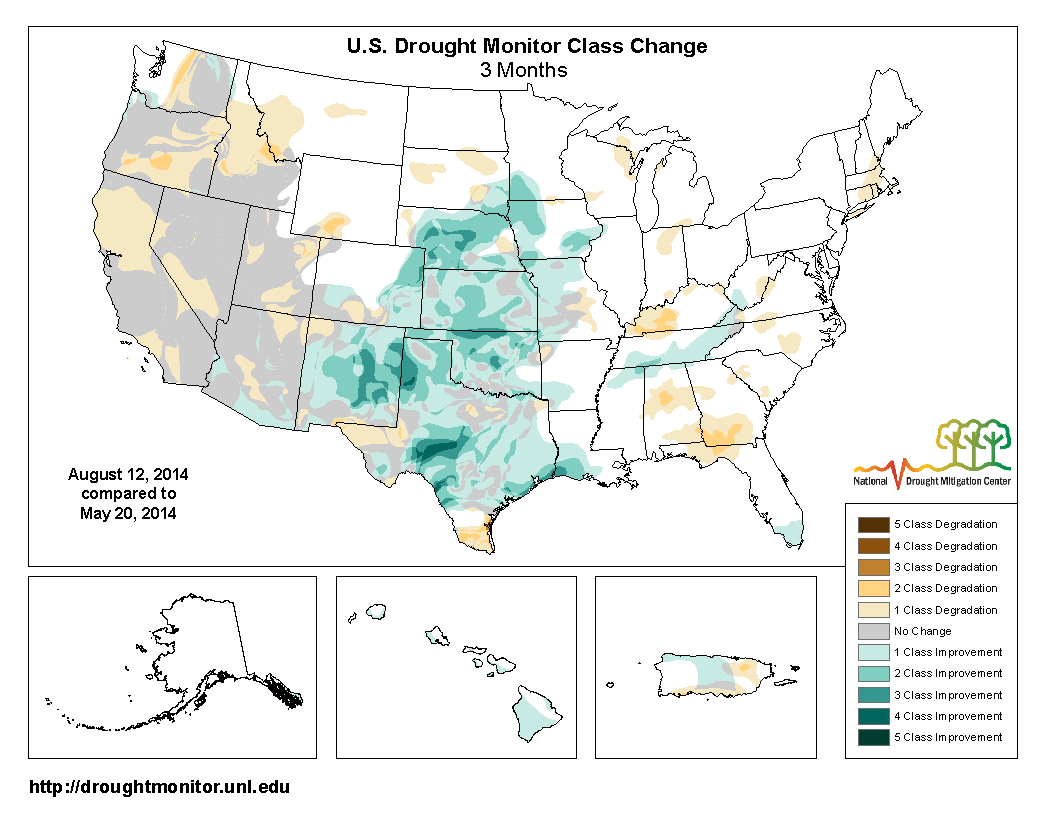
those wonderful surpluses show up on the 3-month U.S. Drought Monitor change
map as well. I'll show you the whole country this time and you can see that it
is really the entire Southern and Central Plains that have been de-droughtified
this late-spring and summer.
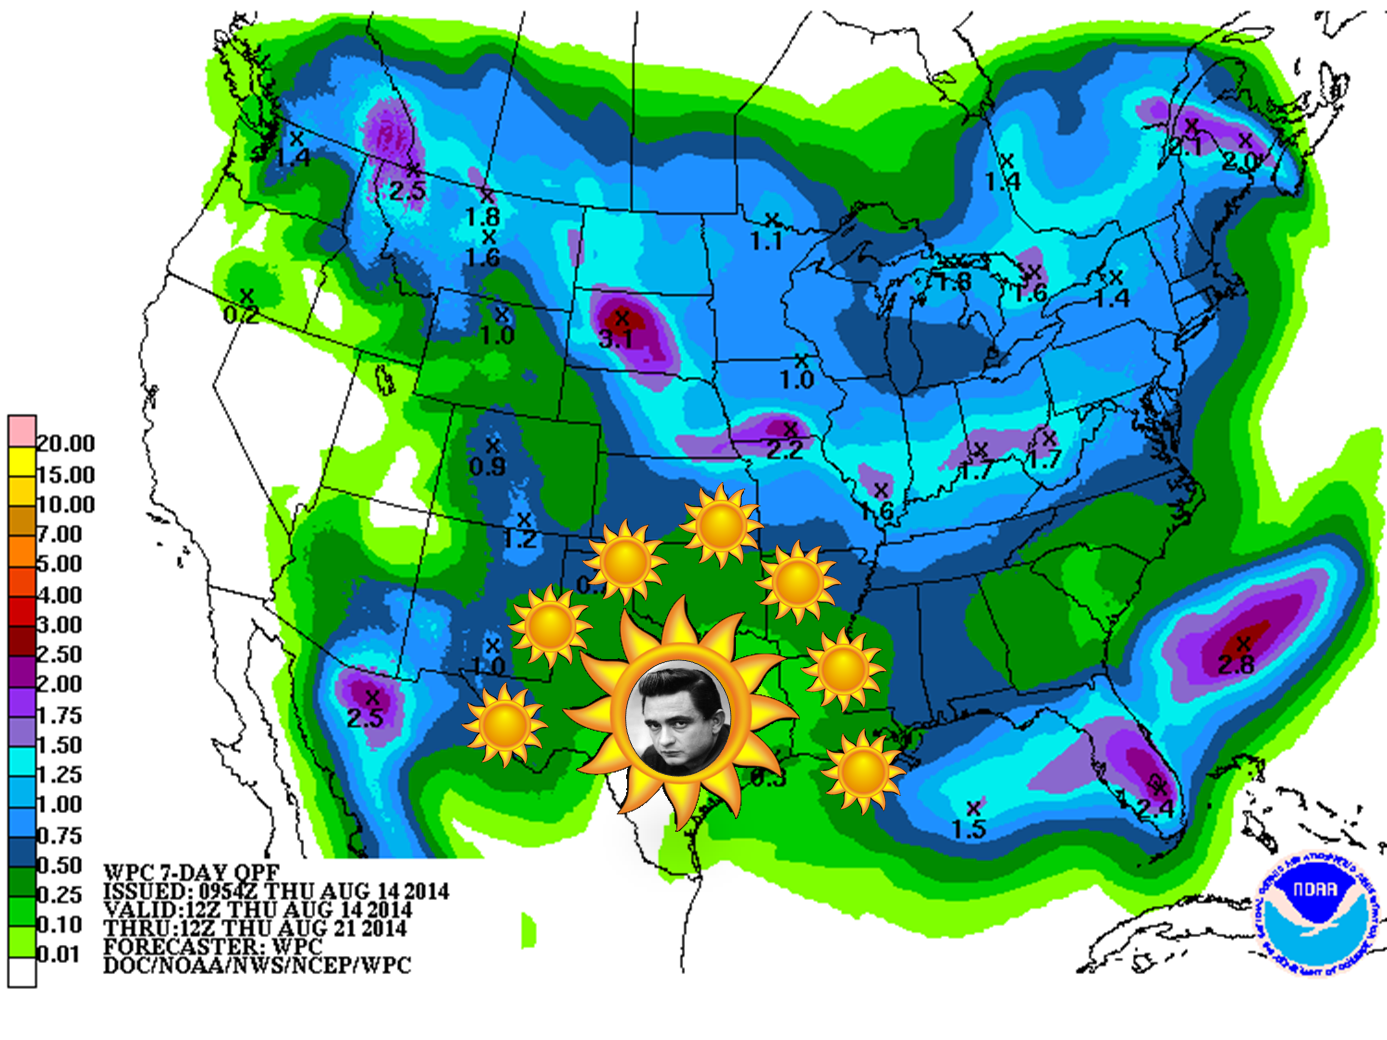
It looks like that might be the last of the changes for awhile, or the
improvements at least. We're still under the influence of that ridge of high
pressure that is really plunging us back into a summer spell that we're just
not used to this year. You can see it as a ring of fire on the 7-day rainfall
map as that weaknesses along the edges of that ridge allow for storms and
precip while we're left baking under the sun.
"Hello, I'm the Johnny Cash Rainfall Map"
So it's a return to summer, and it might be here for a bit.
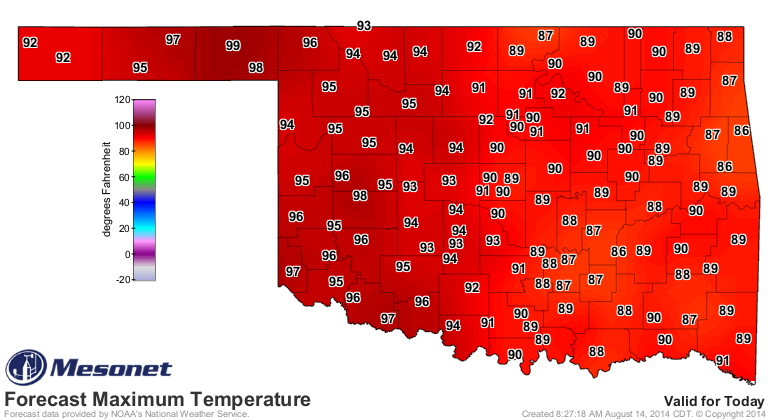
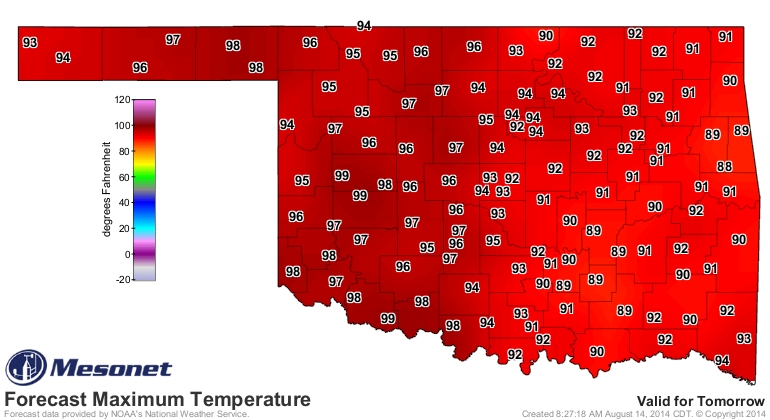
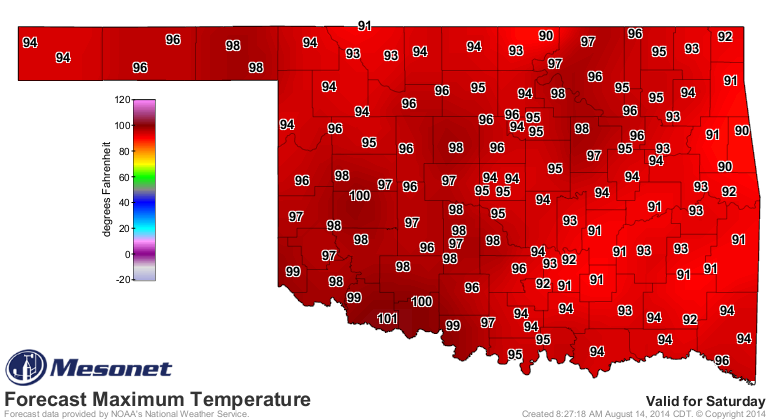
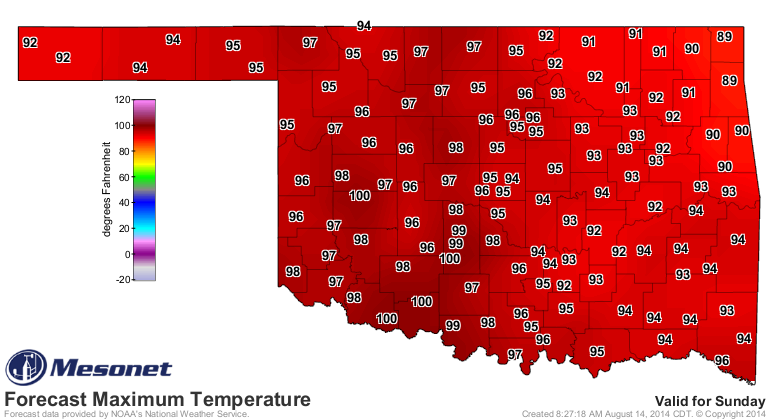
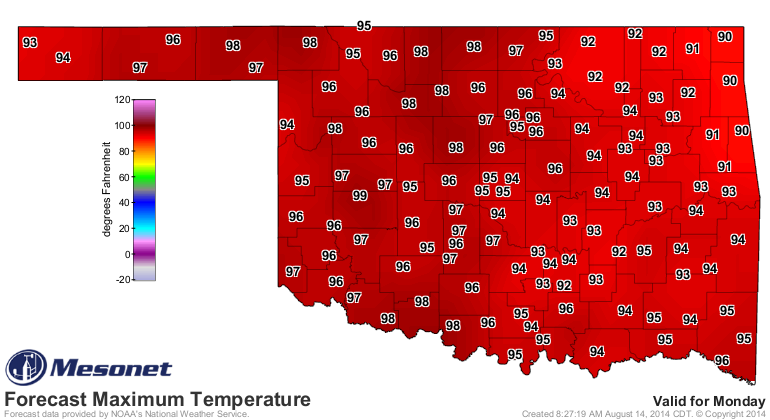

That's okay, we've been spoiled this summer so far. We can handle a return to
our normal August heat. Most of the state has had a nice cushion of moisture
that has kept drought intensification at bay and even diminished it in some
of the hardest hit areas.
Don't worry, those September cold fronts are just a few weeks away.
I've never been to Reno, by the way, so don't try to "pen" those lyrics on me.
Gary McManus
State Climatologist
OCS/Mesonet
(405) 325-2253
gmcmanus@mesonet.org
August 14 in Mesonet History
| Record | Value | Station | Year |
|---|---|---|---|
| Maximum Temperature | 107°F | KIN2 | 2010 |
| Minimum Temperature | 50°F | WIST | 2004 |
| Maximum Rainfall | 5.37″ | BOWL | 2005 |
Mesonet records begin in 1994.
Search by Date
If you're a bit off, don't worry, because just like horseshoes, “almost” counts on the Ticker website!