Ticker for June 26, 2014
MESONET TICKER ... MESONET TICKER ... MESONET TICKER ... MESONET TICKER ...
June 26, 2014 June 26, 2014 June 26, 2014 June 26, 2014
Bye bye spring?
Well, the rains didn't really predominate over the last couple of days like
the forecasts seemed to indicate, but that's not a shock in the type of weakly
forced environment we are dealing with in late June. There were rains
nonetheless, albeit very scattered.
Those rains can't be considered for use in this week's U.S. Drought Monitor map,
since they mostly came after the Tuesday 7 a.m. cutoff point. Mostly. Just as
the rains this spring mostly came after May 20th. Mostly.
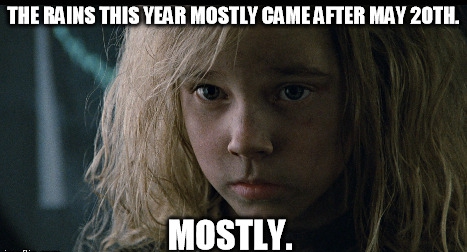
Don't believe Newt? Here are the updated maps for that time period (as well as
the pre-May 21st maps for comparison.
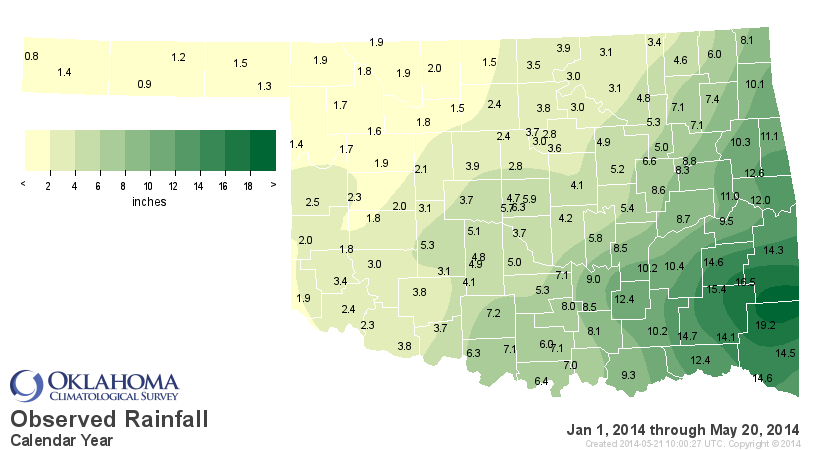
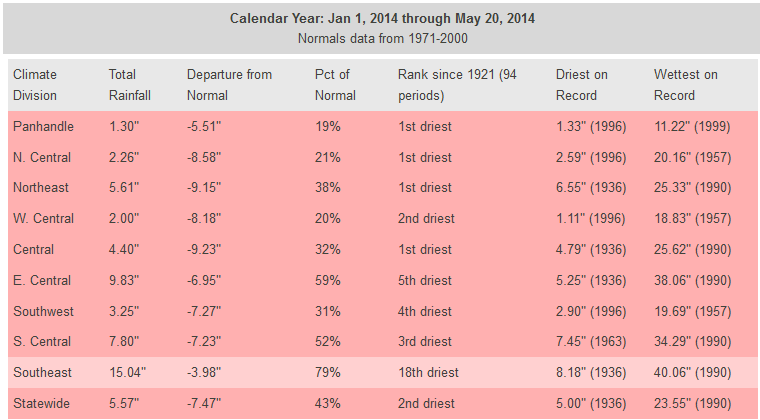
January 1-May 20 Oklahoma Mesonet Rainfall

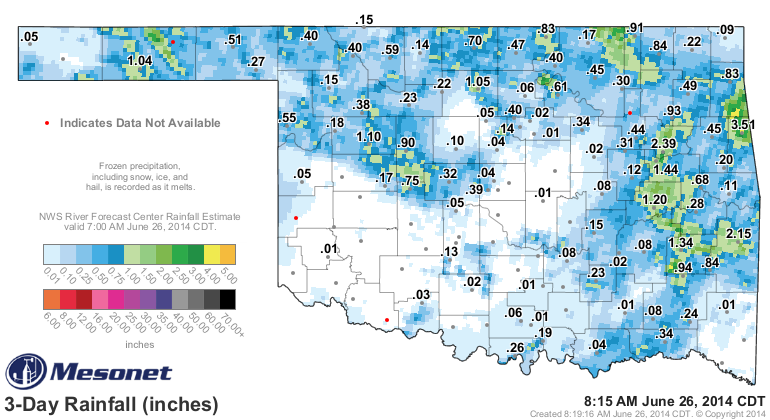
May 21-June 26 Oklahoma Mesonet Rainfall
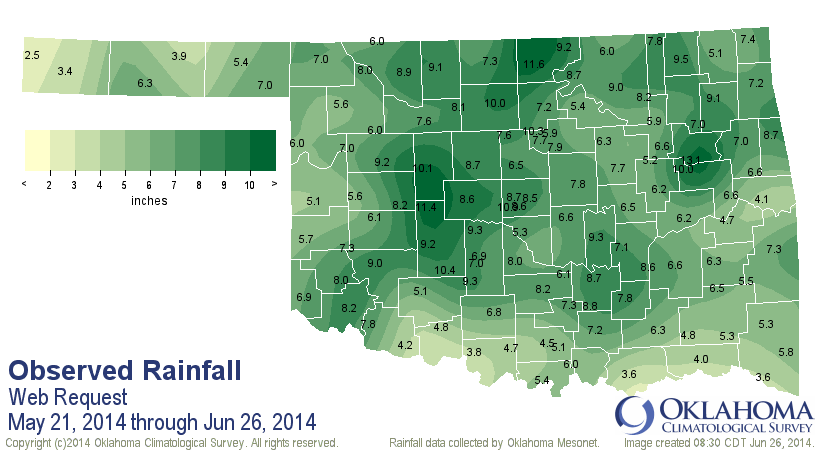
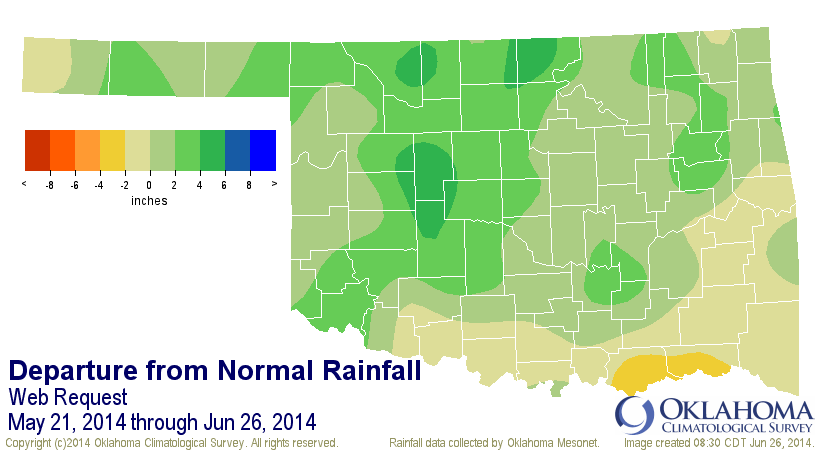


Again, those maps show a great deal of relief across much of western Oklahoma
where up to 200% of normal rainfall occurred right through the normal wettest
part of the year. Now unfortunately for those still trying to cut wheat, it's
really put the damper on harvest, pardon the pun. But we can also see that
there are parts of the state where that rains have not really materialized ...
south central and east central Oklahoma. Some of those areas have only seen
3-4 inches of rainfall (meanwhile, parts of the Panhandle have seen 6-7 inches).
At any rate, the results are good for most with more drought reductions
appearing on the latest U.S. Drought Monitor map, hot off the presses.
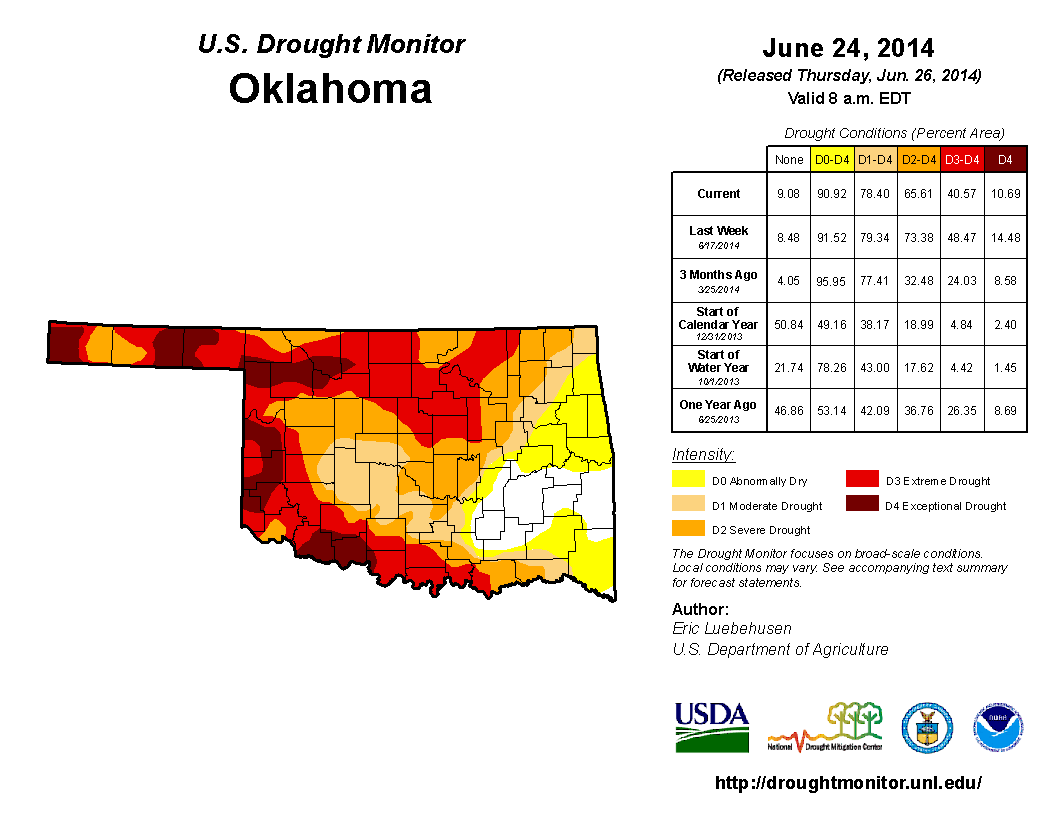
The total amount of drought (D1-D4) fell slightly, but the amount of D2-D4
drought fell from 73.4% to 65.6%. D3-D4 amounts fell from 48.5% to 40.6%.
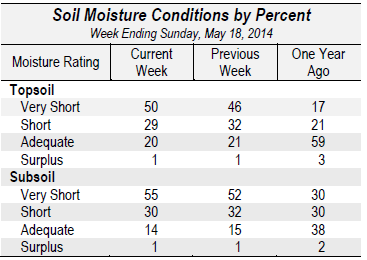
Some the changes in impacts have been obvious. According to the latest USDA
National Agricultural Statistics Service estimates, 56% of the state now has
at least adequate topsoil moisture with 5% showing a surplus -- 39% are still
in the short/very short category. For the subsoil moisture, that's where we're
still showing some of those long-term impacts with 66% of the state in the
short/very short category and 33% in the adequate margin. One percent of the
state is lucky enough to see a surplus in subsoil moisture. That's a dramatic
improvement over the conditions we were seeing before the rains began in late
May. Check out the NASS soil moisture tables from May 19 and June 22 for
comparison.

One of the more important impacts seeing improvement that endanger lives and
property is fire danger. Back in May, we were seeing day after day of extreme
fire danger across much of the state due to a lack of green-up mostly (of course
the dry air, strong winds and occasional bursts of record-breaking heat had
something to do with it as well). Check out these Relative Greenness maps from
the OK-FIRE program and you can see the dramatic improvements over the last
month or so. Just a quick primer, Relative Greenness basically means "how green
was it in the last week compared to how green it is throughout the entire year,"
all based on satellite views. So you average all the browns and yellows of
winter and late summer with the greens and not-so-greens of other parts of the
year and compare a week's worth of data.
REALLY simple primer: when the image shows green, it is good. When it doesn't,
well that's bad. One difference is that as the wheat matures through spring and
then is gone after harvest, those areas normally go from green to not-green
over time. so during late spring and into summer, those areas are less green
(normally) than their surroundings, while during early spring with, the green
wheat can be much more green than the surrounding still-dormant vegetation. For
example, check out this map from April 5, 2010.
See the wheat belt show up as that green blob from SW through NC OK? Now look
at what happens after that wheat is harvested and we're left with bare fields,
or stubble, or plowed ground in this map from June 28 that year.
Those differences in ground cover can cause mesoscale areas of differential
heating across the wheat belt and surrounding areas and therefore also impact
things like dewpoints and air flow. Pretty cool, eh?
Okay, enough of that. On with the images from this year! We make a big jump
from May 26 to June 23 to emphasize the drastic improvement.
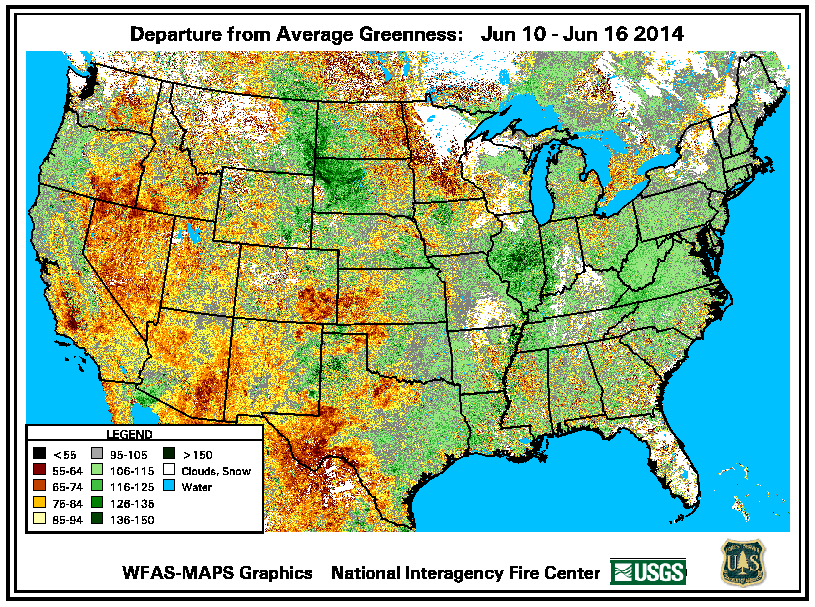
The improvements are actually quite dramatic across western Oklahoma, although
far southwestern Oklahoma is still fairly non-green. I actually like to show
the departure from normal greenness maps as well, since this takes into account
how much greener or less green it is for that particular time of the year. These
images from space clearly show the improvements as well. We're gonna show the
departure from average greenness maps from the weeks of May 6-12 and
June 10-16 since the other images were contaminated by clouds. Still, a
dramatic improvement is seen over that three week period.

Now a little bit of the greenness improvement is due to the weather finally
getting warmer, but most of it was due to the uptick in rainfall. The results
are the same regardless ... a sudden end to the elongated wildfire danger season
that we saw last way too far into deep spring. The key now is to keep getting
rain and not let that vegetation dry out and go dormant over summer, preventing
our secondary fire season to erupt as we get into late July and August.
It appears that for the near term there will be chances for showers and storms,
at least, but nothing widespread it appears. This 7-day rainfall forecast map
shows some good totals up in northern Oklahoma, but that looks sort of ominous
to me, and probably reliant on storms firing to the north of Oklahoma actually
making it to that area before they fall apart, maybe.
Word has it we'll return to summer this weekend through early next week. For
those that have seen relief, you're in better shape than a month ago. For those
that haven't, well, keep some shade handy.
Gary McManus
State Climatologist
Oklahoma Mesonet
Oklahoma Climatological Survey
(405) 325-2253
gmcmanus@mesonet.org
June 26 in Mesonet History
| Record | Value | Station | Year |
|---|---|---|---|
| Maximum Temperature | 115°F | HOLL | 2011 |
| Minimum Temperature | 52°F | KENT | 2006 |
| Maximum Rainfall | 5.51 inches | MIAM | 2021 |
Mesonet records begin in 1994.
Search by Date
If you're a bit off, don't worry, because just like horseshoes, “almost” counts on the Ticker website!