Ticker for May 29, 2014
MESONET TICKER ... MESONET TICKER ... MESONET TICKER ... MESONET TICKER ...
May 29, 2014 May 29, 2014 May 29, 2014 May 29, 2014
A quick drought Tick (and some updated tornado numbers)
Like magic, I talk about record low tornado numbers and later that day they start
to multiply. Yes, I am that powerful (i.e., bad research). But, that's why I
use the "preliminary" tag as the NWS continues to ferret out chaser reports and
make their investigations. The folks at the NWS have now confirmed two more
tornadoes for May bringing this month's total to 3, and the total for the year
thus far to 7. And remember, that number is still preliminary as they may have
a few more reports to investigate. That changes our lists from yesterday.
-***-
Year May
2005 0
1988 2
2014 3
2012 3
1958 4
2006 4
1967 4
2009 4
-****-
By the way, 2012 shouldn't be bragging since they had already experienced 59
twisters in March and April, with a record 54 of those touching down in April.
Here's the updated list for January-May totals.
-***-
Year Jan-May
2014 7
1988 7
1958 10
1989 10
1952 12
1970 13
2002 14
2005 15
1969 15
1974 15
1963 15
-****-
Still one of, if not tied for, the slowest starts to the tornado totals in state
history. All of this is a bit tricky anyway. Take that "12" from 1952, for
instance. Do you think there were 300 chasers on every single storm that formed
in the state back then, sending reports and pics and videos to the authorities
to investigate, like today? At any rate, numbers is numbers, and comparing them
is fun.
-------------------------------------------------------------------------------
Drought improvements!
The big rains of last weekend (and beyond) are still fresh in everybody's minds,
so let's show them one...more...time. I'll go back 10 days to be sure and
capture all of it. Here are the Mesonet totals with the radar-based estimates
from the NWS Arkansas-Red Basin River Forecast Center.
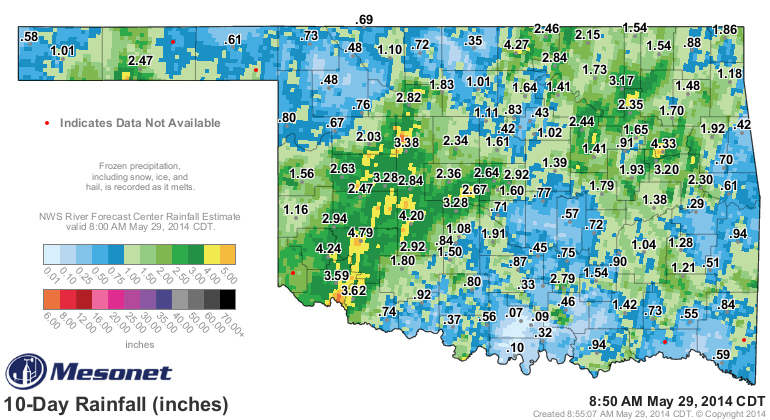
Lots of great totals in there, along with some not-so-great totals. Jackson
County up through Blaine County had the most widespread heavy rains, but the
NE was pretty luck as well. Newport and Burneyville sat this one out with 0.07
and 0.10 inches, as did Medford with 0.35 inches. Some others didn't get nearly
enough while places like Altus (3.59"), Mangum (4.24") and the leader, Hobart
(4.79") were gluttonous in their amounts. Porter up in the northeast led that
area with 4.33 inches.
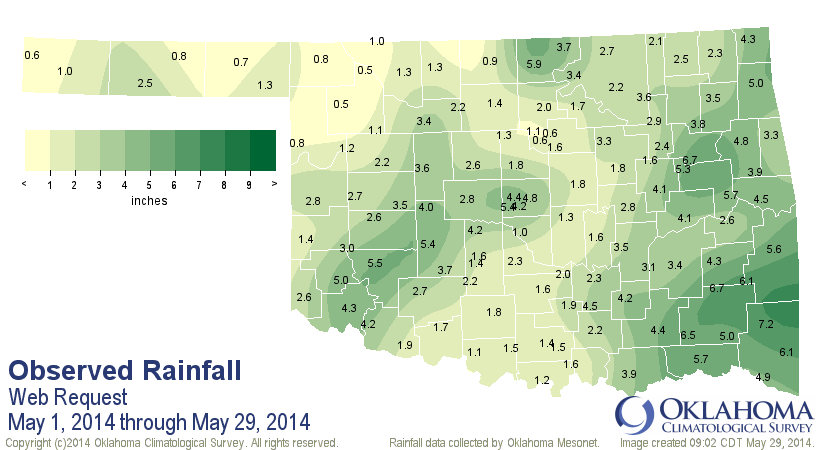
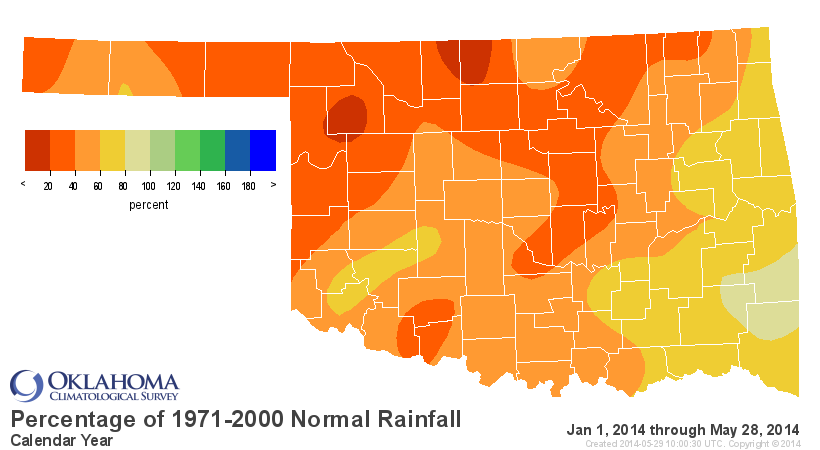
What that rainfall did was make one of our driest Mays on record suddenly
become one of our 30 driest Mays on record. Well, suddenly after an 8-day
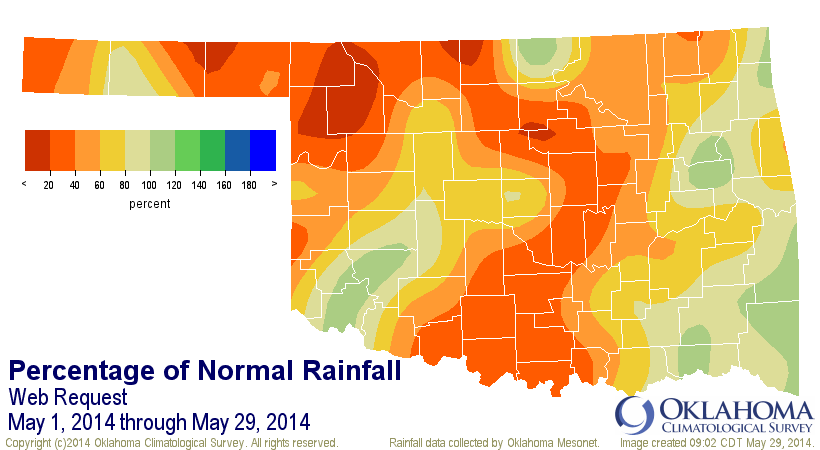
rainstorm. So when you take a look at the pct of normal map in particular,
you'll see why the entire state didn't suddenly show drought improvements.
(go tell the folks in Woodward or Hooker about all the rain you got, then duck!)
Check out the statistics table for that period. With a couple days left and
little rain in the forecast for Friday and Saturday, our statewide ranking of
26th driest is on the way down instead of up.

One more precursor to this week's Drought Monitor map, remember the long-term
nature of the drought as well. Since the beginning of the year, this latest
rain matters, but it's simply not enough to erase those huge deficits. SW OK
looks much better, at least, but still most of the NW 2/3rds of the state
range from less than 20% to 60% of normal.
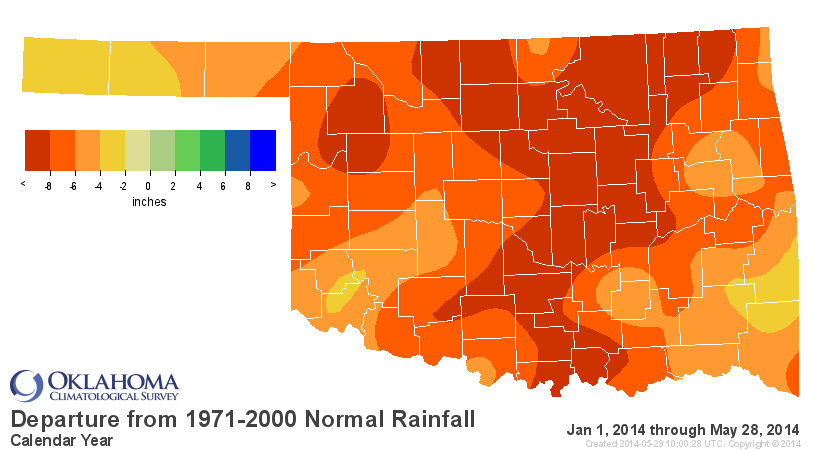
Medford has had 1.8 inches for the year thus far, about 12.6" below normal.
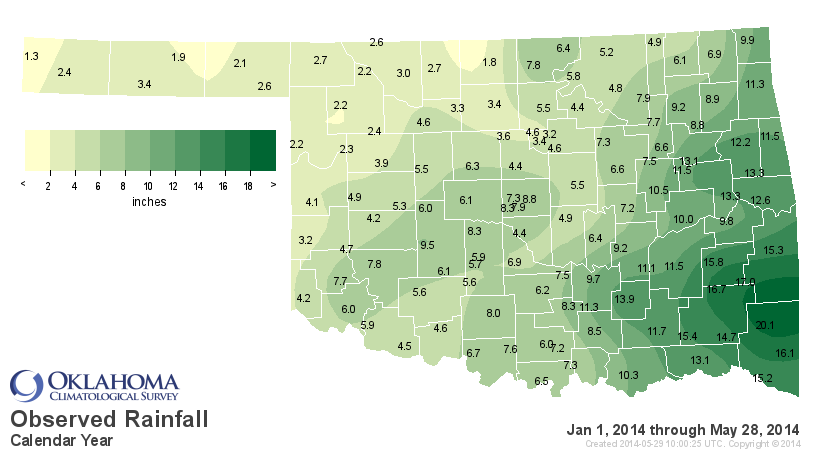
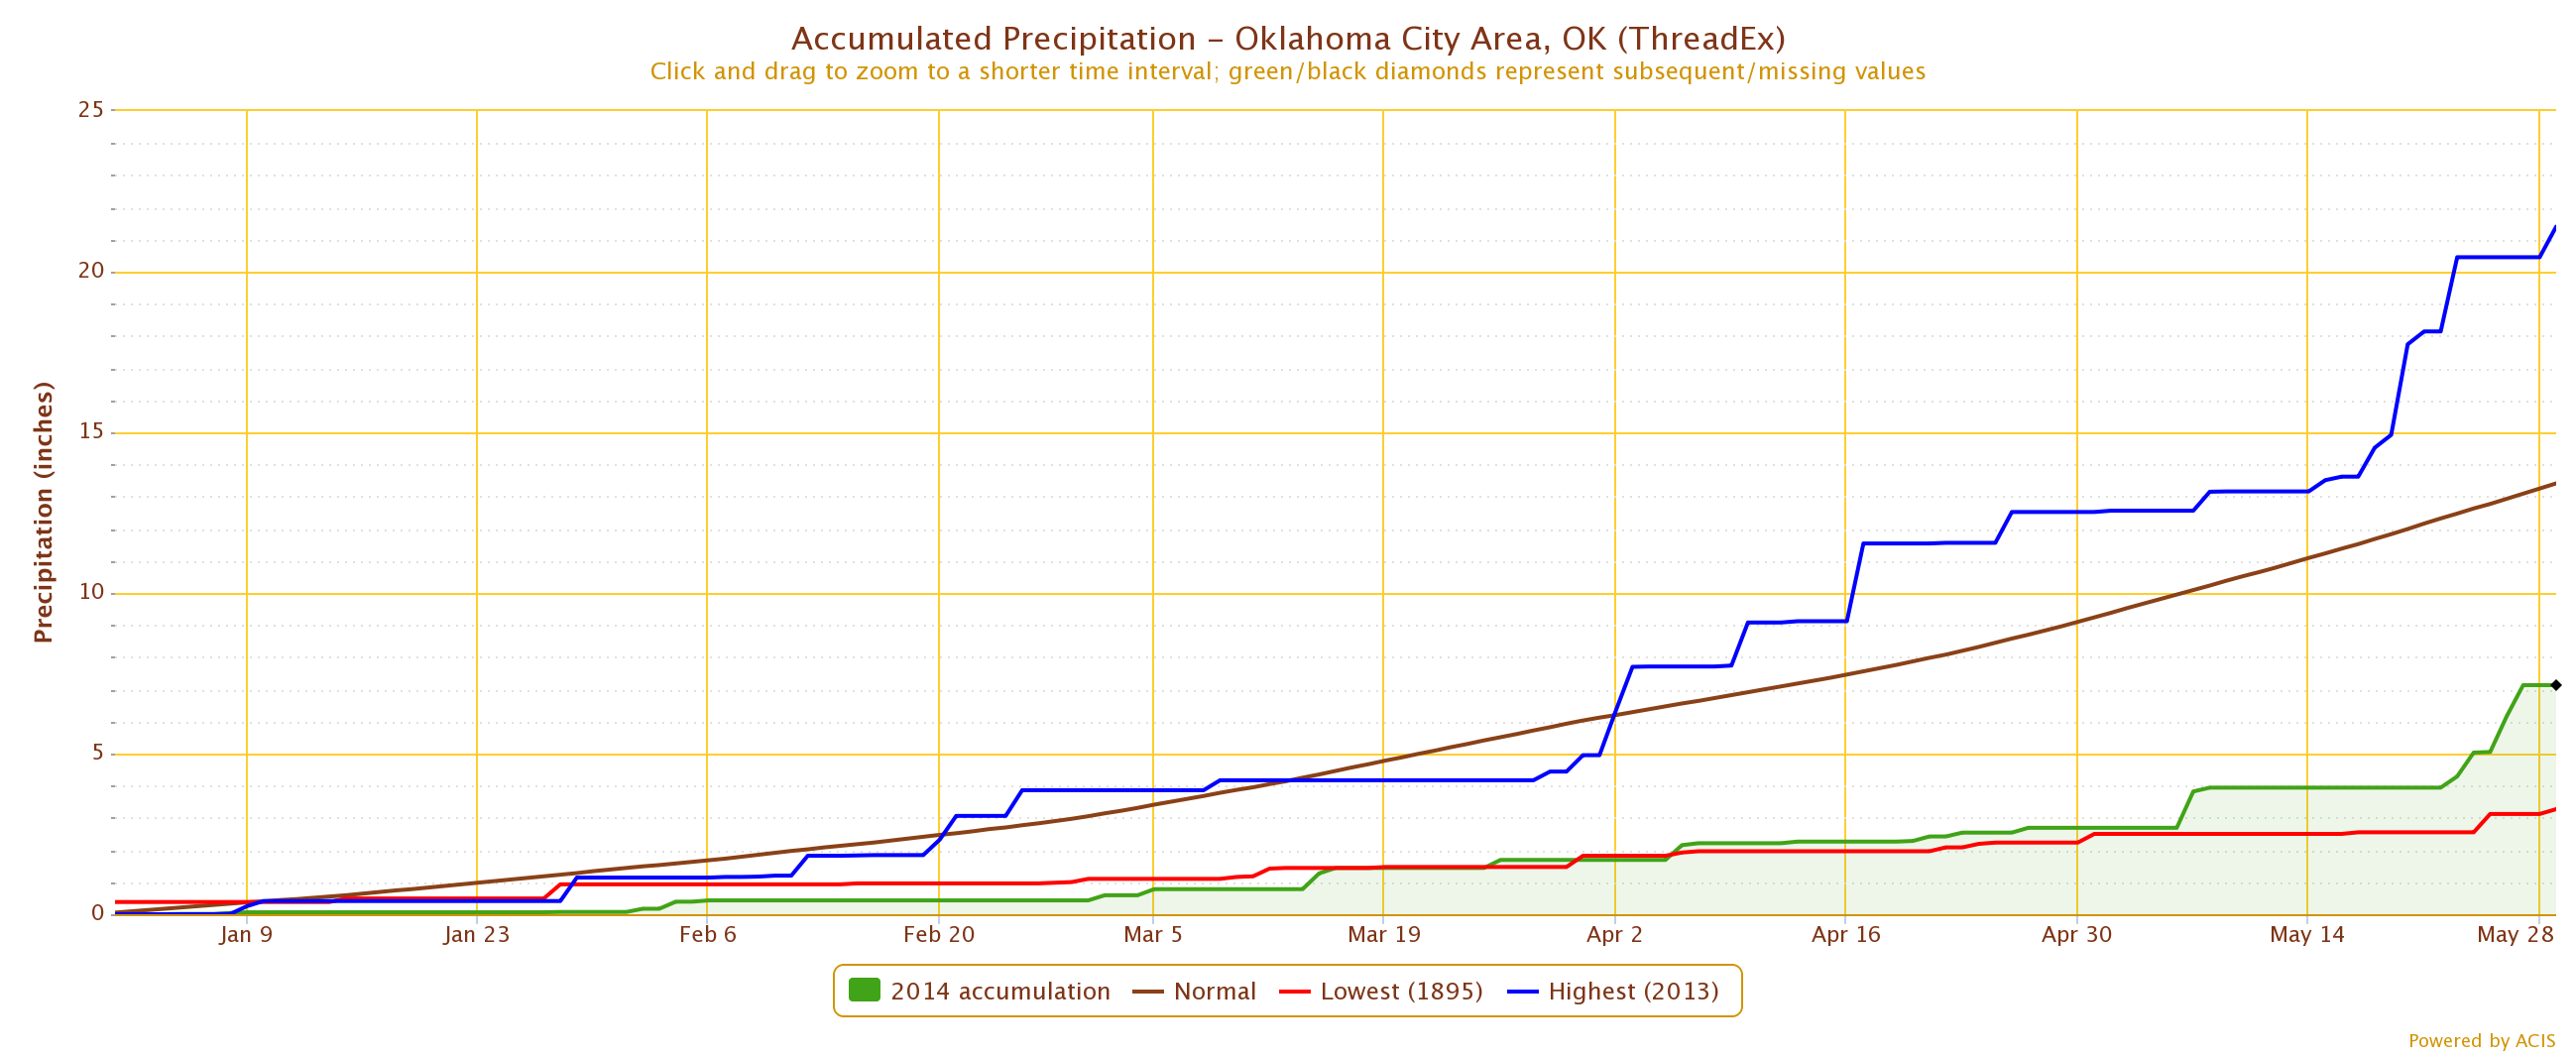
Check out the climate division and statewide statistics for the year-to-date
period. We still have a long way to go with the 3rd driest Jan-May shaping up.

And congrats to OKC for upping its year-to-date total from 2nd or 3rd driest to
12th driest at 7.13 inches (still about 6.3 inches below normal).
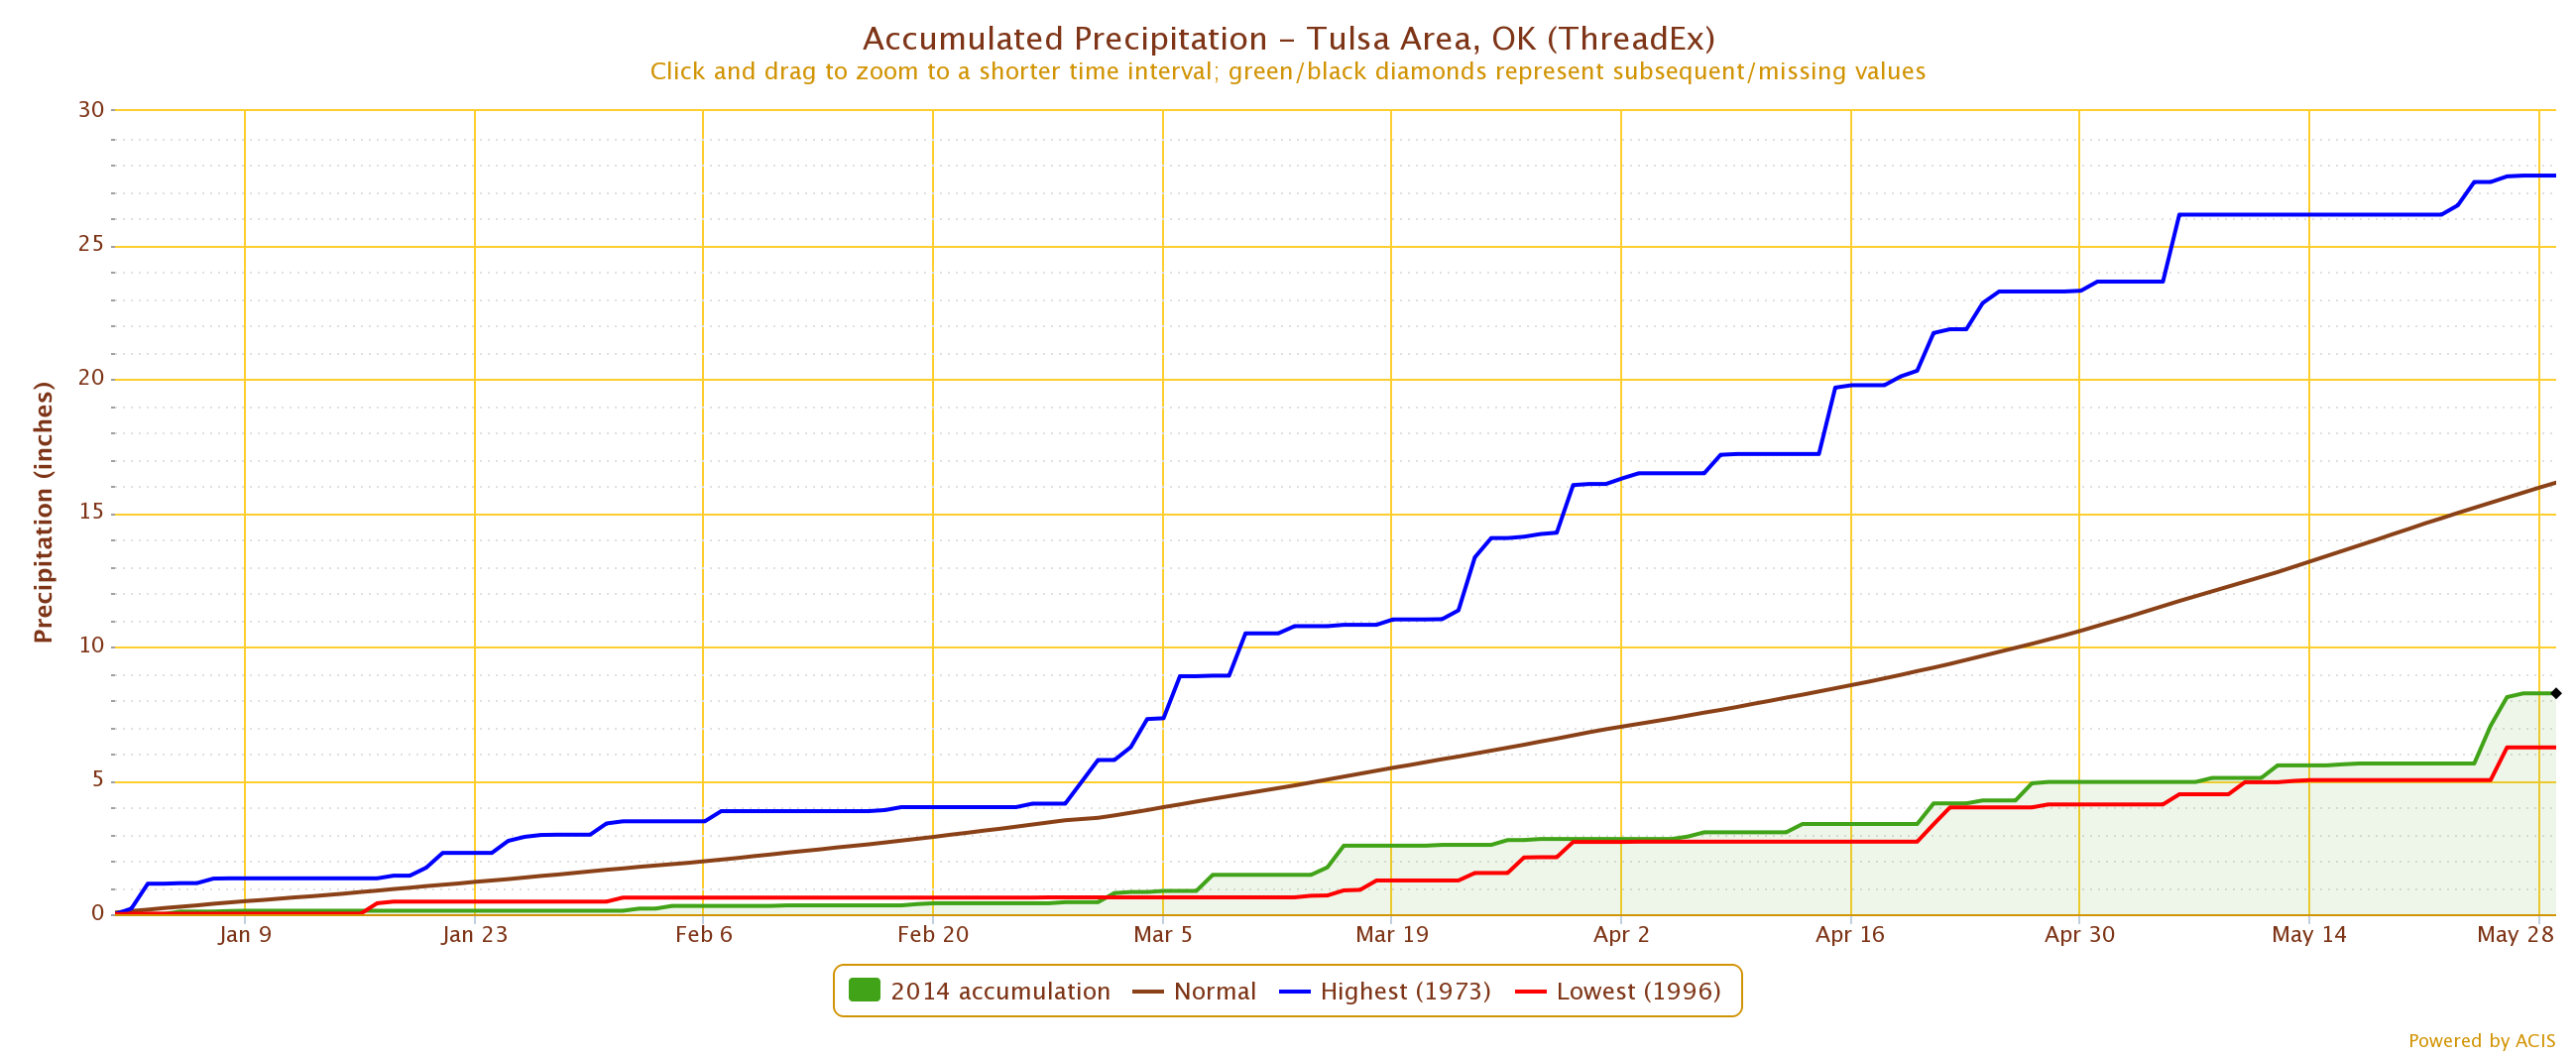
Tulsa is starting to move down again, now at their 5th driest start to the year
with a total of 8.25 inches (about 8 inches below normal).
Okay, so with all that in mind, here's the latest U.S. Drought Monitor map for
Oklahoma.
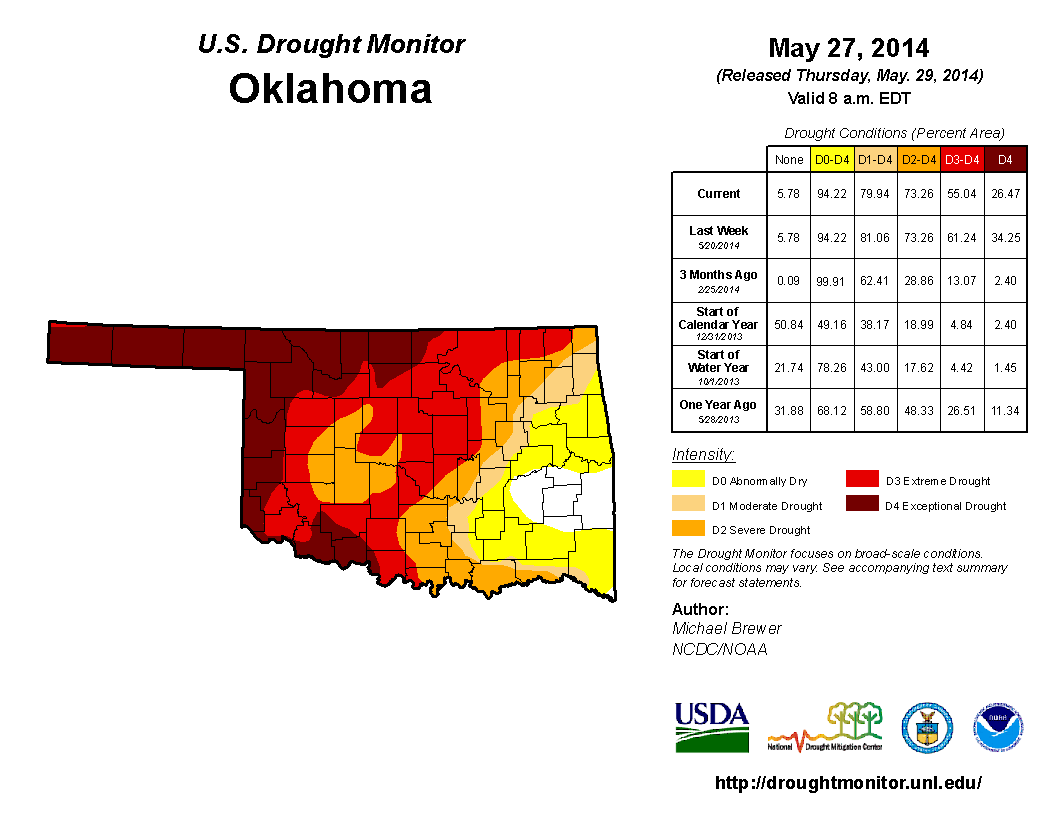
The amount of the state actually in some drought intensity (D1-D4) dropped from
81% to 80%. WHOO-HOO! But the real improvements came in the upper-end intensities,
with D3-D4 from 61.2% to 55% and D4 from 34.3% to 26.5%. Yeah, it's not a huge
change, but it's a start, no. And there's still a good 2-3 weeks of our normal
rainy season left to build off of. Forecasts are starting to show more rain
possible for next week, so we have that hope of knocking more of this drought
out before summer hits.
Now I have to go mow. The ONE big benefit of drought will now disappear in a
cloud of smoke and grass clippings.
Gary McManus
State Climatologist
Oklahoma Mesonet
Oklahoma Climatological Survey
(405) 325-2253
gmcmanus@mesonet.org
May 29 in Mesonet History
| Record | Value | Station | Year |
|---|---|---|---|
| Maximum Temperature | 107°F | BEAV | 2011 |
| Minimum Temperature | 42°F | KENT | 2019 |
| Maximum Rainfall | 5.19 inches | HECT | 2001 |
Mesonet records begin in 1994.
Search by Date
If you're a bit off, don't worry, because just like horseshoes, “almost” counts on the Ticker website!