Ticker for April 16, 2014
MESONET TICKER ... MESONET TICKER ... MESONET TICKER ... MESONET TICKER ...
April 16, 2014 April 16, 2014 April 16, 2014 April 16, 2014
More wind? What else is new?
Hey, it is Oklahoma, wind is expected ... but this is getting kind of ridiculous.
The hair on my head is really having trouble these last few weeks. Yes, I only
have one left, but it never knows whether to blow to the left or the right.
Want proof that it has been windier than normal? Well, that's where the Mesonet
long-term averages (1999-2013) come in vs. the current data. You can find our
long-term averages and also the departures from those long-term averages on our
"Past Data and Files" page.
http://www.mesonet.org/index.php/weather/category/past_data_files
You can choose graphs or maps, and you can look at just about every single Mesonet
parameter we measure and also those that we calculate. Now here's the interesting
thing, and I've been bemoaning about this for months now. All those enhanced
wildfire danger days we've been seeing, LIKE TODAY'S(!!)
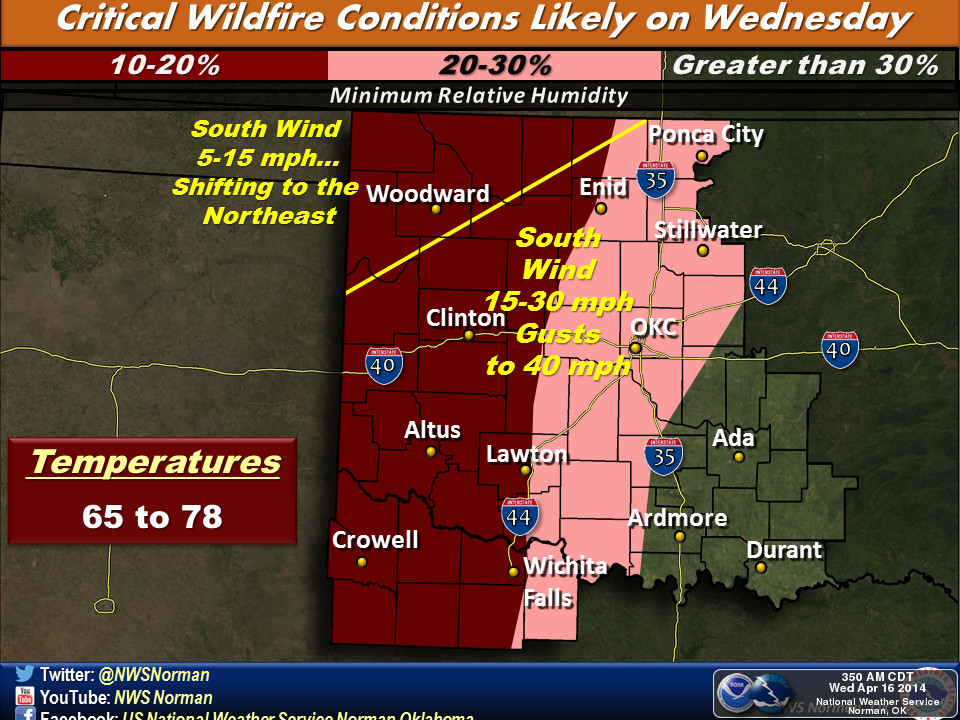
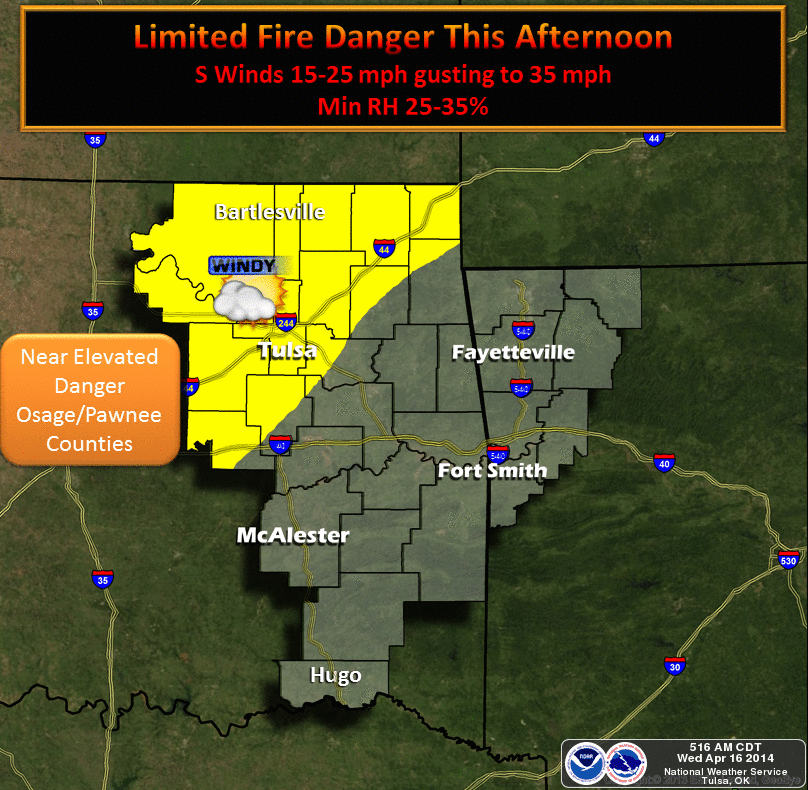
accelerate the severity of the drought through the very conditions that create
the fire danger ... low humidity, strong winds and at times, above normal
temperatures. And we've seen a lot of the first two throughout the year thus far,
especially out west and especially in January, March and April. February was a
bit of a lull in the fire danger season. Here's the kicker ... I can show you
that using the long-term Mesonet data.
Let's start with Boise City, which has been thrown back into the 1930s with
multiple dust storms right out of a Ken Burns documentary. Let's take a look at
how their humidity, average winds and average max winds, and total evaporation
look compared to the long-term averages (1999-2013) for that station.
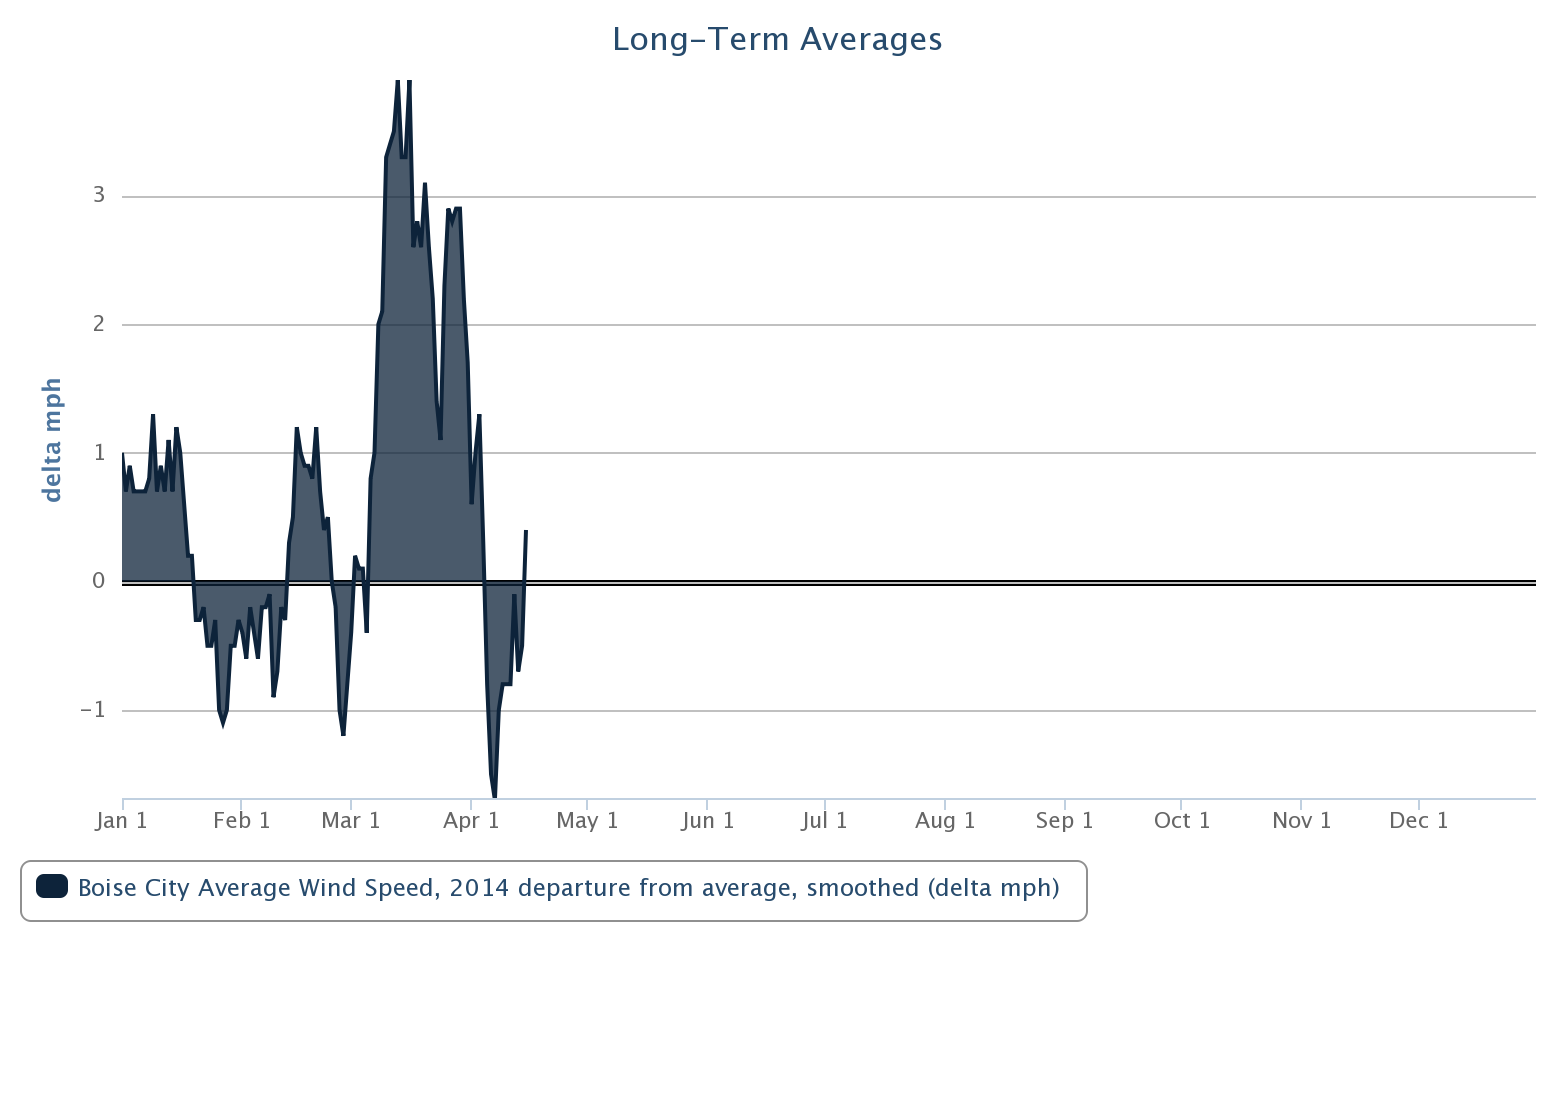
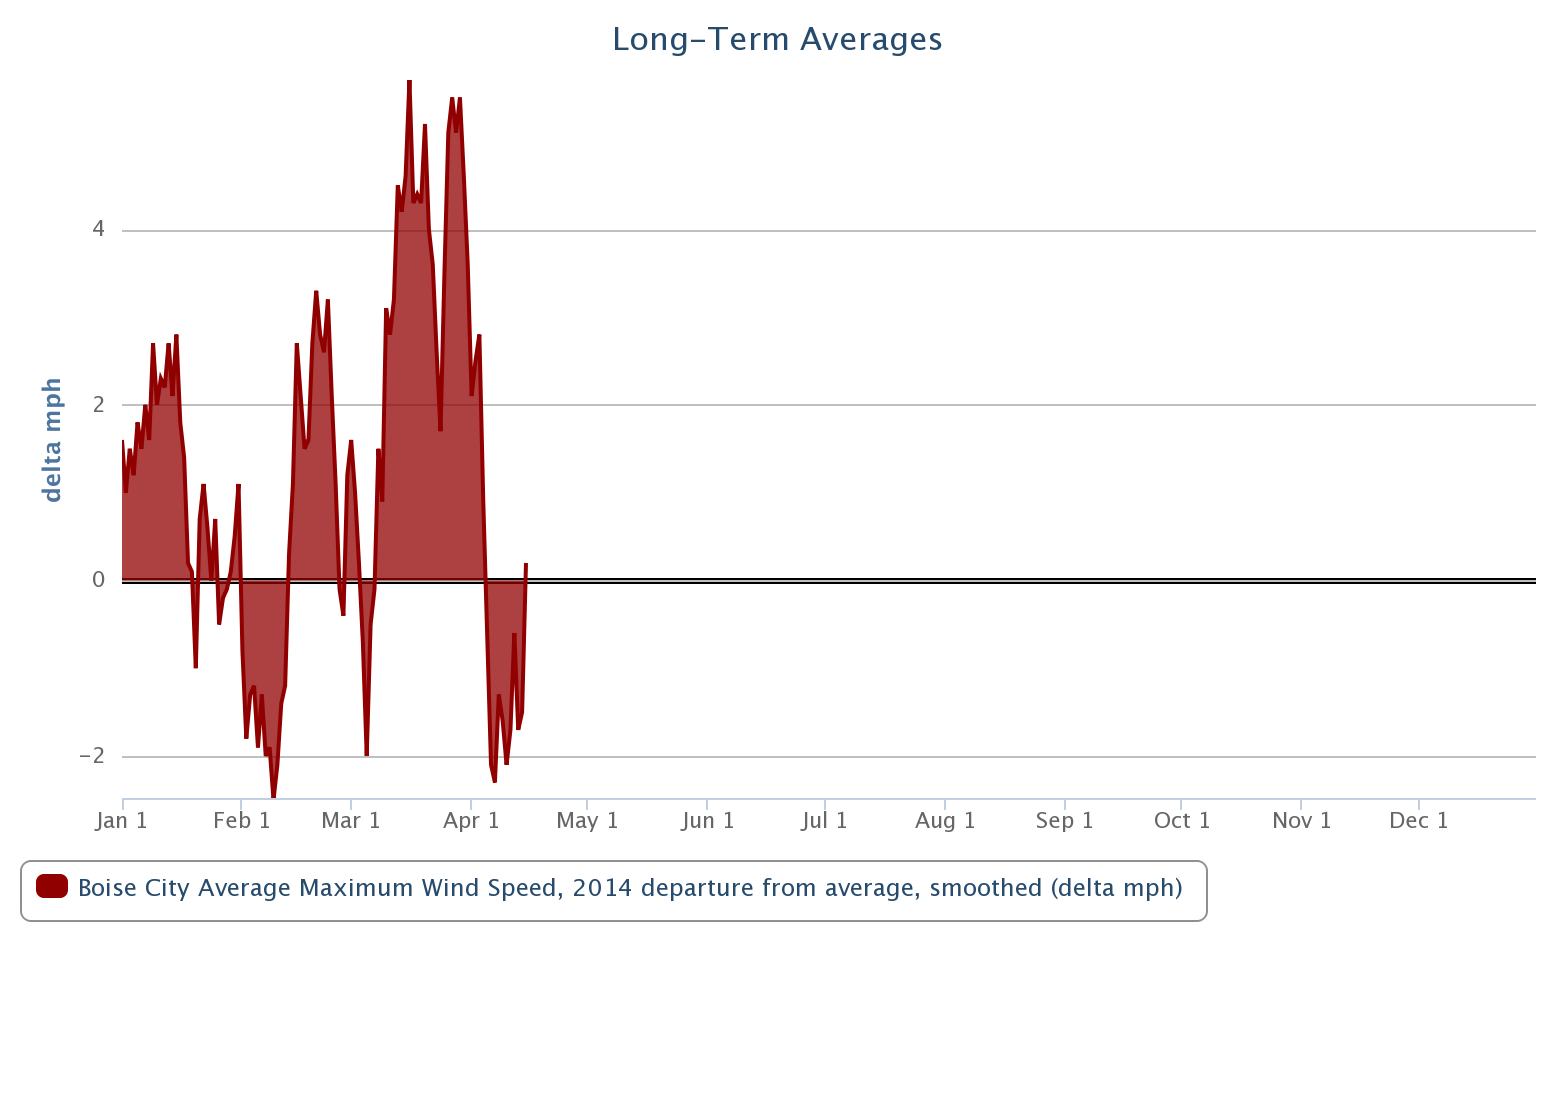
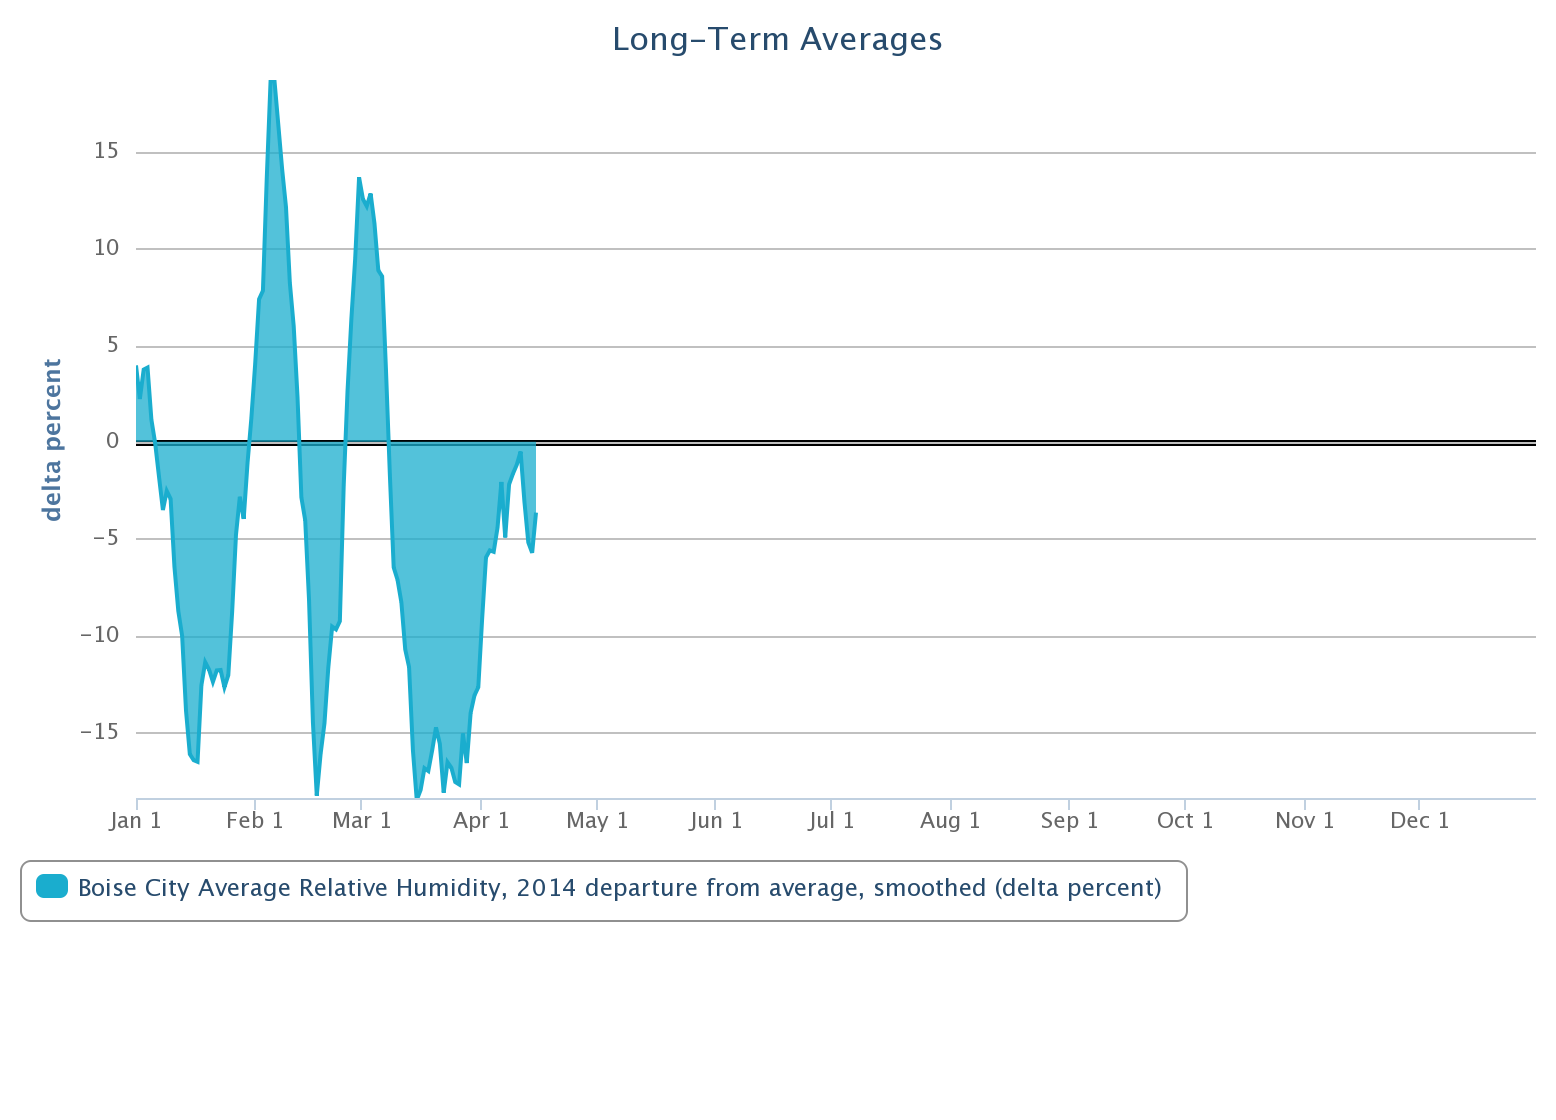
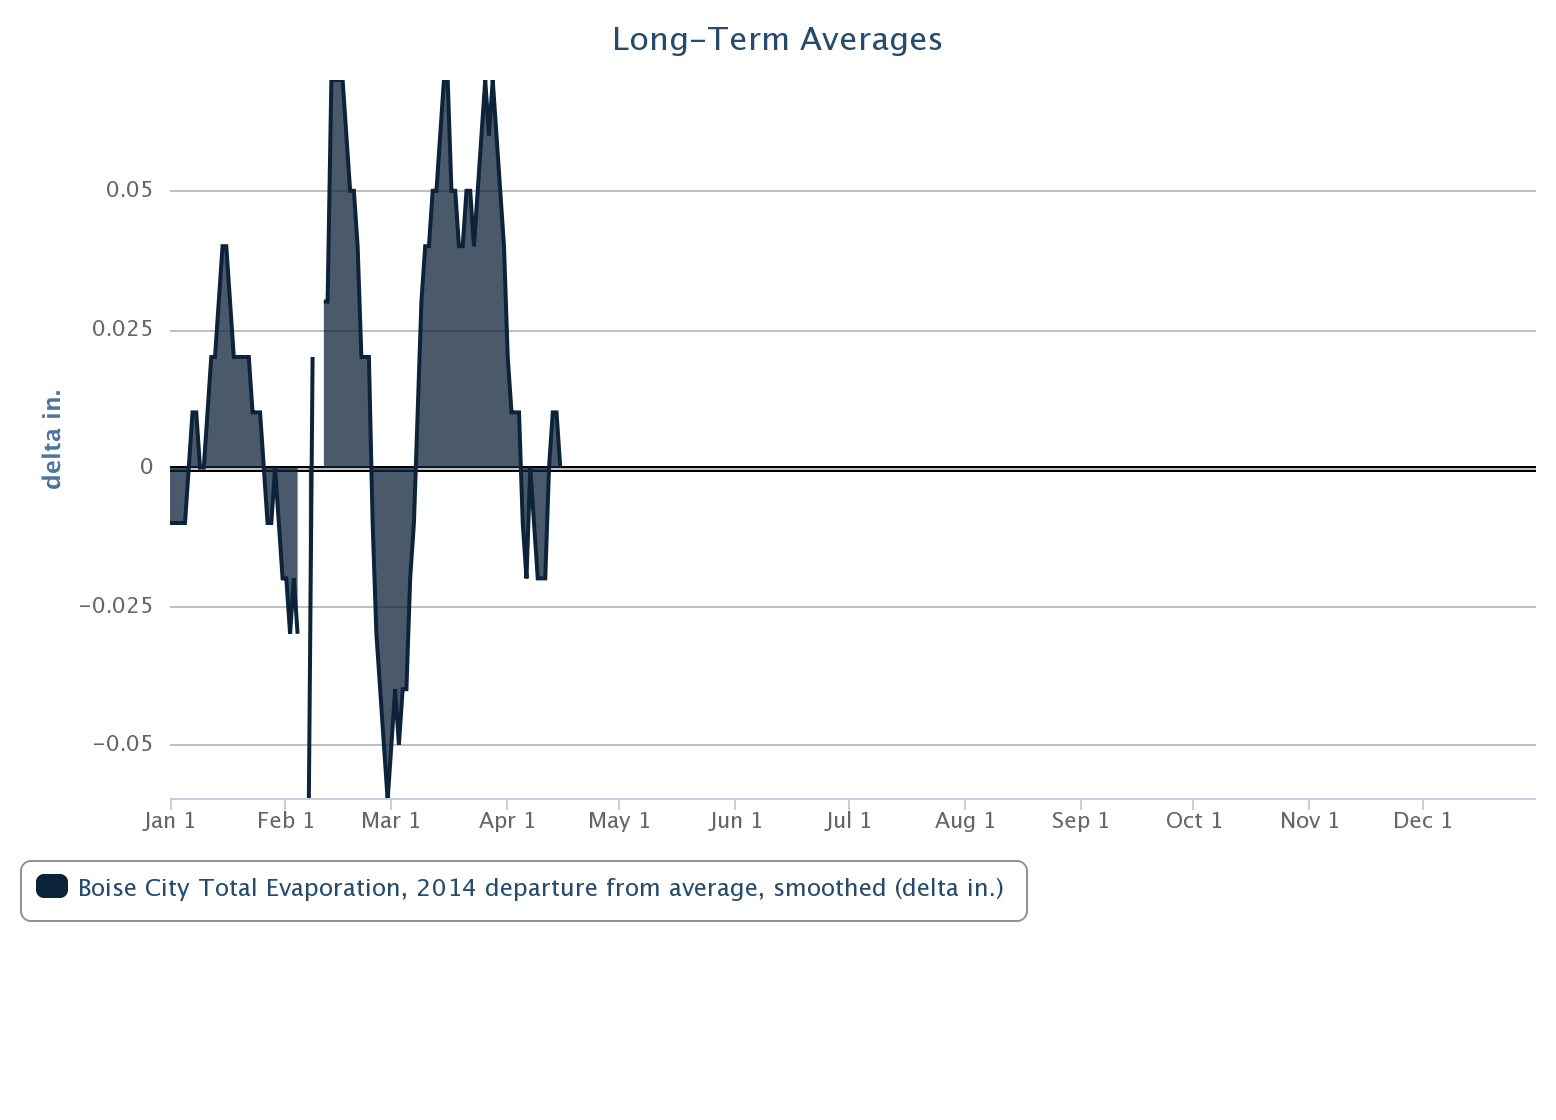
What do you see there? Well, you see that since January 1, 2014, Boise City's
average wind speed has been above normal for most of the year, especially during
March. Not quite so bad during April thus far. Same thing for their average
MAXIMUM wind speed, which is the average of the daily maximum 5-minute averaged
wind speed. So not only is their average wind speed above normal throughout the
day, but the highest wind speeds have been as well. We then see that their
average daily Relative Humidity has been below normal for most of the year
thus far, again especially in March. Finally, their total evaporation has also
been above normal for the most part (March stands out again). All of those
factors worsen drought by sapping surface water and also soil moisture.
Now you can do that for whatever station you want to look at, and obviously
things will be worse over in the Panhandle than say, down in McCurtain County.
But things aren't much different across much of western and northern Oklahoma.
Take Blackwell in north central Oklahoma, an area that has seen drought
steadily increase throughout the year. The data aren't that dissimilar for that
station.
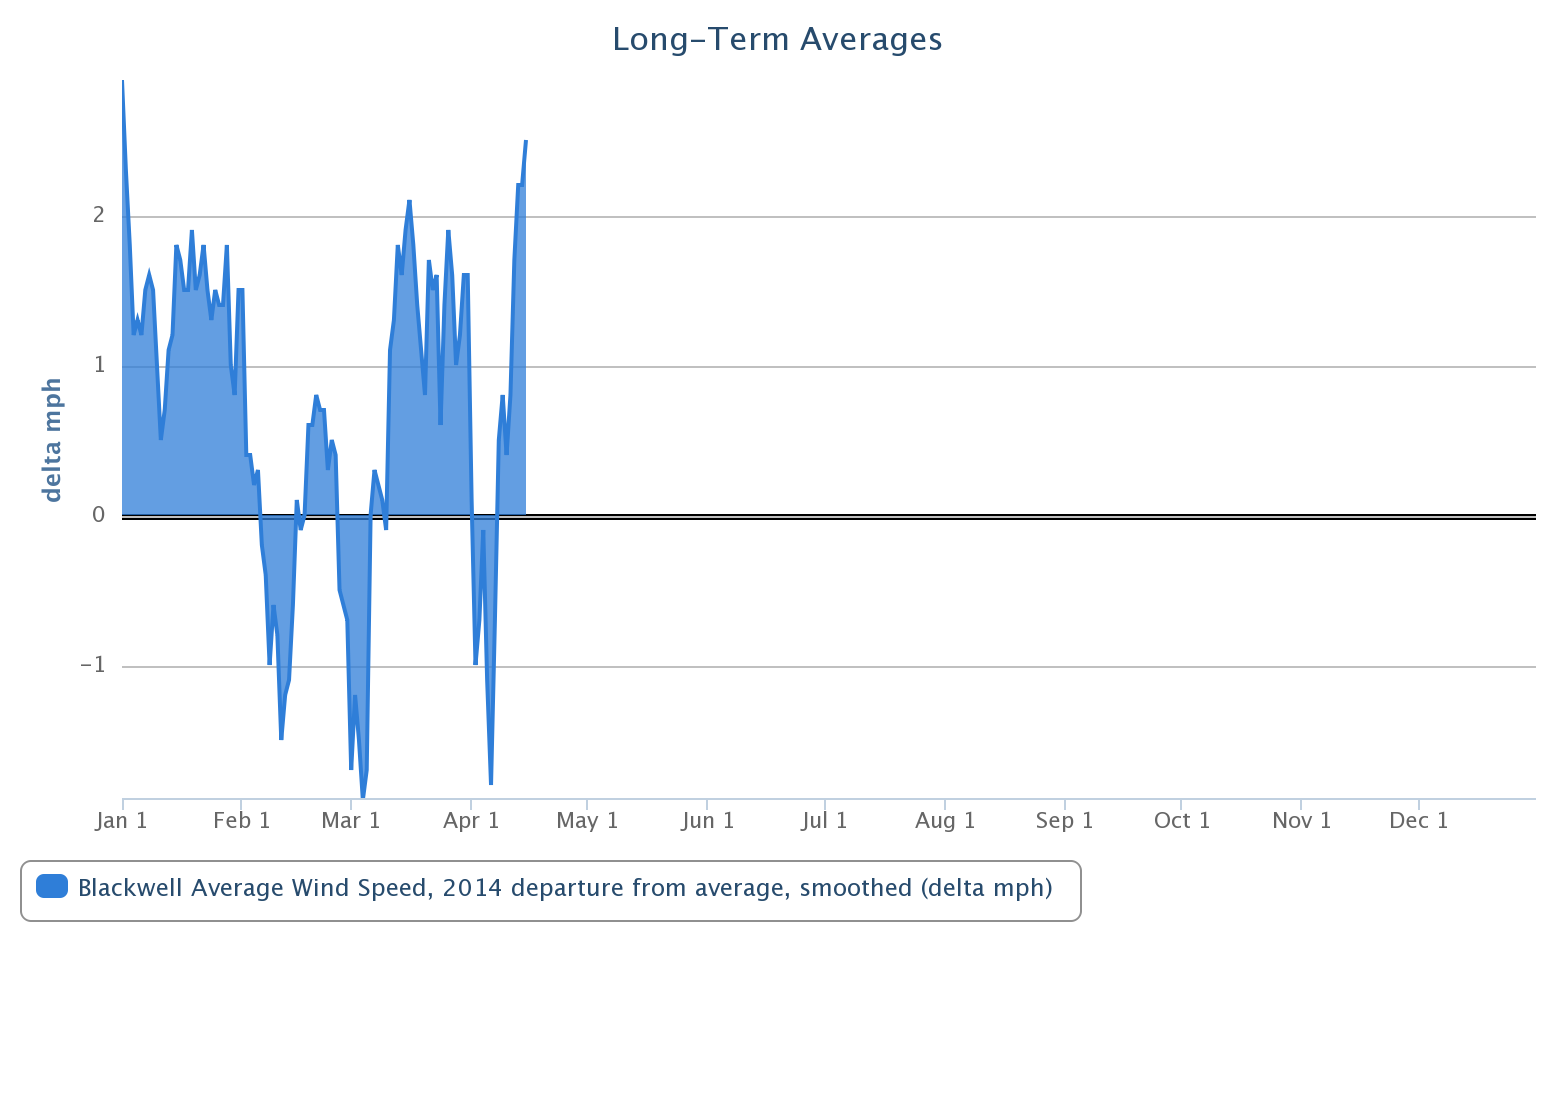
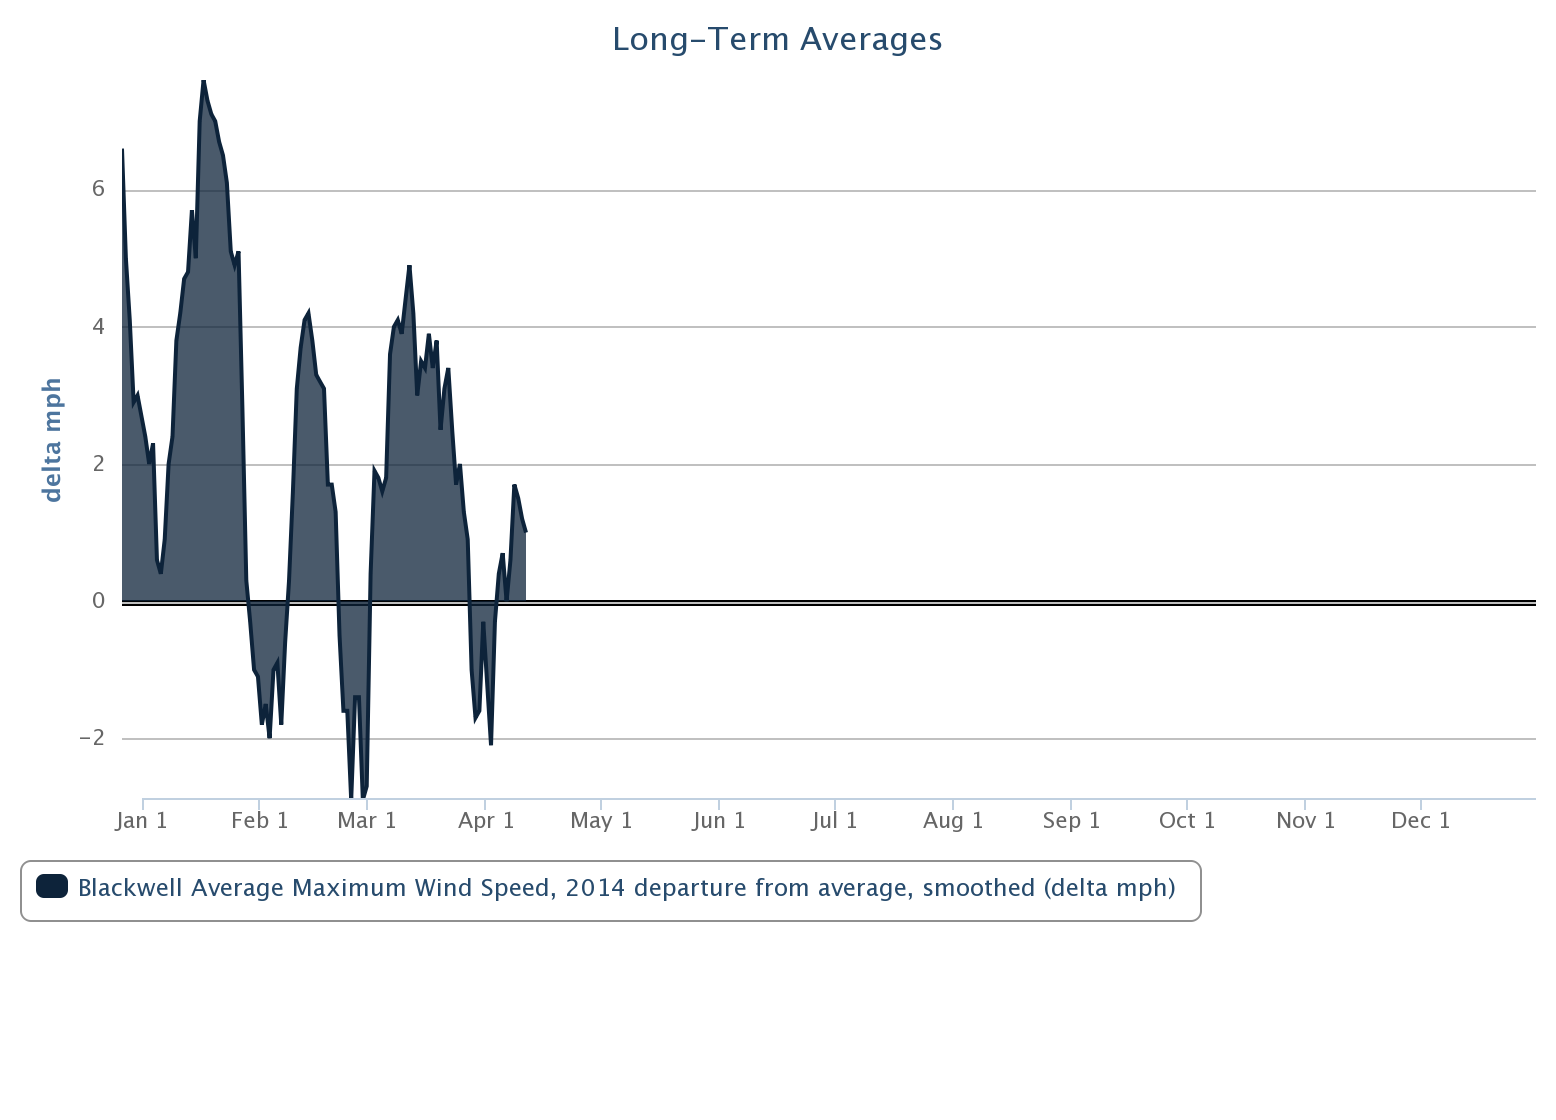
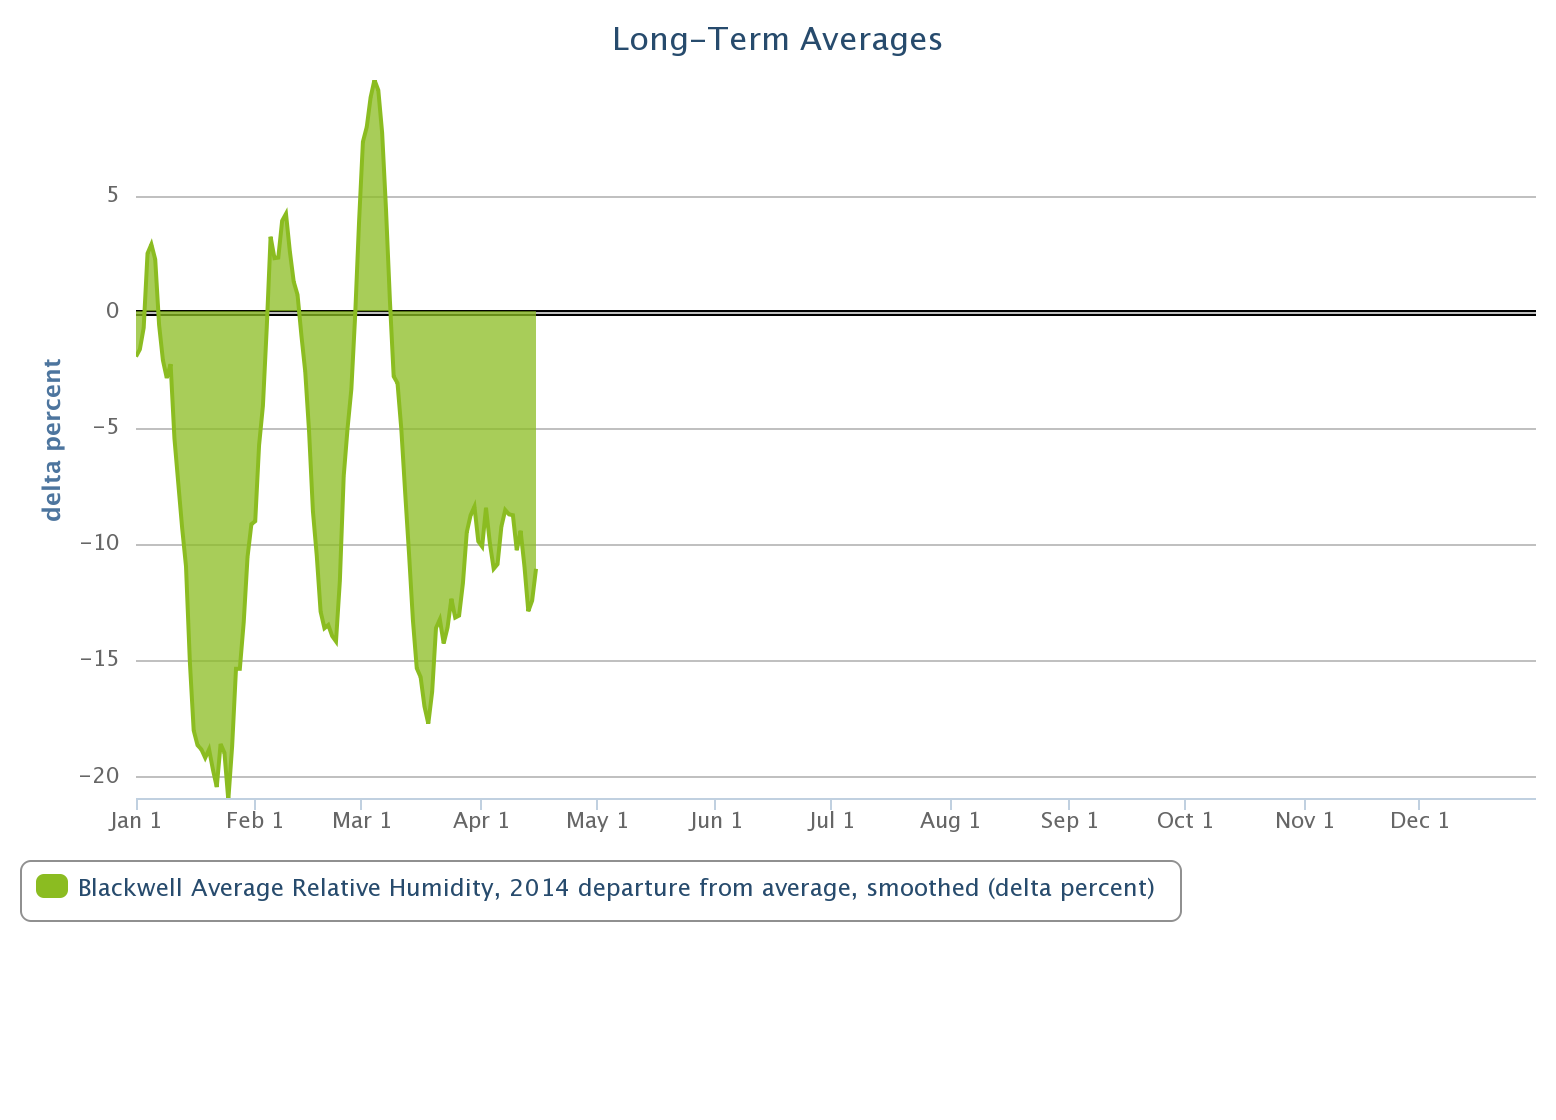
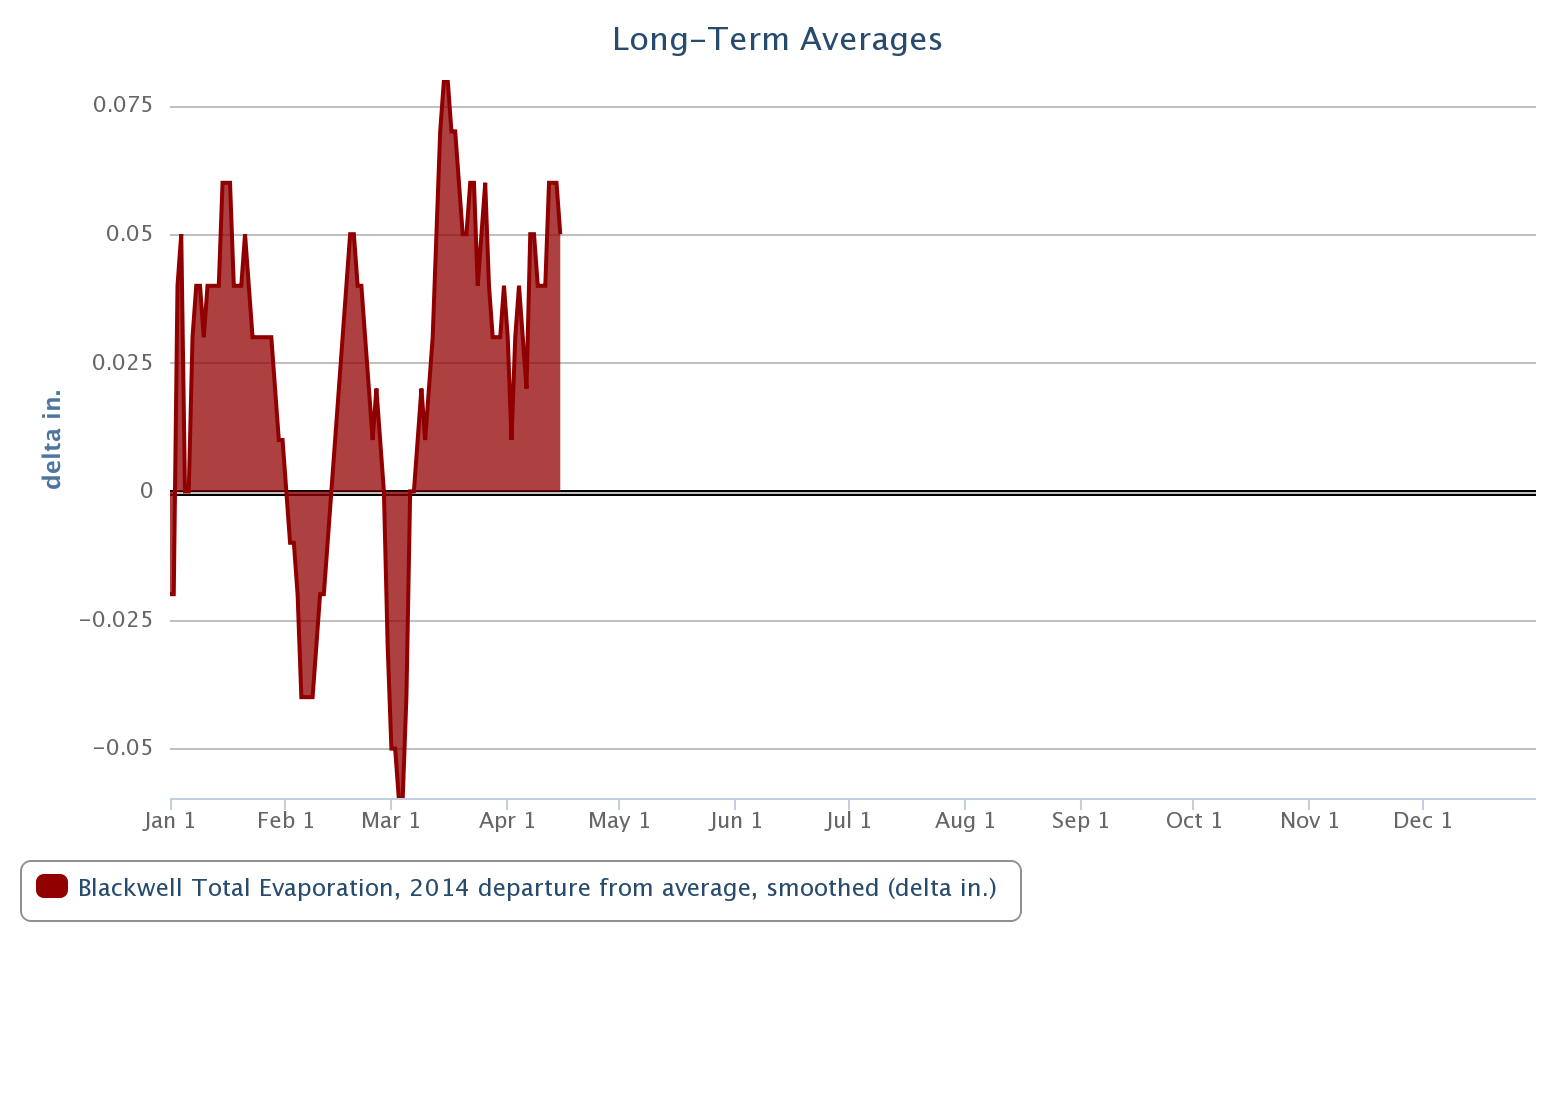
Just two examples of how even during the cool season, when drought intensification
is normally at its slowest, adverse weather conditions can cause drought
acceleration.
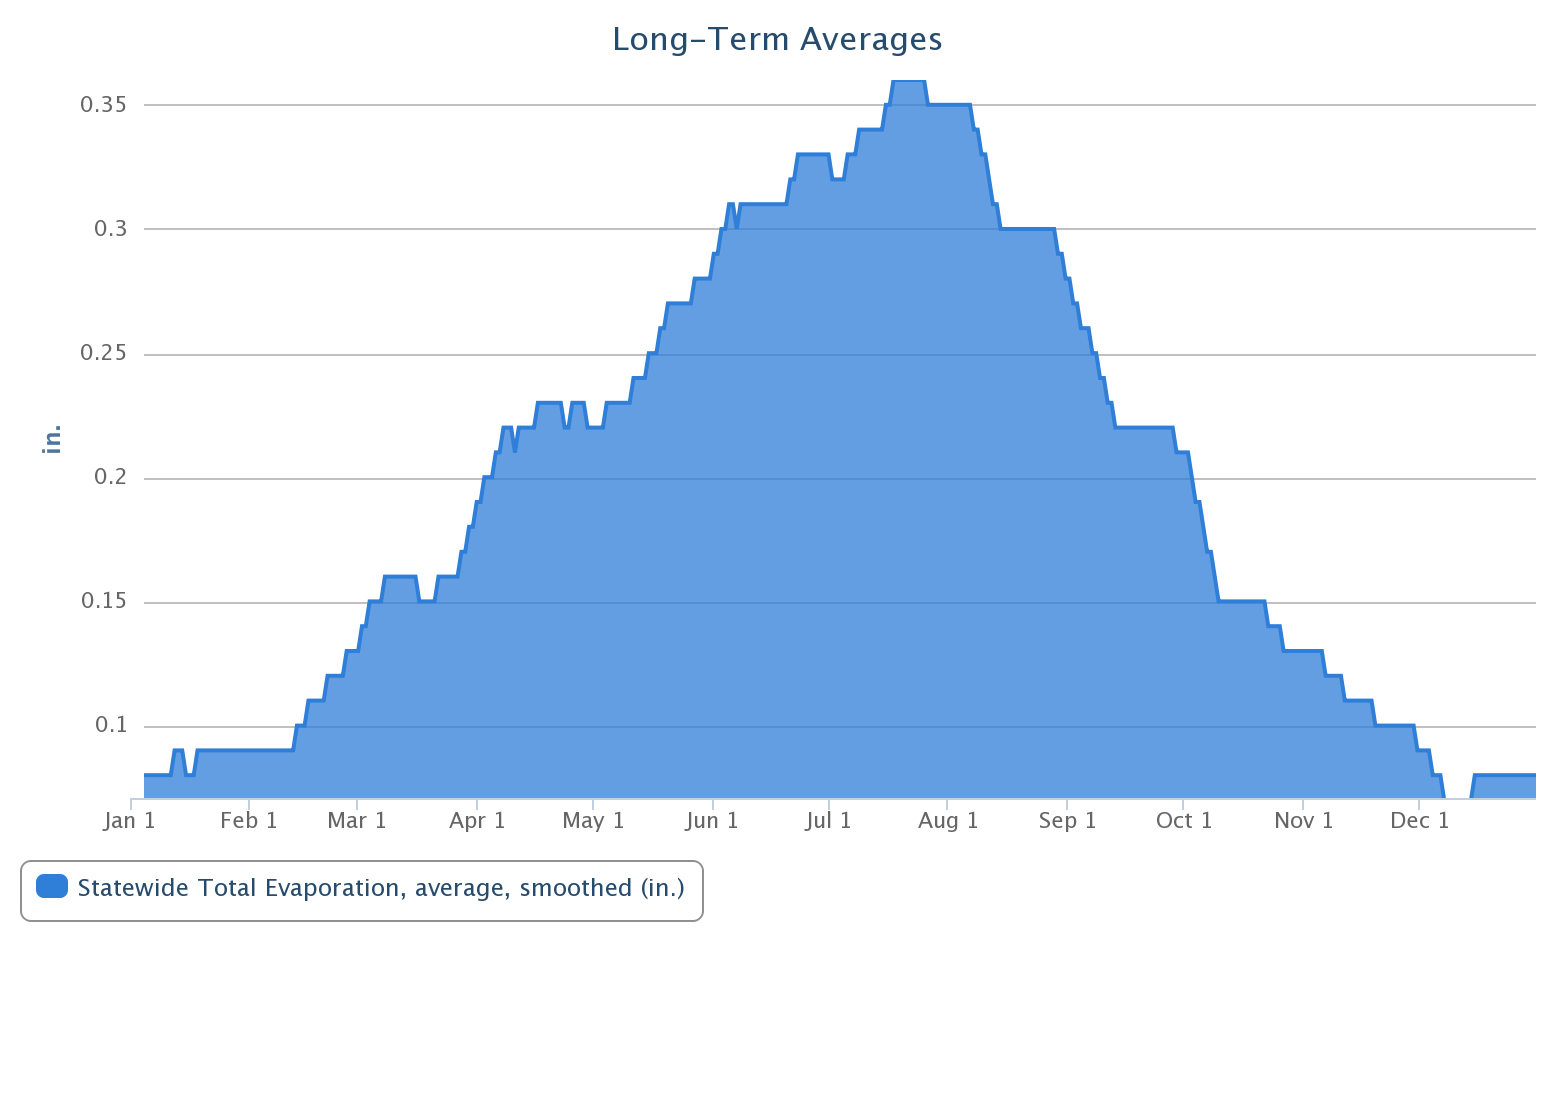
The map format can show this as well. Since we picked on March so much (I'd say
it was actually the other way around), let's take a look at how March stacked
up in those parameters across the state.
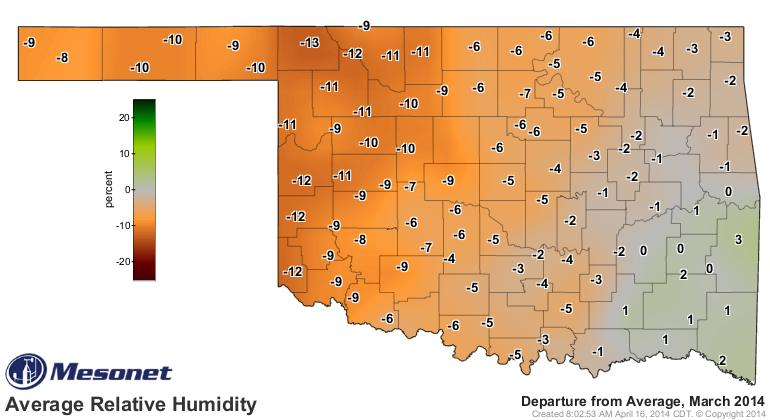
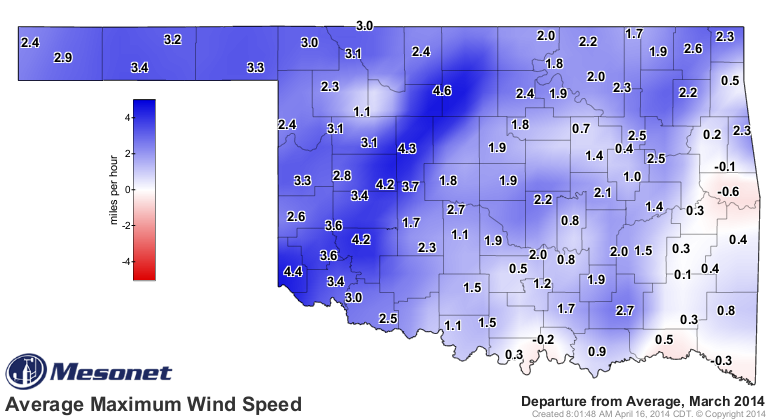
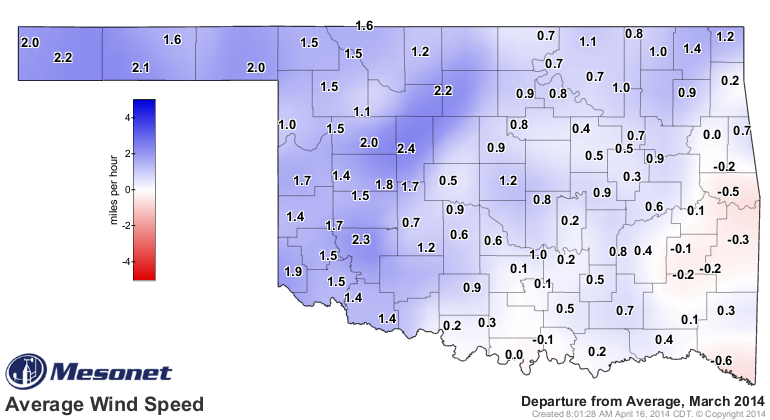
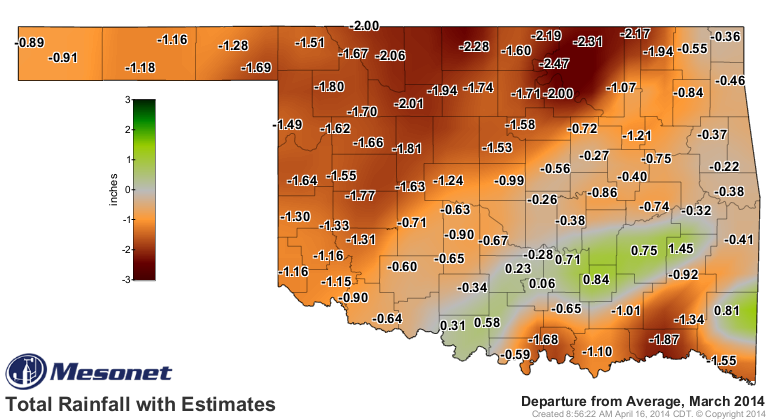
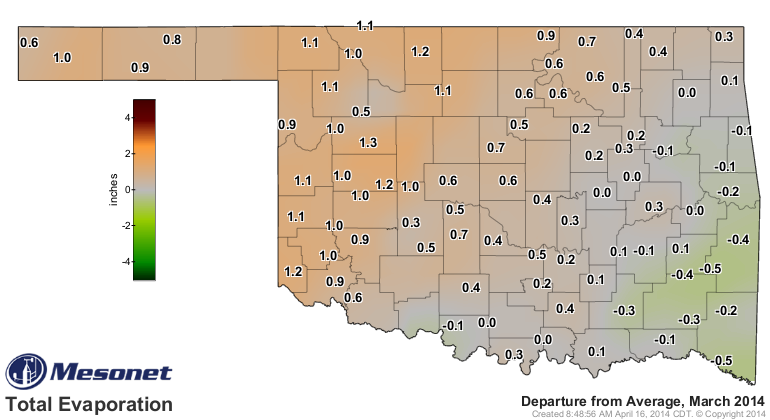
That last map tells an interesting story. The departure from average total
evaporation, in inches, across the state shows pretty clearly where the drought
has increased lately. So not only is the northwestern half of the state dealing
with a precipitation deficit, they're also losing more net moisture thanks to
an increase in evaporation. The one saving grace during March was just how
cold it was (21st coldest statewide since records began in 1895).
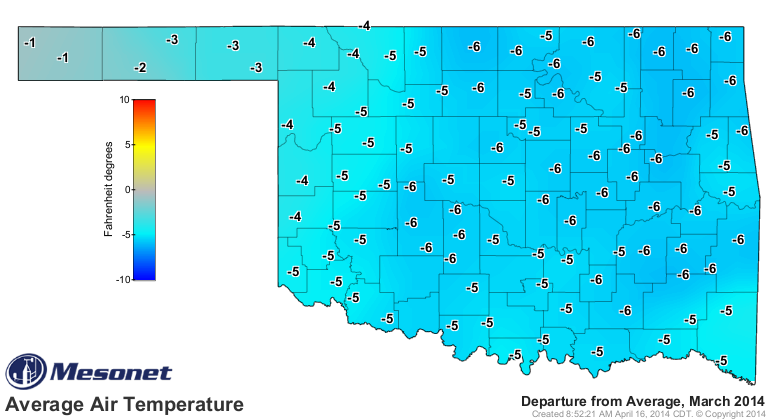
If we had seen heat like the March of 2012 (warmest on record statewide), we
would see an explosion of drought expansion. Of course, that month was also
fairly wet as well, so I'm sure we'd trade with 2012 in an instant.
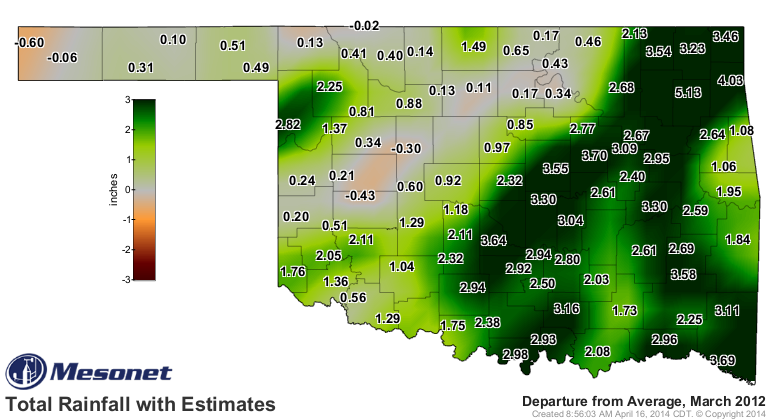
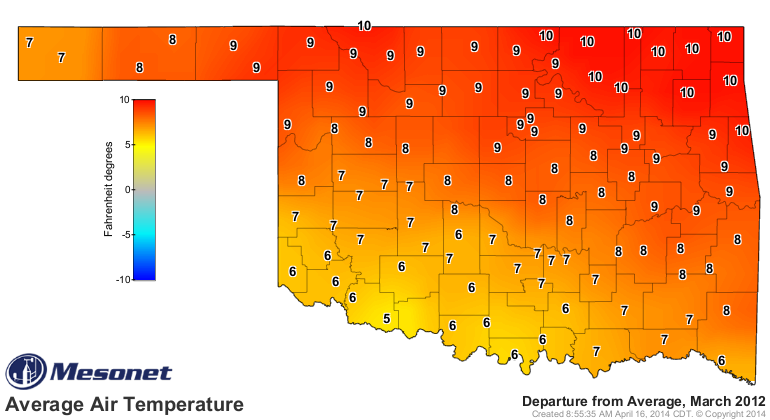
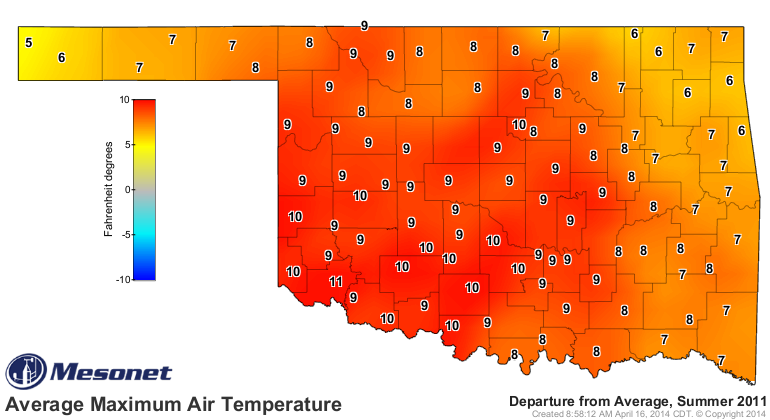
Anyway, go have fun with the data. Check out all the months you want or single
stations. Like the summer of 2011 departure from average maximum temperatures.
And remember this ... when looking at drought and trying to decide where and
how impacts are receding or expanding (i.e., my job every week), it's not just
how much rain has fallen and where. Drought is a many-faceted hazard.
Speaking of rain and drought, obviously our storm systems for Thursday and
Easter Sunday will help (but a few days of high fire danger afterwards won't).
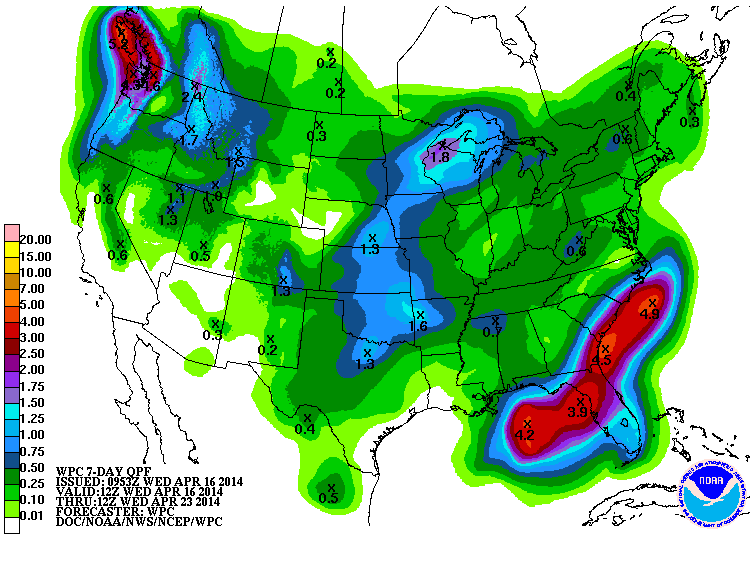
And those plants that are all waking up for the spring are thirsty. Time for
Mother Nature to turn on the spigot. We're just getting started with the
warm season and increased evaporation.
Gary McManus
State Climatologist
Oklahoma Mesonet
Oklahoma Climatological Survey
(405) 325-2253
gmcmanus@mesonet.org
April 16 in Mesonet History
| Record | Value | Station | Year |
|---|---|---|---|
| Maximum Temperature | 96°F | BURN | 2006 |
| Minimum Temperature | 20°F | FORA | 2018 |
| Maximum Rainfall | 3.75″ | TIPT | 2016 |
Mesonet records begin in 1994.
Search by Date
If you're a bit off, don't worry, because just like horseshoes, “almost” counts on the Ticker website!