Ticker for February 20, 2014
MESONET TICKER ... MESONET TICKER ... MESONET TICKER ... MESONET TICKER ...
February 20, 2014 February 20, 2014 February 20, 2014 February 20, 2014
The wind has hit the fan!
Oh, we'll get to that worsening drought map in a minute, but the pressing matter
is obviously the wind, which will lead to extreme fire danger today, and also
exacerbate drought conditions already in place. There ain't nothing like dry
25-60 mph winds all day to suck that soil moisture out of the ground. All thanks
to another dry cold front. Check out the latest wind maps from the Oklahoma
Mesonet. Simply put ... wow!
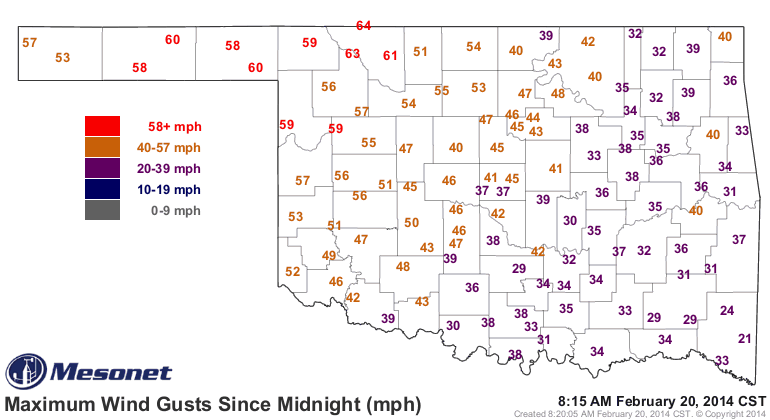
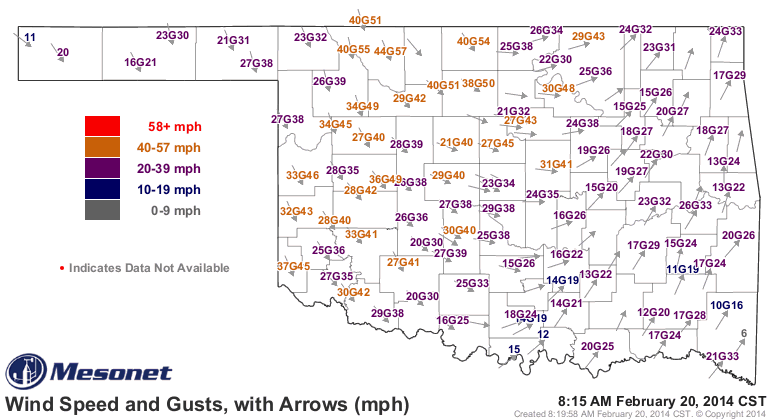
As you can see, when that front comes through your area, the winds are gonna blow
your socks off your feet and put your dog in a tree. We've seen lots of winds
exceed severe limits already without any thunderstorms to help. The winner thus
far would be the May Ranch Mesonet site with a gust of 64 mph. Here are some of
the worst gusts thus far.
-***-
Station Wind Gusts Time
May Ranch 64 mph 7:50 AM
Freedom 63 mph 7:50 AM
May Ranch 63 mph 7:45 AM
Freedom 61 mph 7:40 AM
Alva 61 mph 7:30 AM
Alva 60 mph 8:10 AM
May Ranch 60 mph 7:00 AM
Slapout 60 mph 6:40 AM
Hooker 60 mph 3:45 AM
-****-
For the record, there have been 24 severe wind gusts (57 mph or more) during the
last 12 hours, and 249 wind gusts greater of 50 mph or more over that same
time frame. That's through 8:29 a.m.
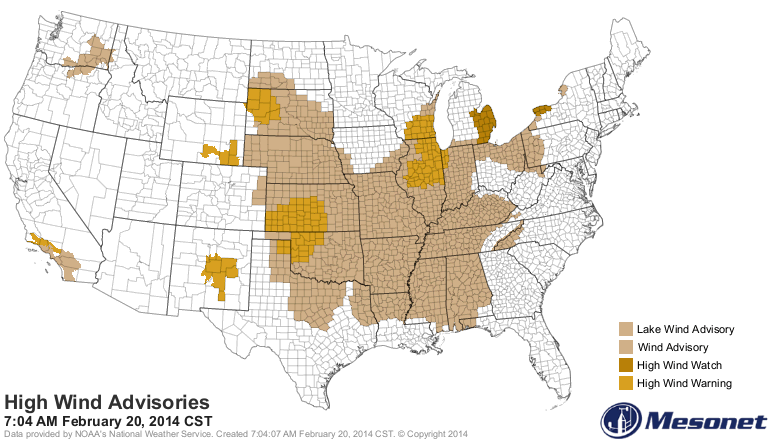
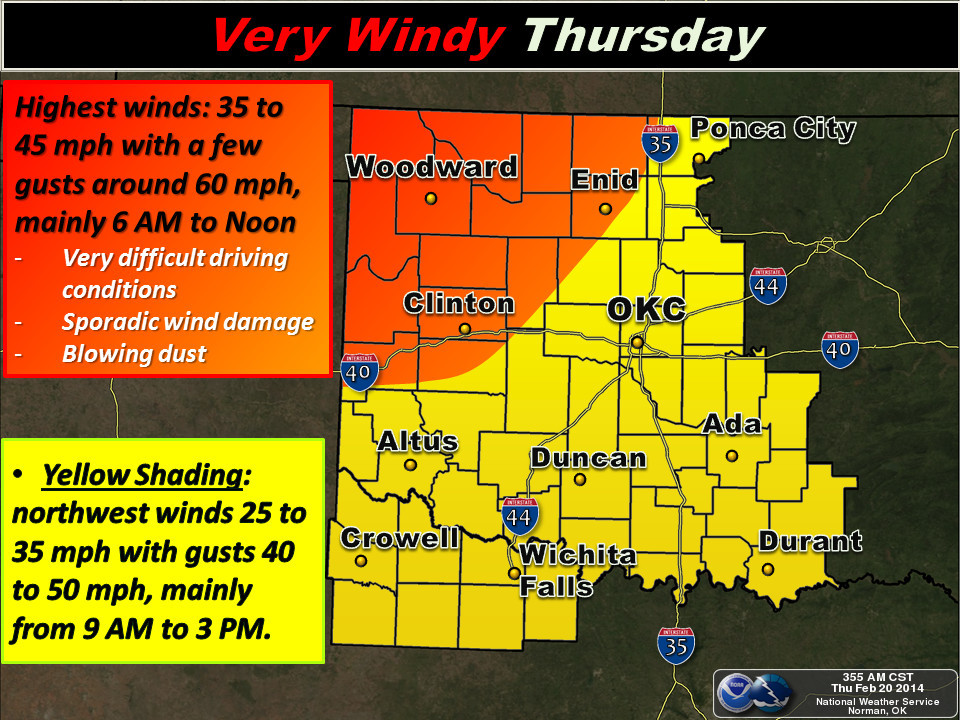
Most of the state is covered by some sort of wind warning or advisory for this
morning through evening. We have a high wind warning for northwestern Oklahoma
for winds of 35-45 mph, gusting to 60 mph. Then most of the rest of the state
is under a wind advisory for winds of 25-35 mph, gusting to 40-50 mph. Here's a
look at a windy day across the entire middle of the country, basically.
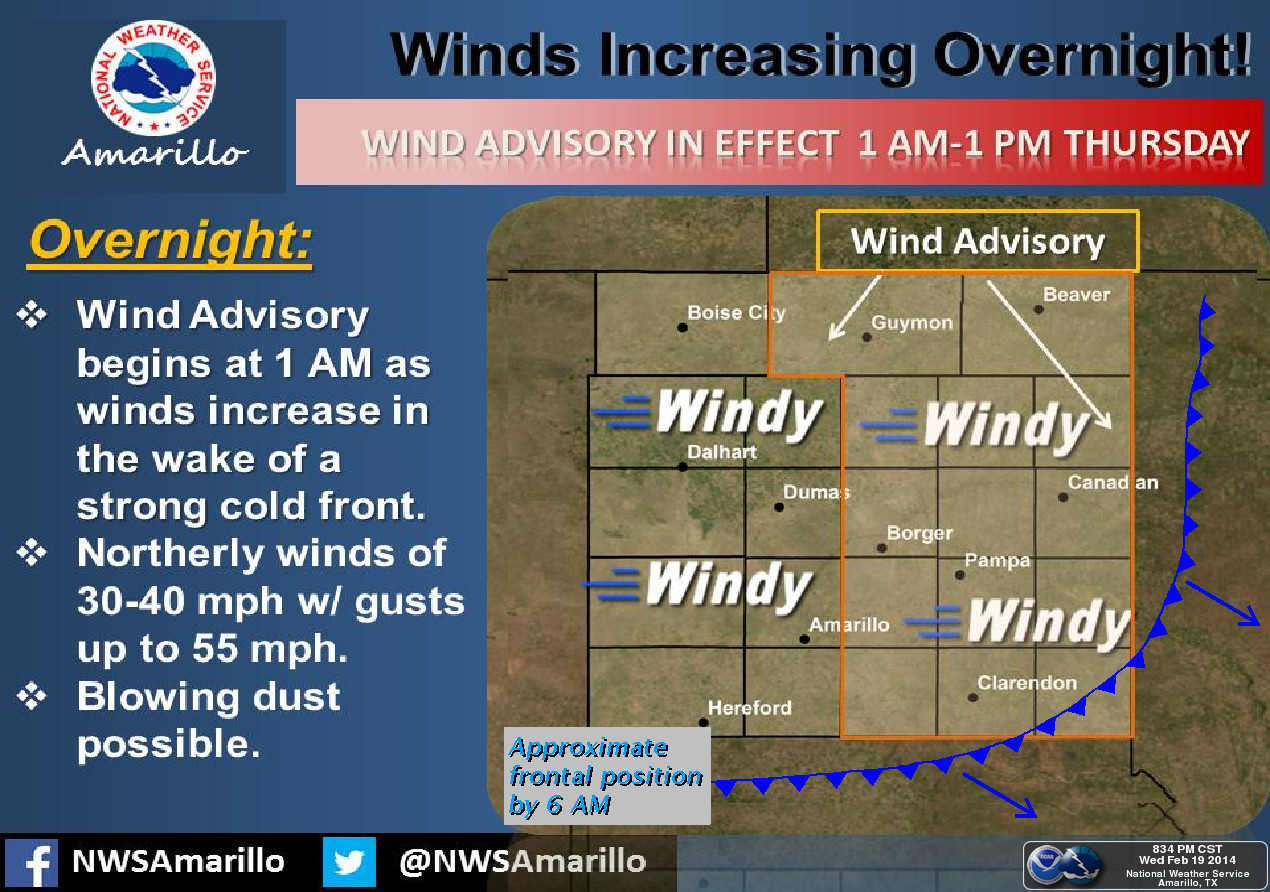
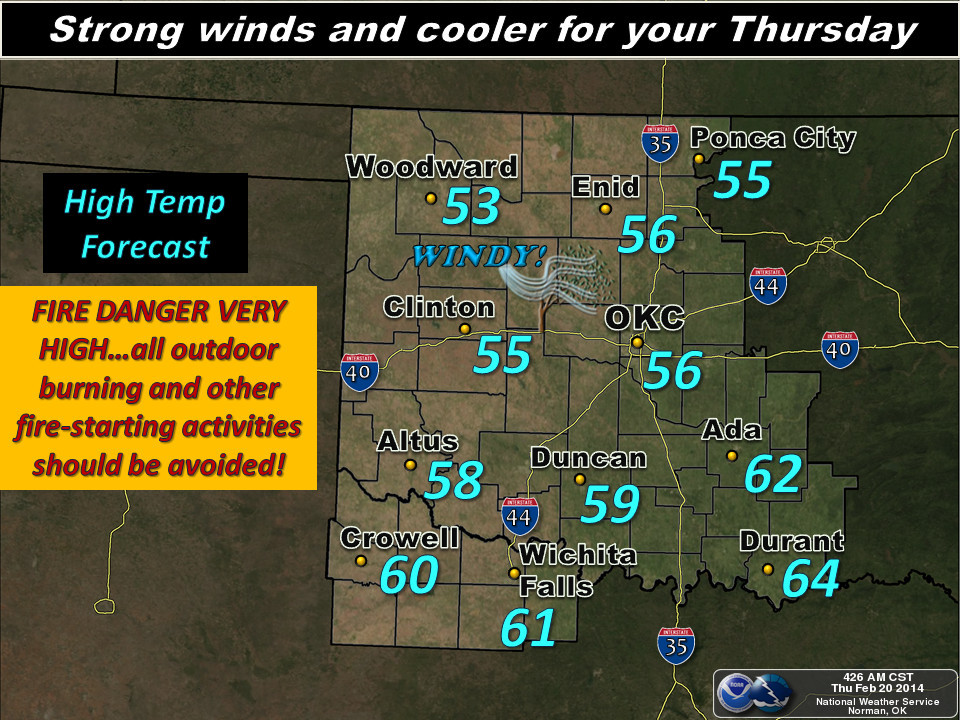
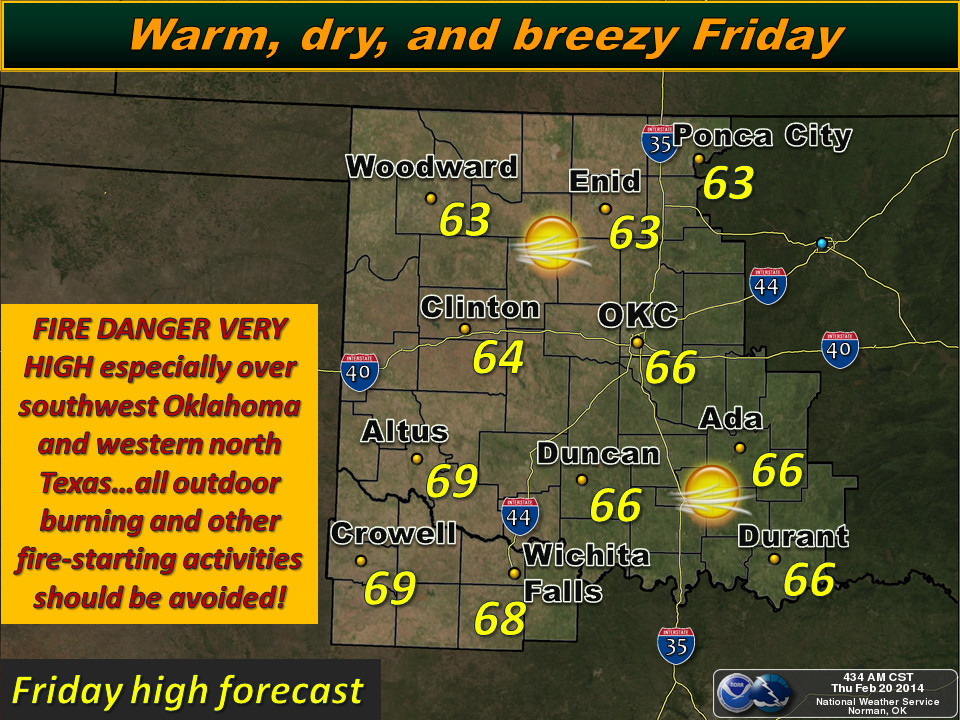
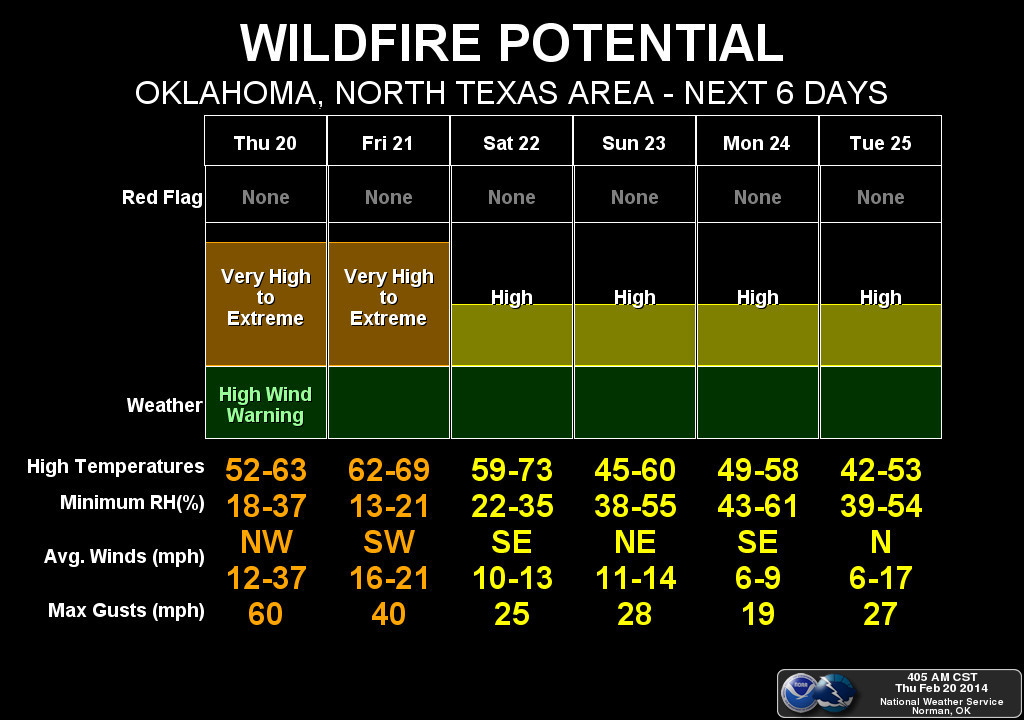
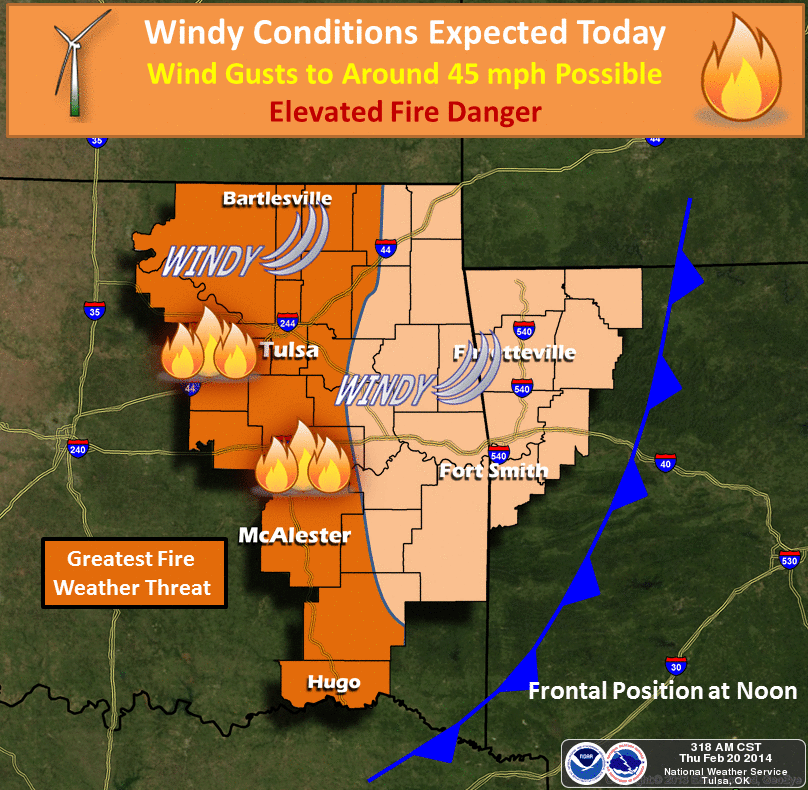
Here's how the NWS sees it, with graphics from our local offices spelling out
the winds and the fire danger.
Now all this wind comes on top of a worsening drought situation across much of
Oklahoma, doing further damage to crops and topsoil moisture. The newest U.S.
Drought Monitor map released this morning shows yet another spread of Abnormally
Dry (D0) drought conditions across the state.
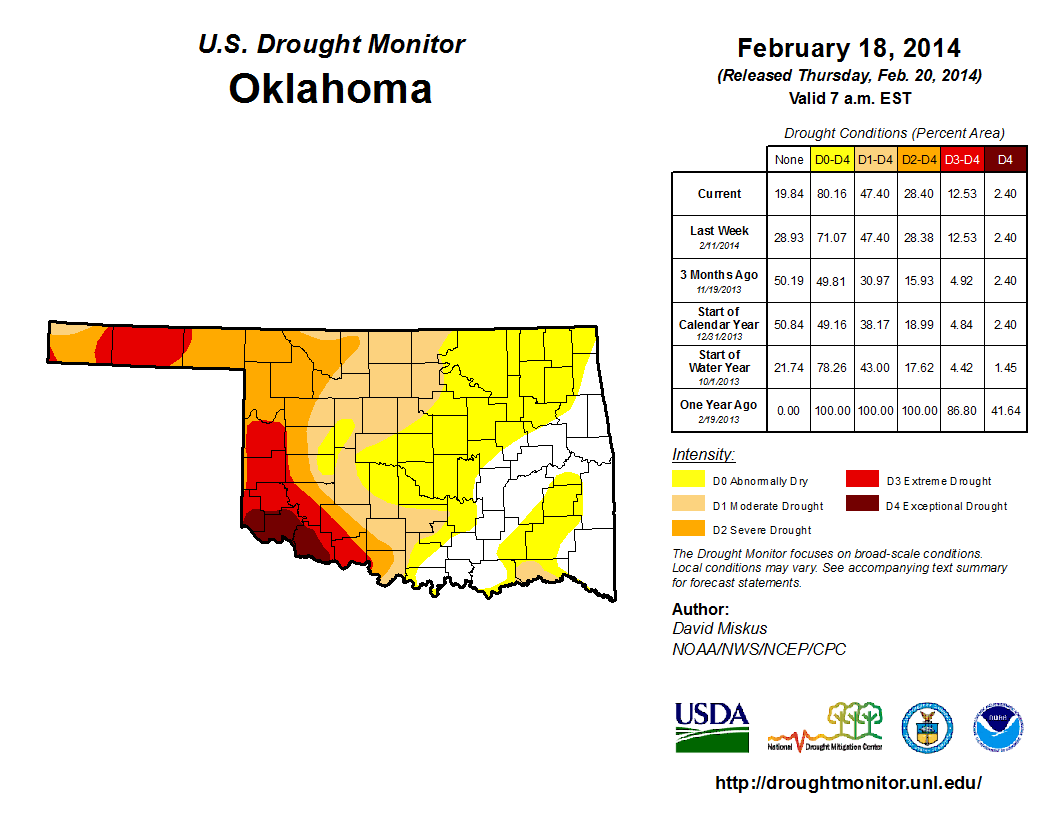
The total of *actual* drought (D1-D4) stayed the same at 47.4%, but the coverage
of at least D0 designation jumped from 71.07% to 80.16 percent. It's a rather
ominous message to receive during the cool season as that same statistic was
49.81% three months ago (11/19/2013). Drought (D1-D4) covered 30.97% of the
state at that same time. Why? Well, just take a look at the last 90 days. Pay
particular attention to the radar-gauge estimates from the RFC in Tulsa.
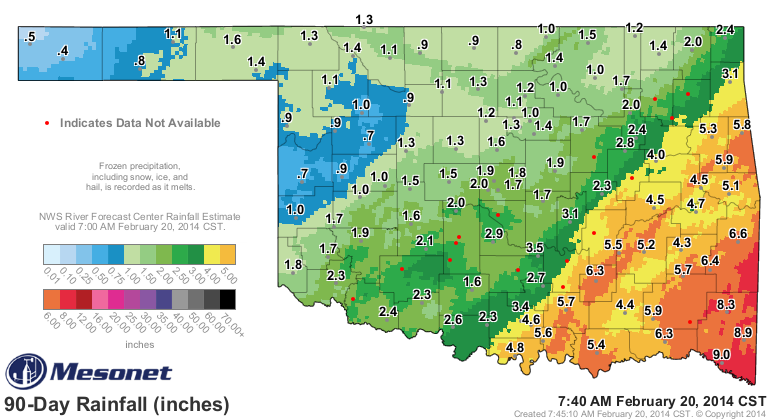
Some of those colors look like we've been in a deluge, but you get northwest of
the yellers and oranges and reds and you're talking puny amounts, as this
percent of normal map for the same period shows.
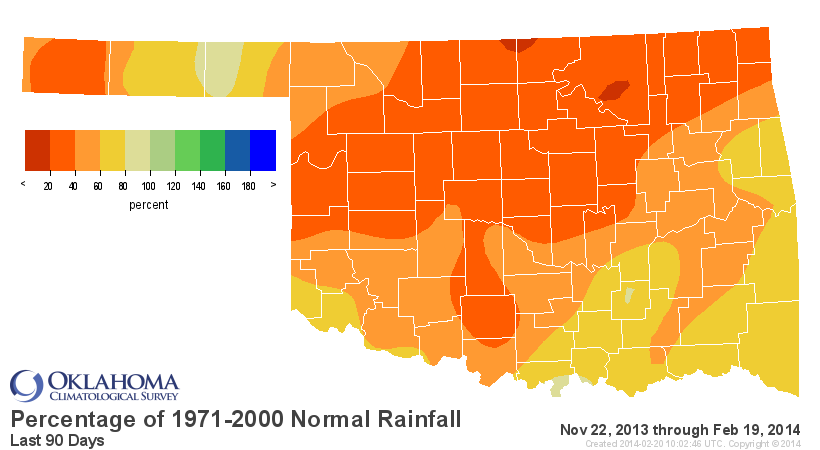
Even in the aforementioned areas in the southeast are actually running a deficit
over the last 90 days. Combine that with the dry windy weather of January and
recently and that's precisely why you get the increase in D0, a precursor to
drought development. By the way, the statewide average total of 2.62" over the
last 90 days is the 7th driest since 1921, 2.89" below normal. For north central
(1.07", 2.61" below normal) and the northeast (2.02", 4.26" below normal), it's
their 5th- and 2nd-driest such periods back to 1921, respectively.
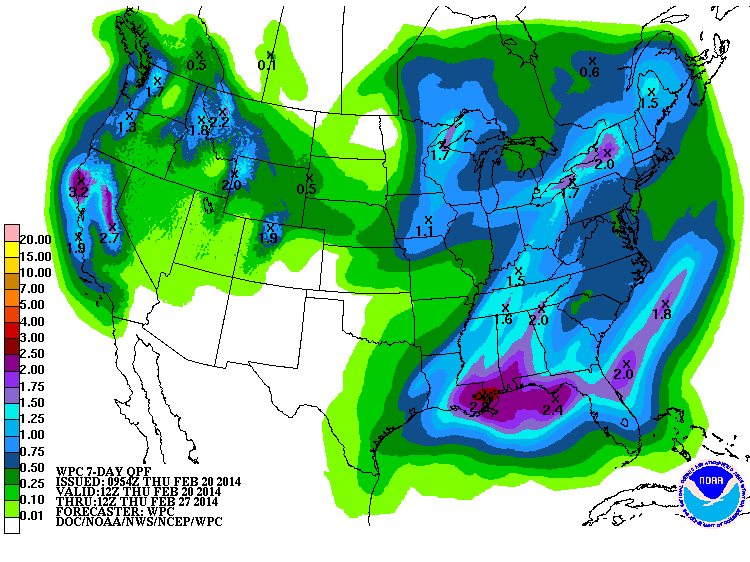
How about a look into the future? Here's what the moisture totals look like
for the next 7 days (I'll pause while you dry your tears ... better yet, save
'em! You might need that moisture!).
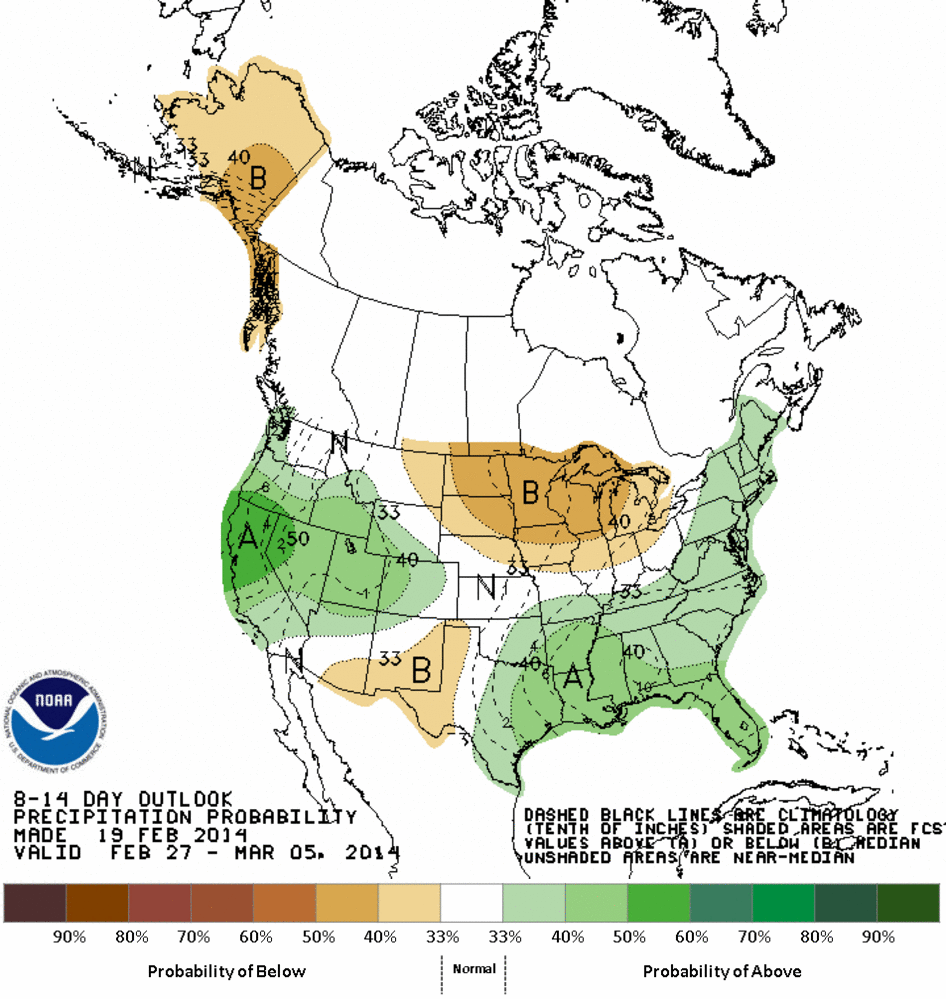
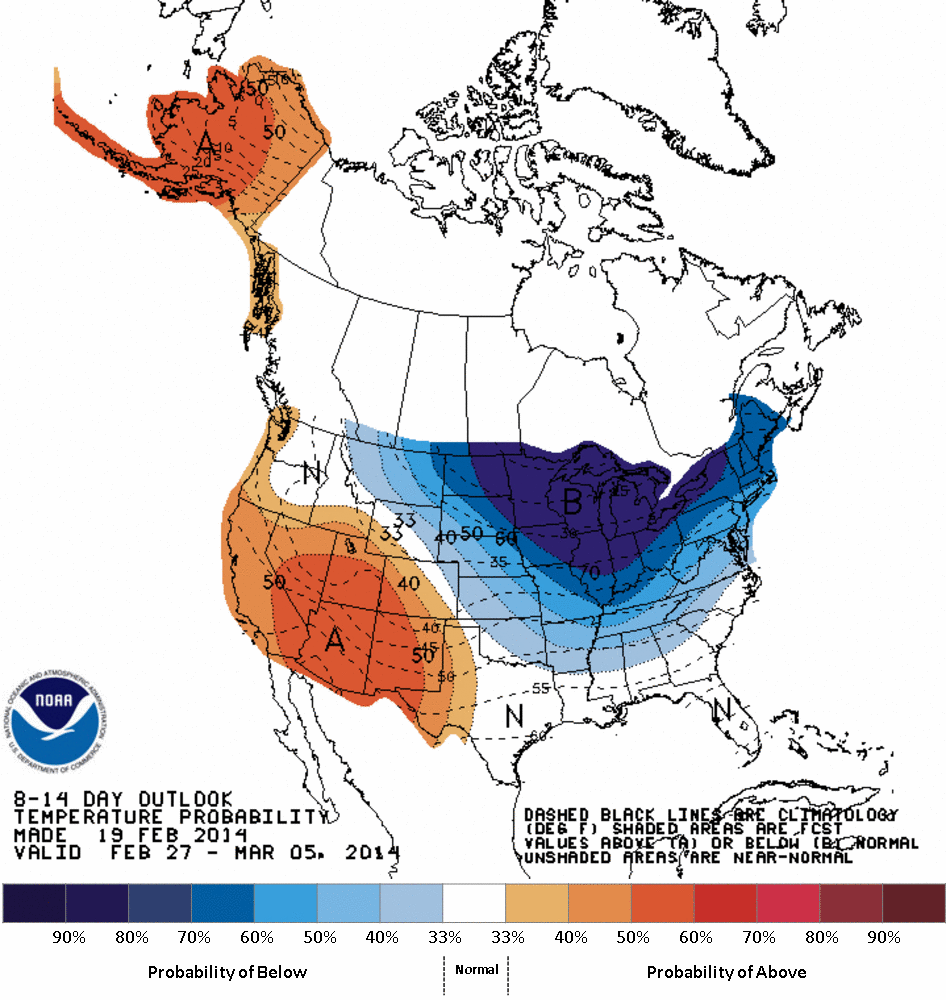
The CPC's 8-14 day outlooks they issued yesterday afternoon at least give us
hope with increased odds of above normal precip across the SE part of the state.
Normal is indicated across much of the rest of Oklahoma. This is for the Feb.
27-March 5 period. Unfortunately, it also appears we will be in the no man's land
between that ridge in the west and trough in the east. To me, that signals more
dry cold fronts. Only time till tell, of course.
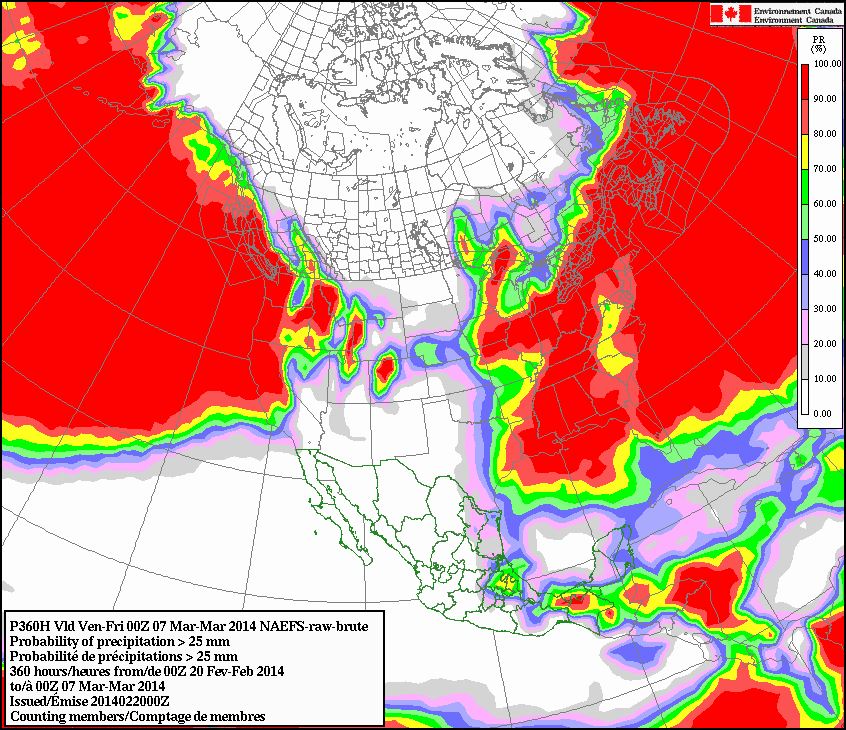
The Canadian forecast model remains bullish on its dry signal, with very low
probabilities of accumulating at least 4/10ths of an inch across most of western
Oklahoma through March 7.
We get no help from their March and March-May outlooks, with Oklahoma dominated
by the "EC" (Equal Chances) signal, meaning CPC forecasters think Oklahoma has
equal odds of above-, below- or near-normal precip and temperatures.
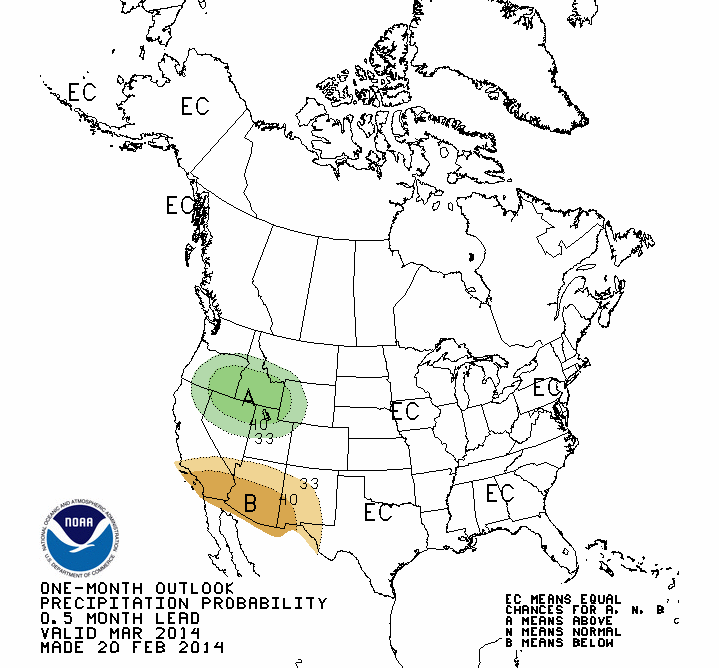
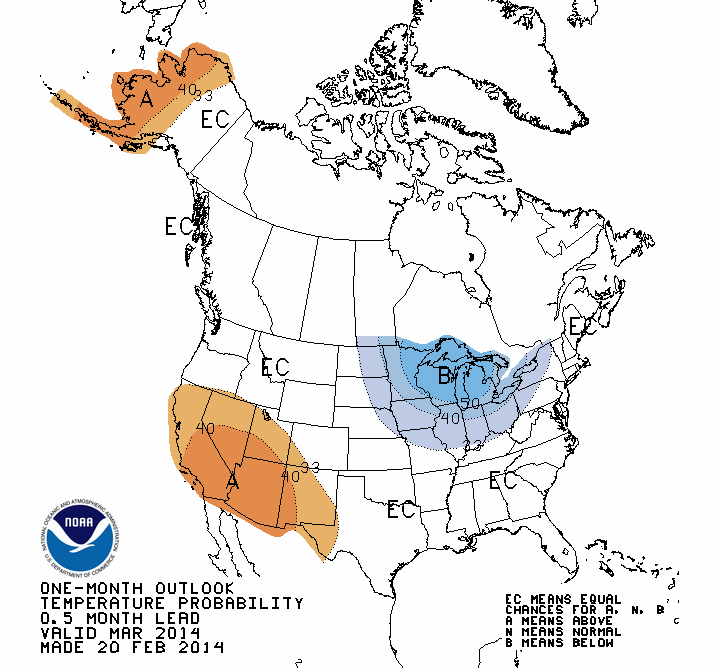
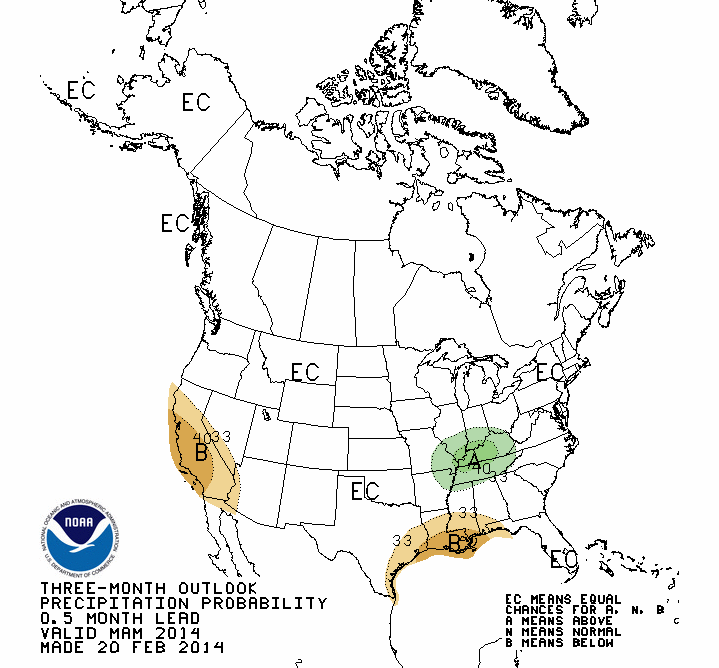
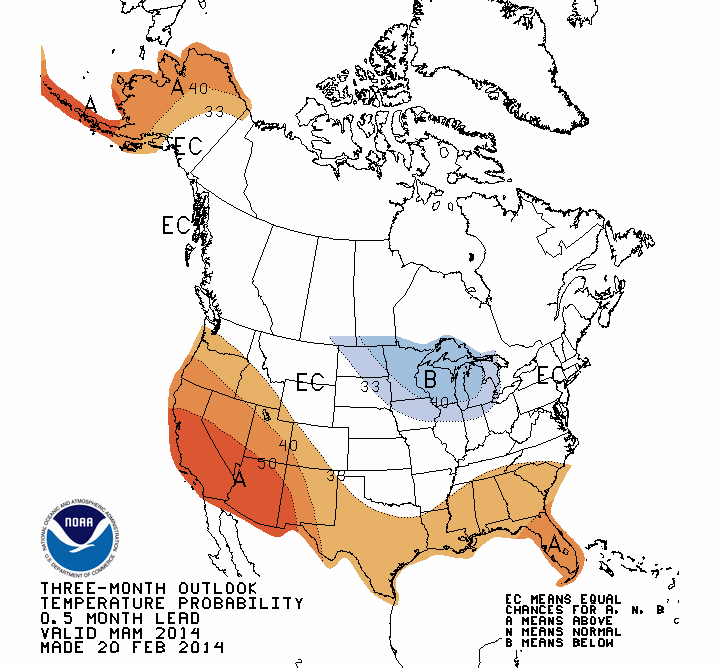
In football terms, that's a punt. None of the forecast tools CPC uses to
formulate those outlooks showed a significant enough signal to tip the odds in
any category's favor.
Finally some good news! With the absence of any dry signal over the next three
months, just looking at climatology we see our rainy season approaching in a
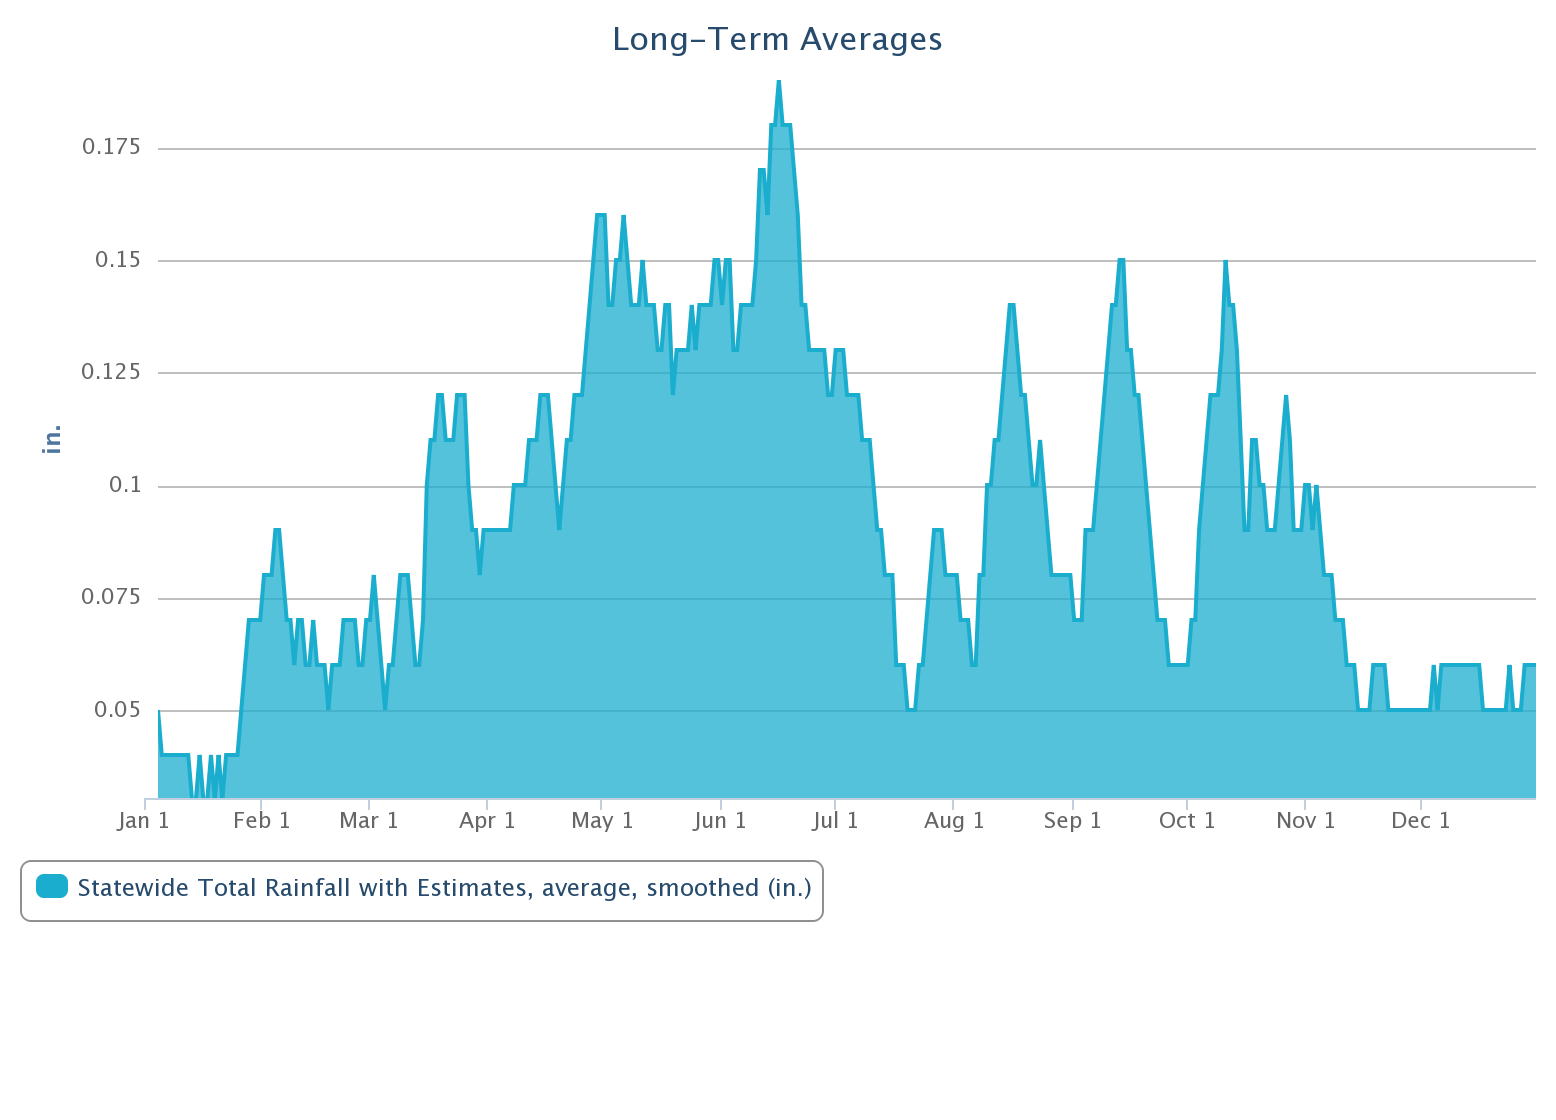
couple of months. Check out the long-term (1999-2013) statewide average rainfall
from the Mesonet and you can see how our moisture *normally* increases from
here and peaks sometime in June before falling off the cliff directly thereafter.
Given that climatology, and what our current drought situation looks like, this
is what CPC sees for drought prospects for the next three months (through May).
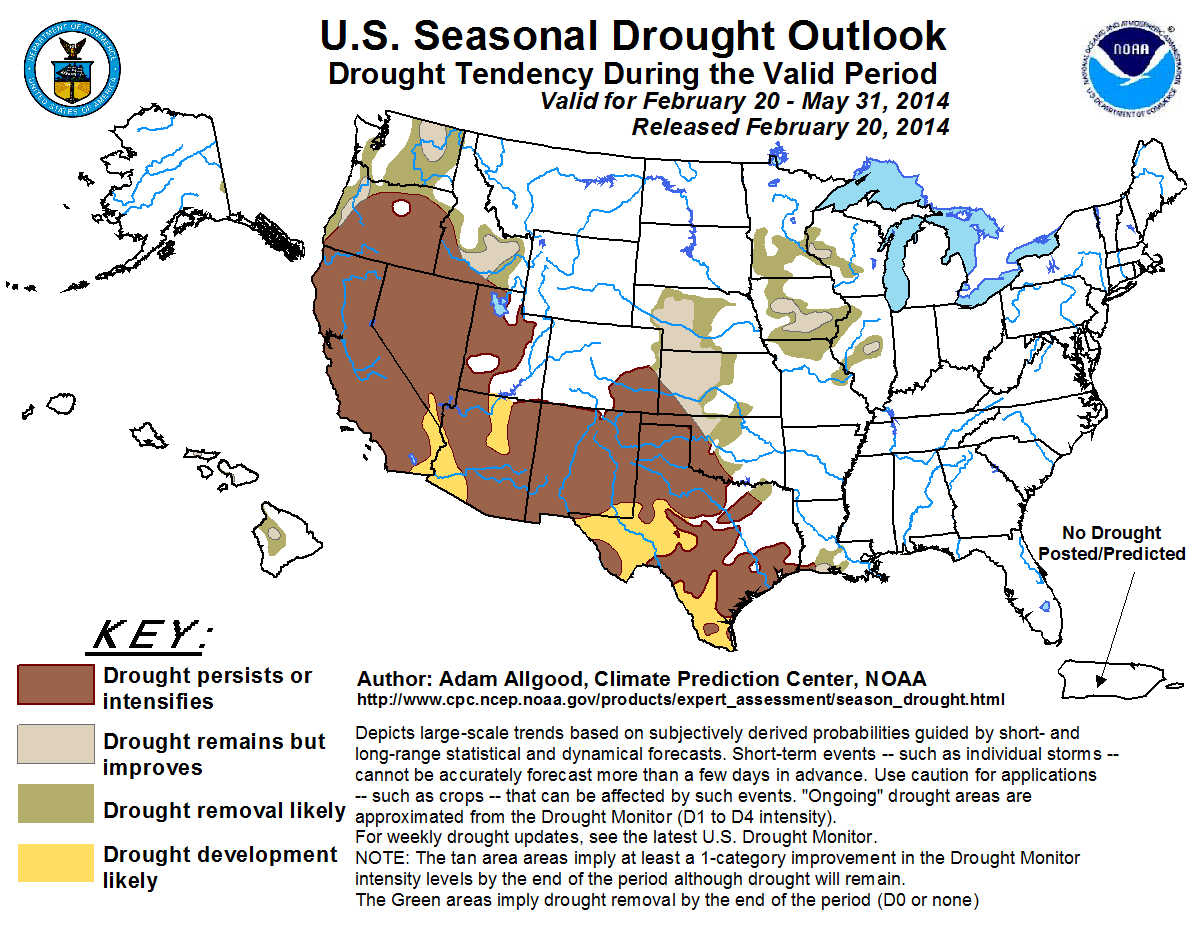
Unfortunately, they see drought persisting or intensifying from SW OK up through
the Panhandle. To the east of there, however, they see areas of improvement to
areas of removal.
There is a hint of an El Nino developing this summer and then extending into
next fall. That would be wonderful, of course, since El Ninos tend to bring
the southern tier of the U.S. (including Oklahoma) wetter and cooler than
normal weather during the cool season (they really don't have much of an impact
for our area during other parts of the year). One federal drought expert has
said that El Ninos are more effective at ending droughts than La Ninas are in
starting them, so that would be key for western Oklahoma. Let's hope they get
plenty of moisture before then, however. We'll worry about next fall and winter
when we get the chance.
Gary McManus
State Climatologist
Oklahoma Climatological Survey
(405) 325-2253
gmcmanus@mesonet.org
February 20 in Mesonet History
| Record | Value | Station | Year |
|---|---|---|---|
| Maximum Temperature | 86°F | ALTU | 2016 |
| Minimum Temperature | 4°F | KENT | 2006 |
| Maximum Rainfall | 4.01″ | SALL | 1997 |
Mesonet records begin in 1994.
Search by Date
If you're a bit off, don't worry, because just like horseshoes, “almost” counts on the Ticker website!