Ticker for August 29, 2013
MESONET TICKER ... MESONET TICKER ... MESONET TICKER ... MESONET TICKER ...
August 29, 2013 August 29, 2013 August 29, 2013 August 29, 2013
A bit of a slide
Rainfall statistics can be awfully deceiving. For instance, check out these three
periods and what they tell you.
First, there's the rainfall since July 9, the point I like to think our summer
rainy season began in earnest (and Oklahoma).
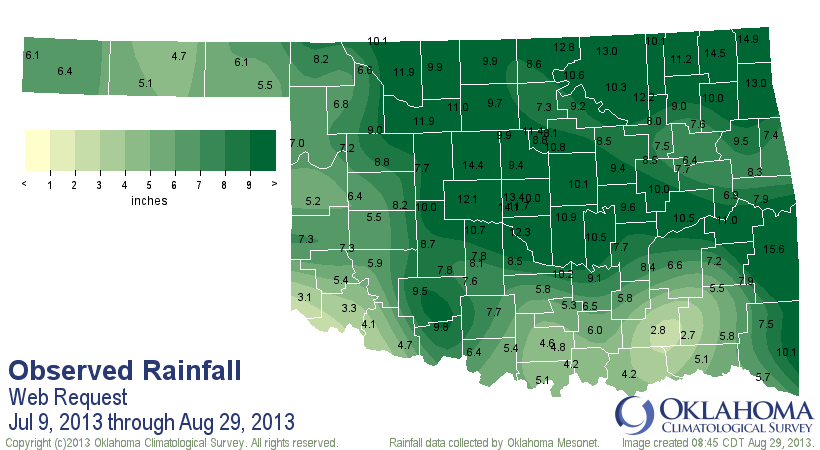
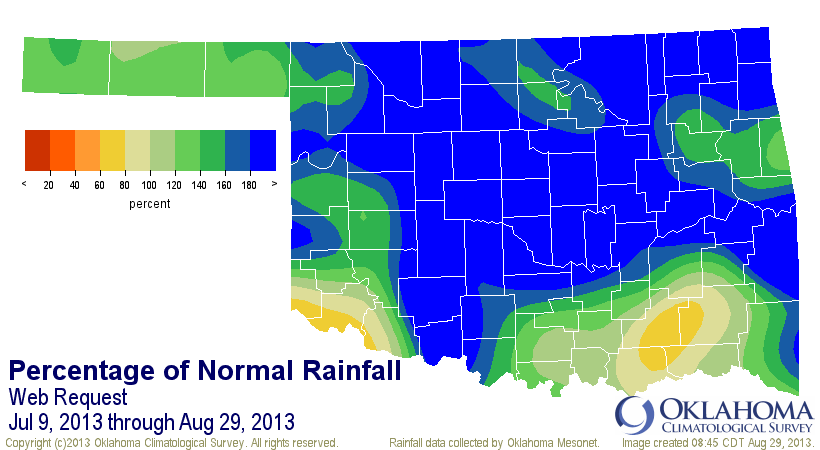
Schweeet! Lots of blues and greens on that map, signifying totals since July 9 of
about 120-200% of normal. Wow, everything is going great! The statewide average
of 8.13" is about 3.53" above normal, the 4th wettest July 9-August 29 since 1921.
Only a few trouble spots showing up there, the far southwest and down in the
southeast.
Now let's check out August thus far, so August 1-29.
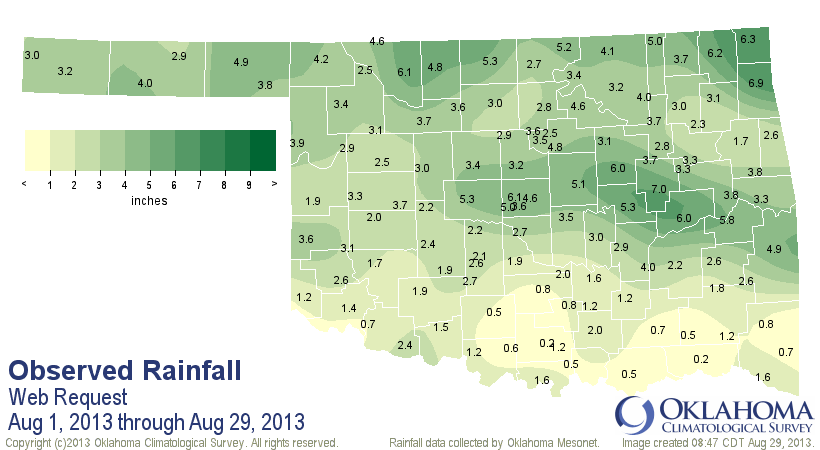
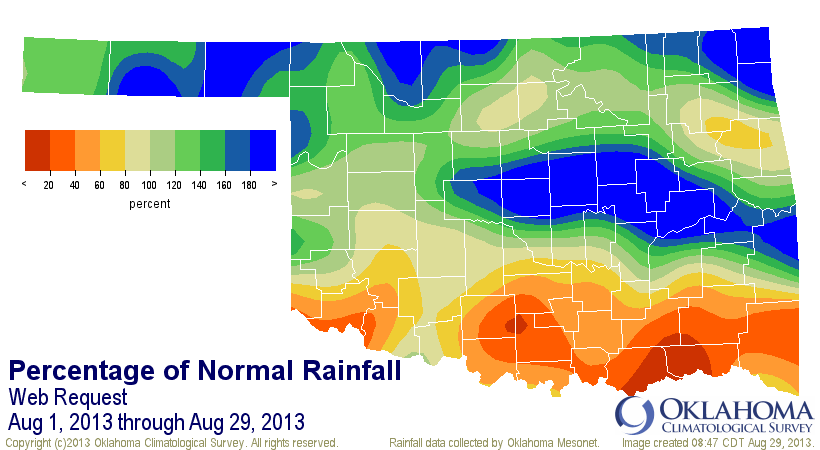
Well, not too bad if you live across the northern half of the state (in general).
Lots of trouble down south, and the statewide average looks good at 3.03", about
0.5" above normal, the 30th wettest August 1-29 since 1921. Still that is
deceiving. The southern half-to-third of the state is not looking so great
there.
Now let's just look at when the rains went away during August, so basically
August 18-29. Avert your eyes, this is going to be ugly (same thing I do
every morning when I approach the mirror).
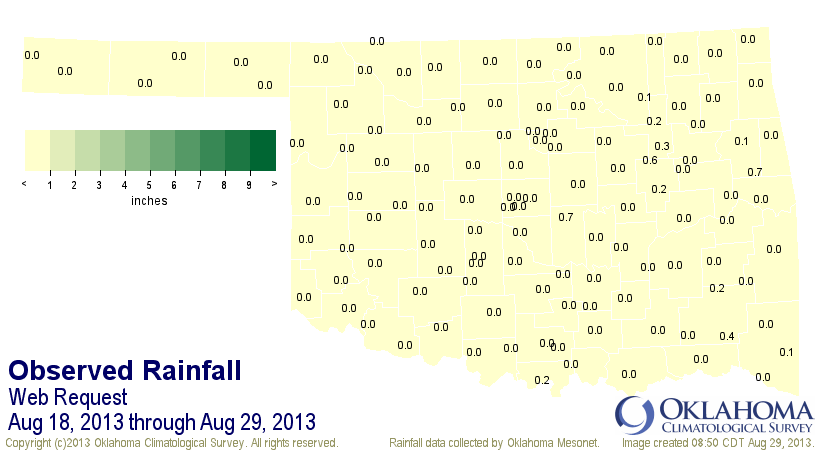
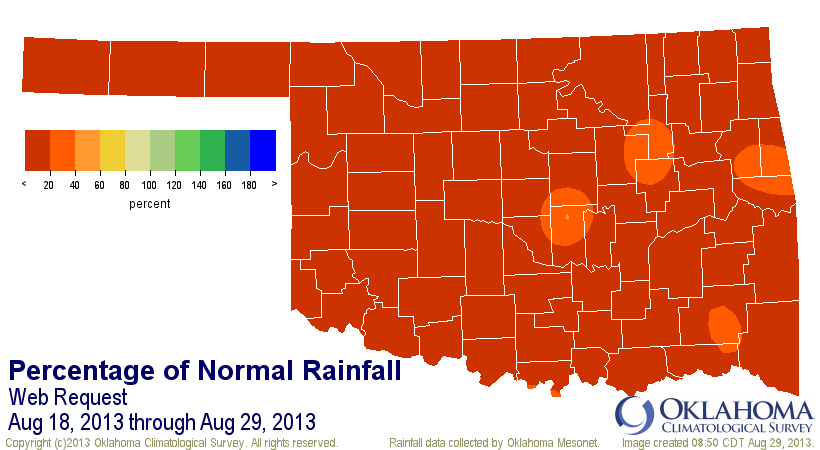
Yeah, ouch. Lots of zeroes on that totals map, and obviously an almost totally
red percentage map. The statewide average amounts to a whopping 0.03", 1.04"
below normal and THE driest August 18-29 since 1921. Now that's less significant
since we're just talking 12 days, but it definitely shows just how lucky we
were to have gotten all of that rain previously this summer.
This also shows up on the "days since" rainfall maps from the Mesonet.
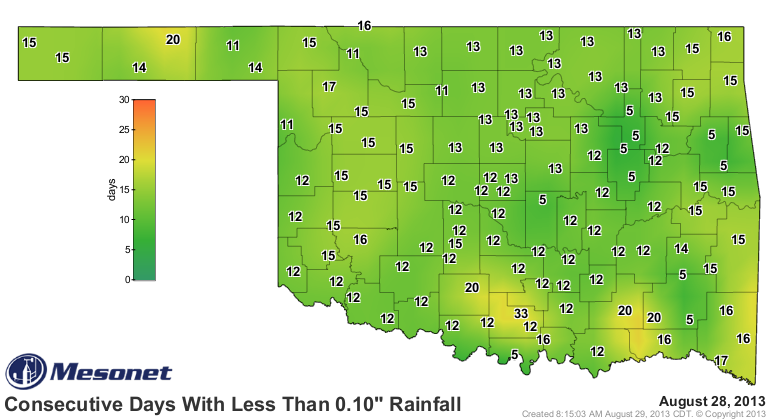
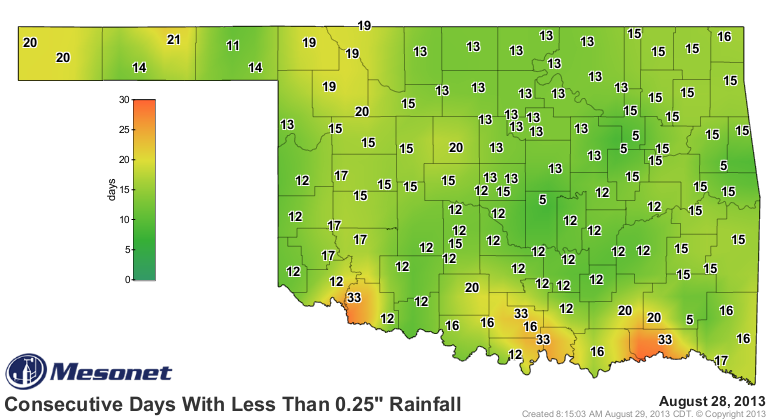
What's all that add up to? Well, it adds up to a slowly but surely worsening
U.S. Drought Monitor map.
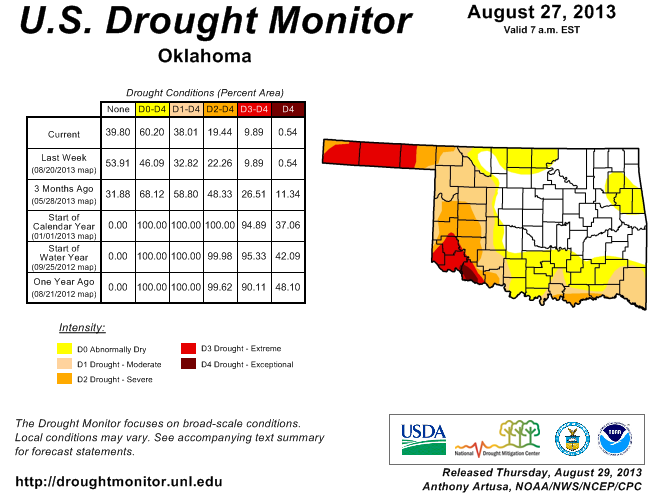
Our drought-free eastern two-thirds has now become sorta fuzzy around the edges,
with moderate drought now becoming more prevalent across the southern edges of
the state, and even severe drought making its way back into Marshall, Bryan
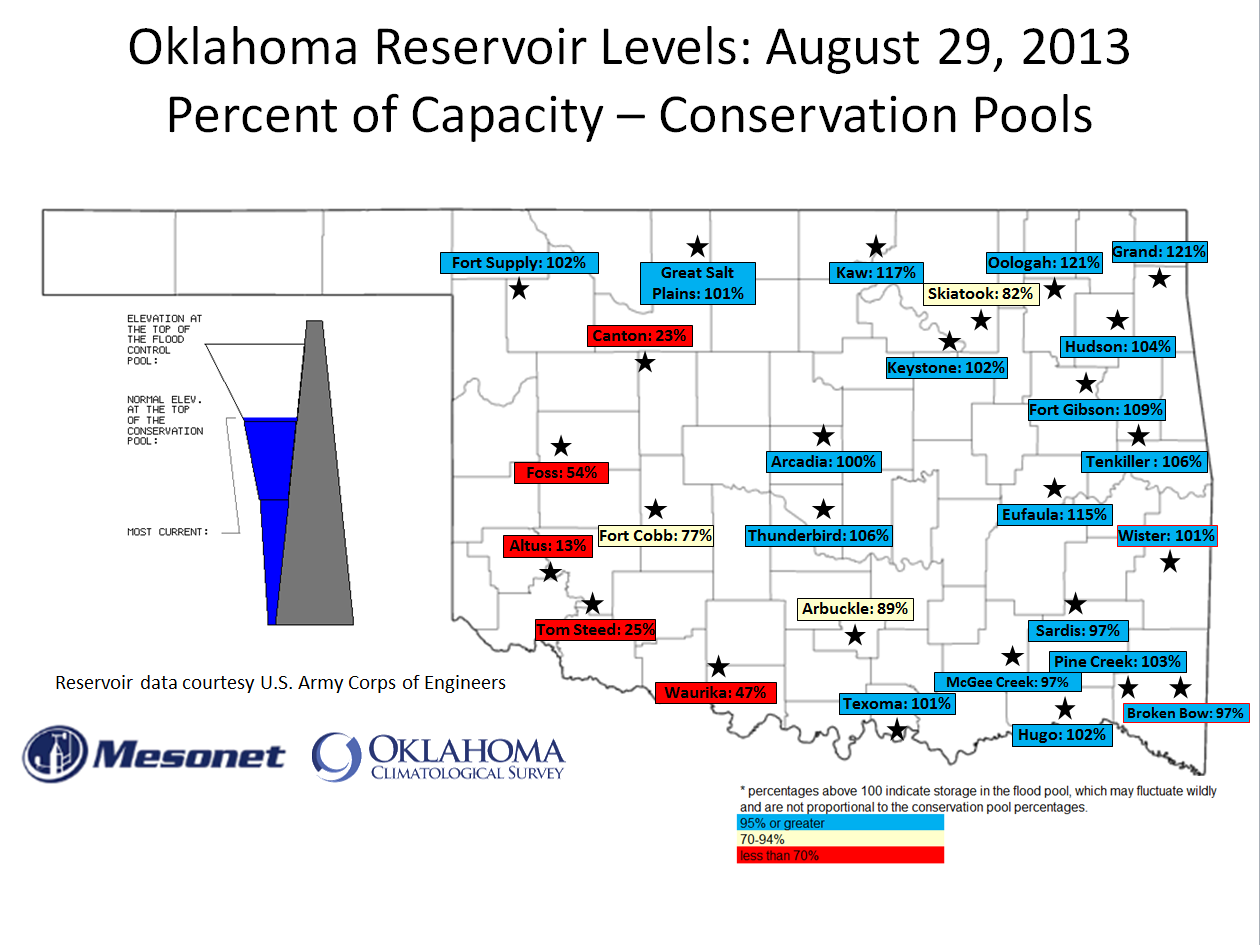
and Choctaw counties. This is more of a flash drought situation right now. The
lakes down there are still doing pretty well, so no long-term impacts just
yet. Those are reserved for western Oklahoma, where a few lakes are down so low
you have quite a hike from the shore to the water.
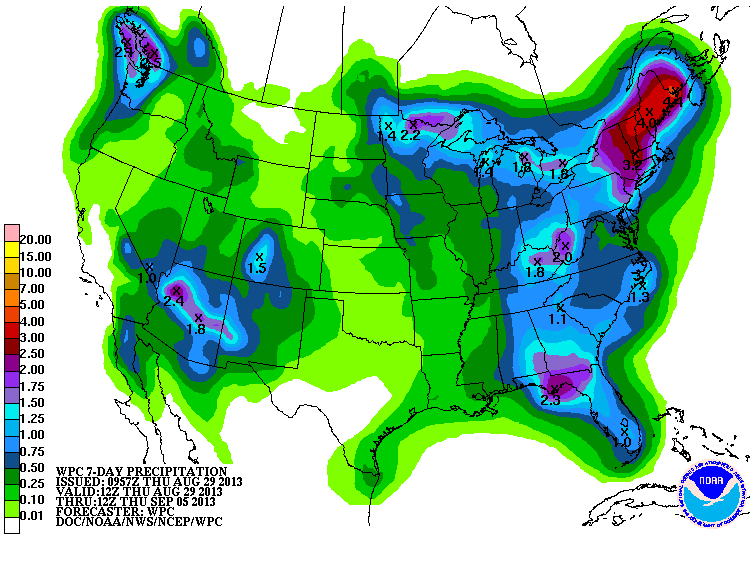
At least the 7-day rainfall forecast has some green back in the state.
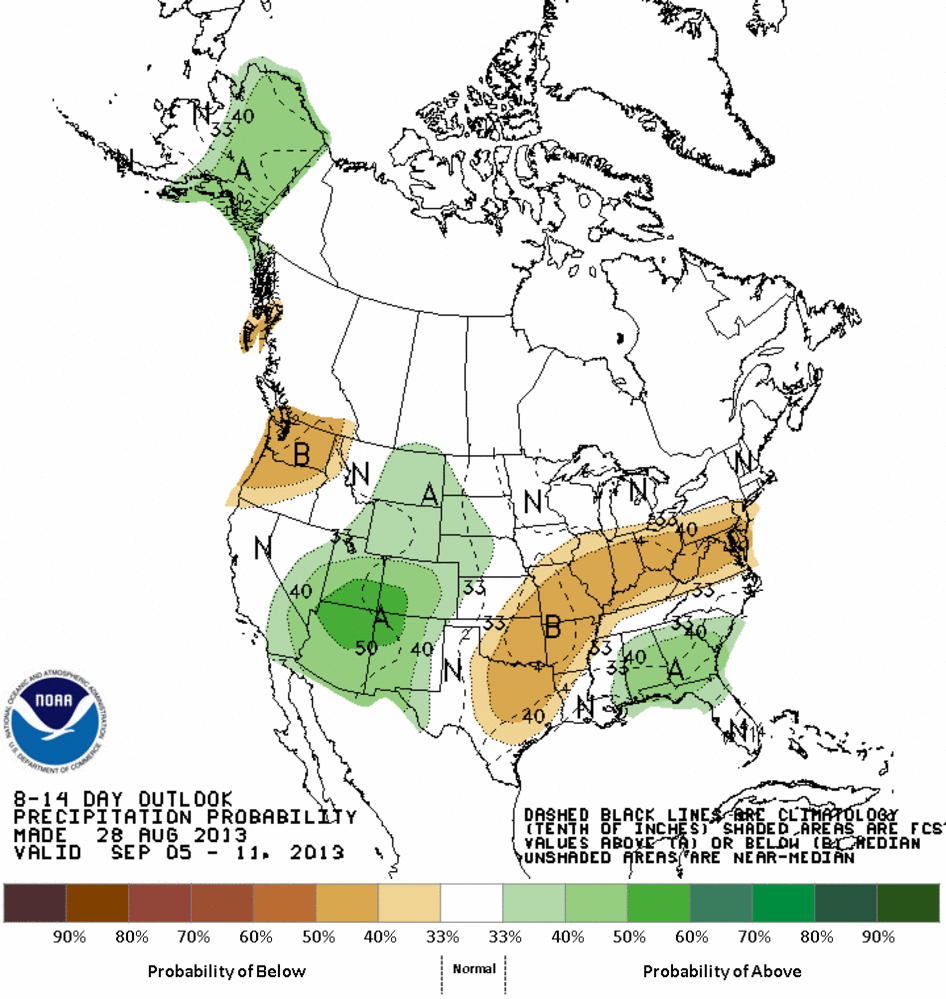
The outlooks from CPC for the September 5-11 time frame could be better, but at
least western Oklahoma sees odds for normal precipitation (which ain't much this
time of year).
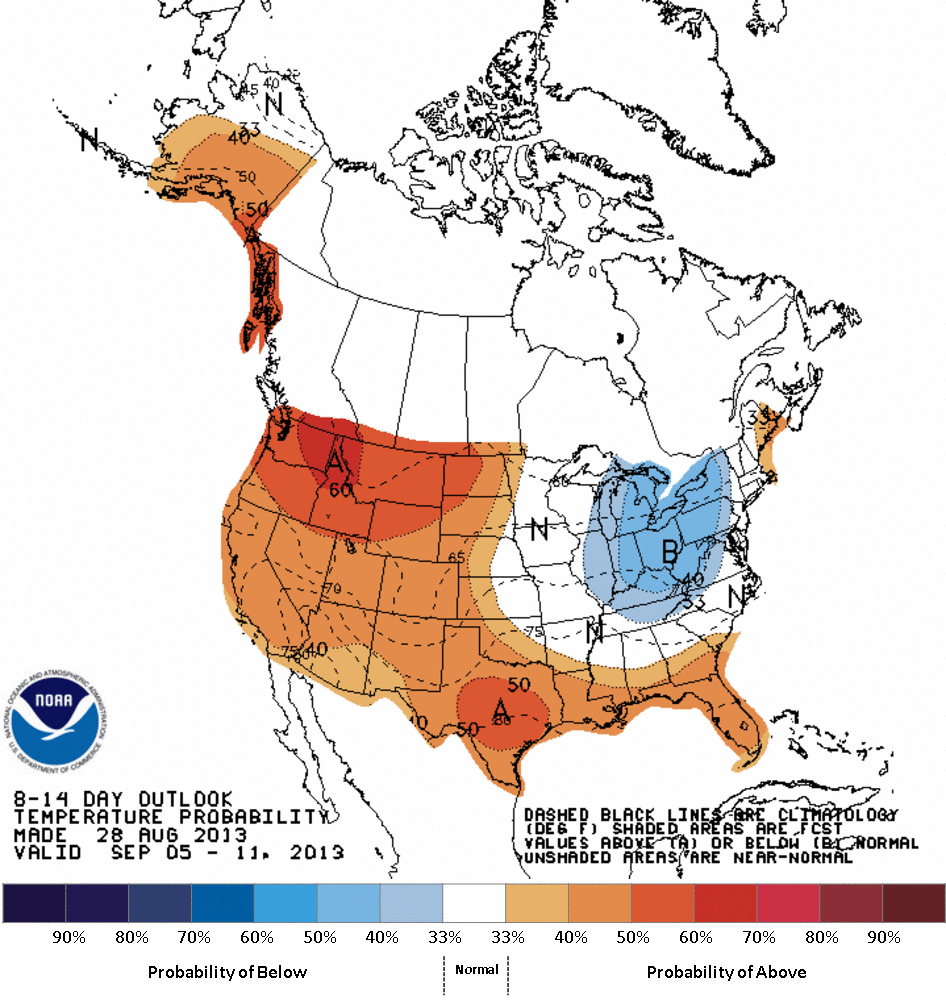
Now it is going to get hot for the next few days, and rainfall looks sparse for
awhile. Reason to panic? Not at all. August, summer ... you know the drill. But
we really do need to be grateful for all that rain from July 9-August 17. For
many in the state, it adverted another summertime flash drought disaster.
Gary McManus
Associate State Climatologist
Oklahoma Climatological Survey
(405) 325-2253
gmcmanus@mesonet.org
August 29 in Mesonet History
| Record | Value | Station | Year |
|---|---|---|---|
| Maximum Temperature | 109°F | WAUR | 2011 |
| Minimum Temperature | 48°F | EVAX | 2017 |
| Maximum Rainfall | 5.06″ | VINI | 2003 |
Mesonet records begin in 1994.
Search by Date
If you're a bit off, don't worry, because just like horseshoes, “almost” counts on the Ticker website!