Ticker for July 30, 2013
MESONET TICKER ... MESONET TICKER ... MESONET TICKER ... MESONET TICKER ...
July 30, 2013 July 30, 2013 July 30, 2013 July 30, 2013
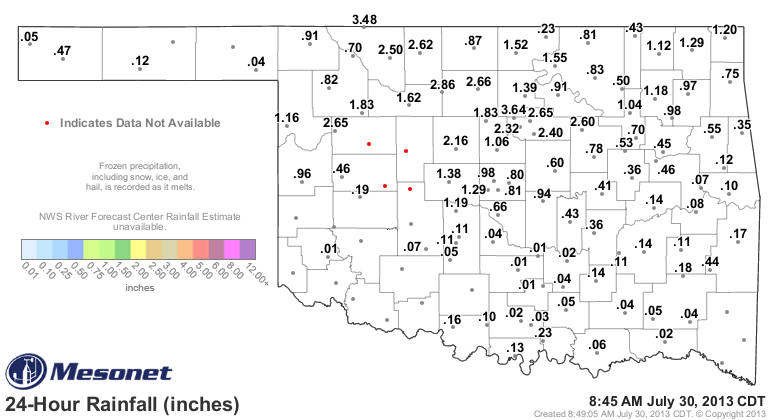
Another night, another round of storms
More late-night antics from Mother Nature brought another round of heavy rains
for much of north central through central Oklahoma. Check out the rainfall
map from the last 24 hours to see the totals (sorry, the radar-based estimates
are not available at this time).
That rain boosts the statewide total for July up to 5.1 inches, 2.4 inches above
normal, according to Mesonet data. That would rank this July as the 17th wettest
on record. Interesting that four of the top 20 wettest Julys will have occurred
within the last 10 years. Here's the top-20, including the possible July 2013
total.
-***-
1950 9.26 1961 5.34
1959 6.61 1927 5.25
1899 6.15 1958 5.15
1960 5.97 2004 5.12
1996 5.90 2013 5.09
1953 5.84 2007 4.74
1895 5.67 2010 4.60
1905 5.59 1898 4.52
1911 5.43 1994 4.52
1906 5.34 1979 4.34
-****-
2004, 2007, 2010 and now 2013 have all been fairly wet. Here's a look at the
maps (updated once again for last night's rains) for July 1-30:
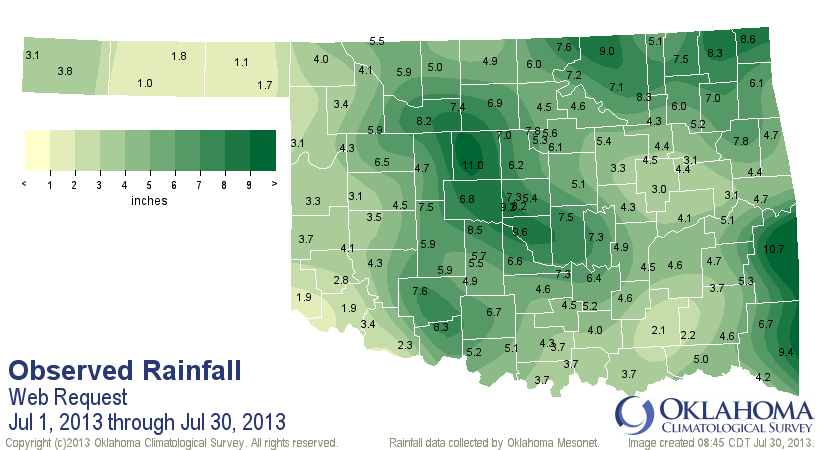

The Panhandle and far southwestern Oklahoma continue to miss out on the good
moisture, signalling more significant drought for those areas.
Oklahoma City added another 1.12 inches from the storms, it appears, bringing
their yearly total up to 41.59 inches. That's easily the wettest January 1-July
30 in OKC history, putting more distance between this year's period and the same
period in 2007 (38.15 inches). So OKC now sets its sights on having its wettest
year on record, also held by 2007 (56.95 inches). Another 15 inches or so and
2013 will be the wettest year on record in OKC, and there will probably be
an ark being built somewhere near downtown. Here's a graph comparing the
accumulations so far this year versus other years (last night's rain not
included in this graph).
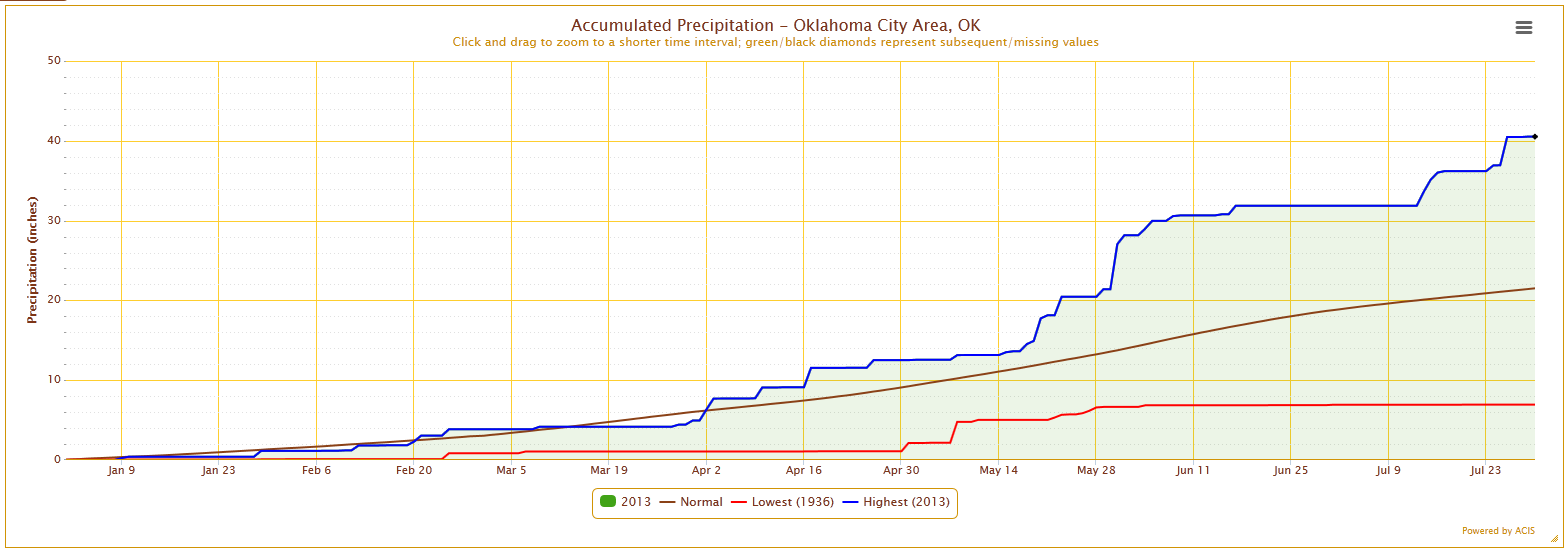
The blue line indicates this year's totals (again, through July 29) and the red
line is the lowest total through July 29, belonging to January 1-July 29, 1936
(a paltry 6.94 inches for that period). Brown is the normal accumulation.
For contrast, check out What's going on in the Panhandle. We'll look at Goodwell.
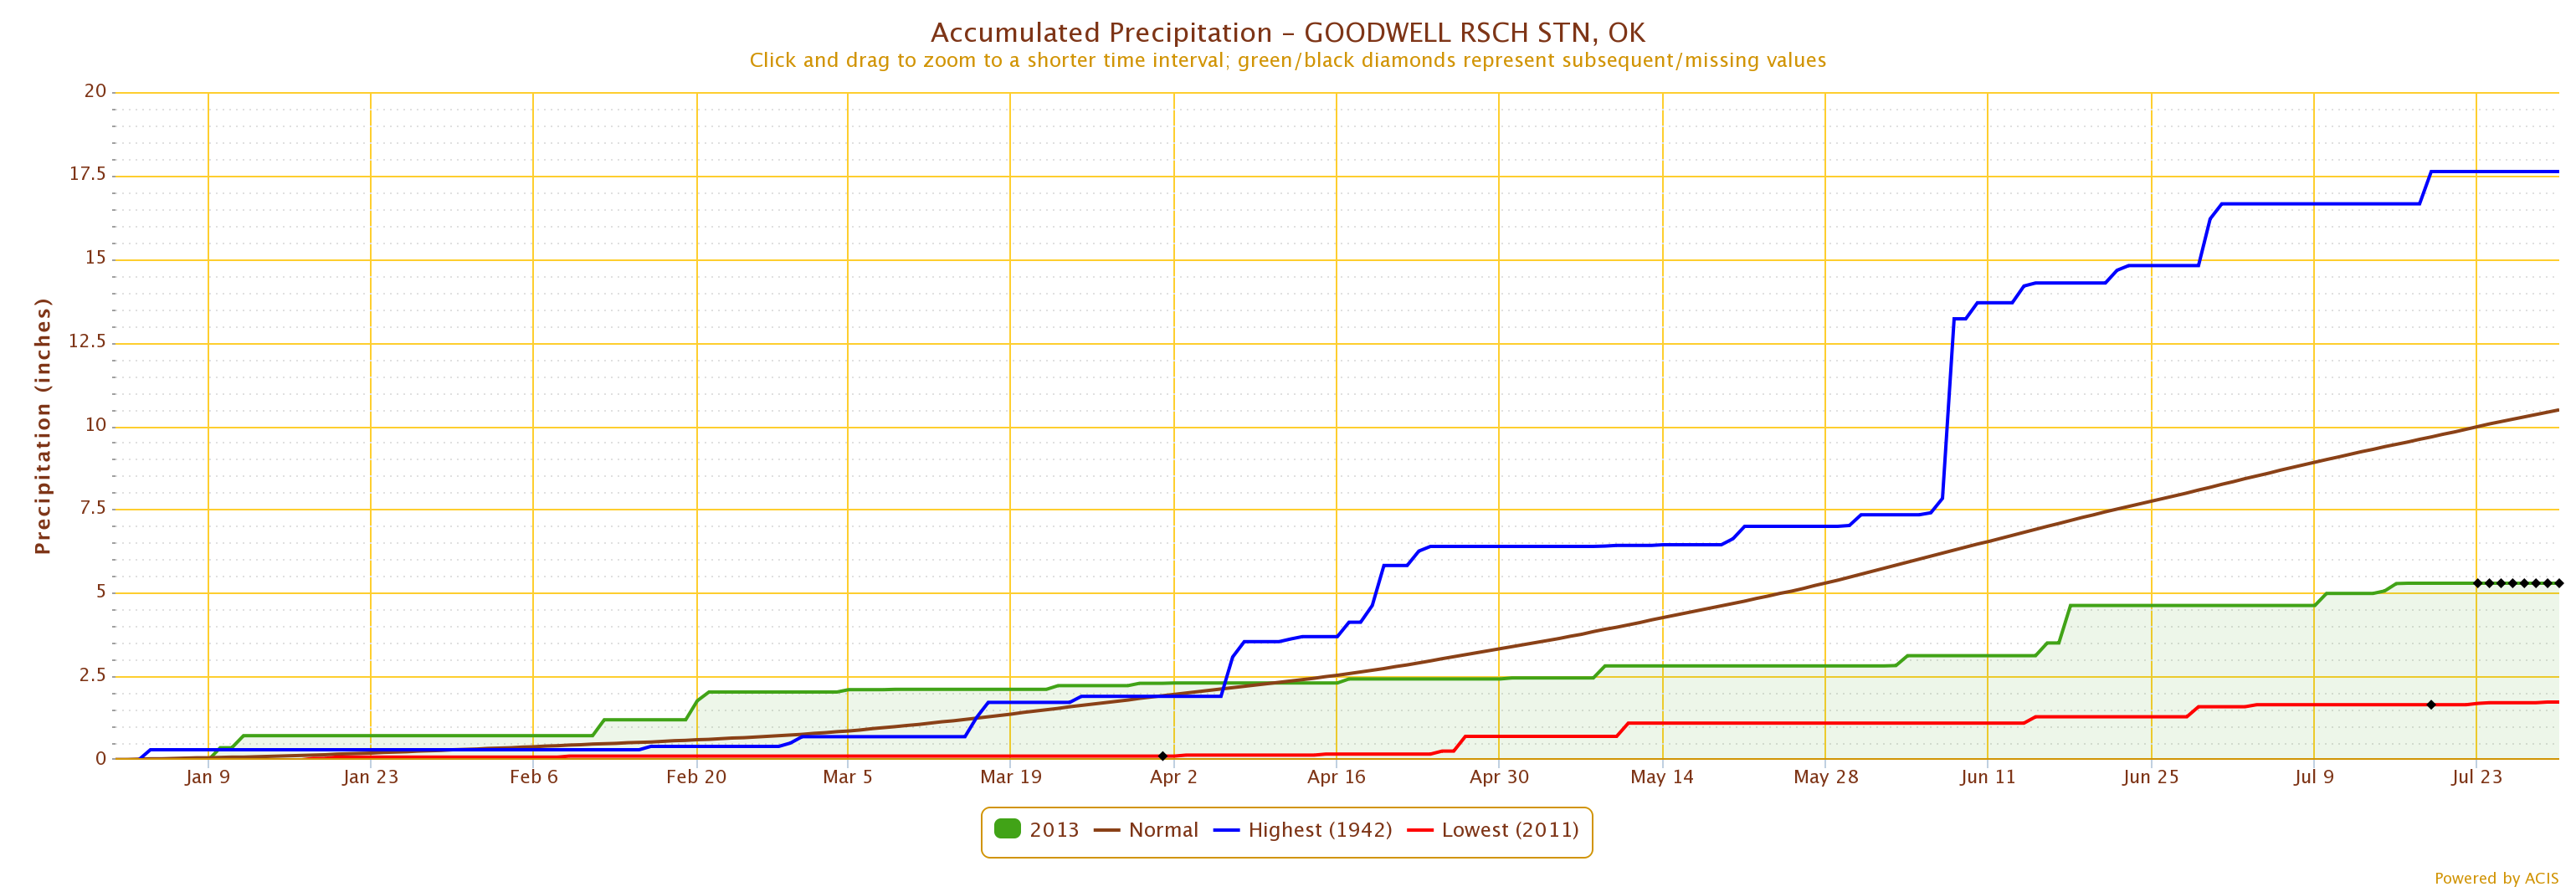
Not the driest Jan 1-July 29 on record. That belongs to 2011 (remember that
year??). But still well below normal (and far behind the wettest such period
on record, 1942's 17.62 inches).
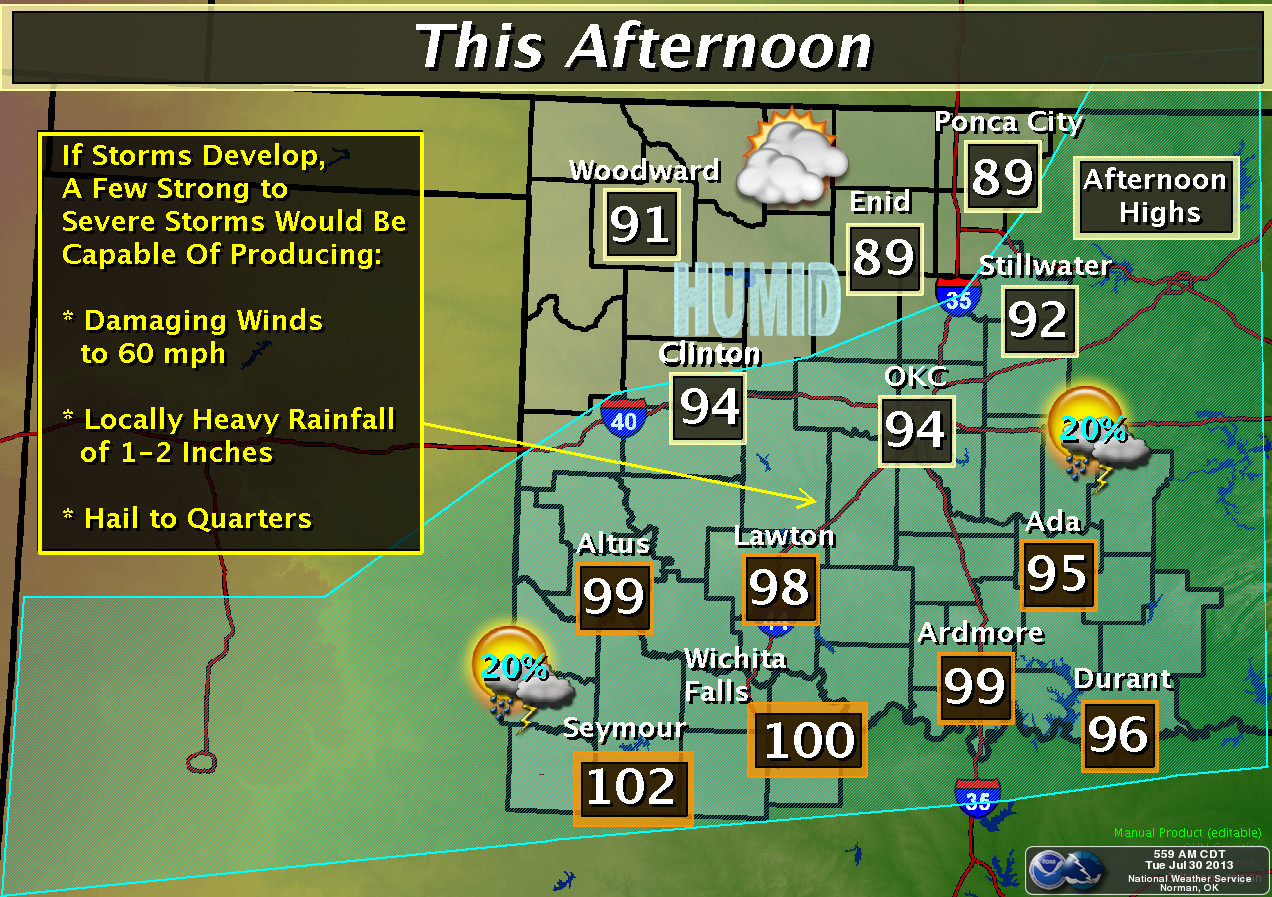
So another odd month comes to a close. Oh yeah, it's STILL not over just yet.
Watch today for another chance of storms.
Gary McManus
Associate State Climatologist
Oklahoma Climate Survey
(405) 325-2253
gmcmanus@mesonet.org
July 30 in Mesonet History
| Record | Value | Station | Year |
|---|---|---|---|
| Maximum Temperature | 111°F | CHER | 2012 |
| Minimum Temperature | 54°F | BOIS | 2004 |
| Maximum Rainfall | 4.89 inches | SPEN | 2014 |
Mesonet records begin in 1994.
Search by Date
If you're a bit off, don't worry, because just like horseshoes, “almost” counts on the Ticker website!