Ticker for December 6, 2012
MESONET TICKER ... MESONET TICKER ... MESONET TICKER ... MESONET TICKER ...
December 6, 2012 December 6, 2012 December 6, 2012 December 6, 2012
Drought ... the good news and the bad news
Well, to start out, the good news is the drought picture didn't change any. We
still see the same drought map that we had last week, so no further
intensification just yet. Over 90% of the state remained in the extreme/exceptional
drought categories, and virtually 100% was covered by severe/exceptional drought.

The bad news is the drought picture didn't change any. No chance for improvements
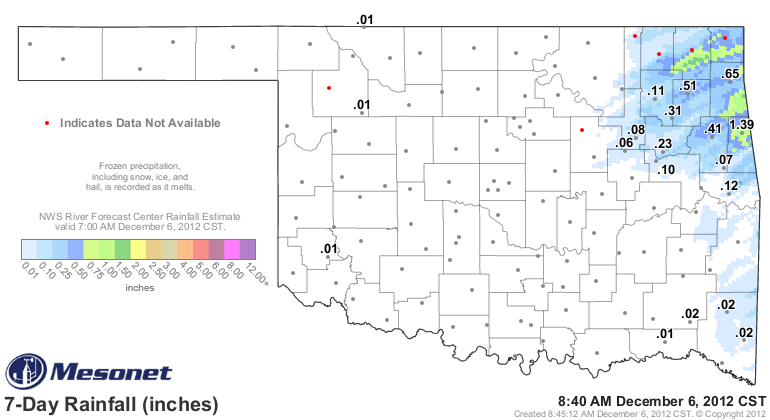
since it didn't rain anywhere except in the far northeast, an area that has
already seen some recent minor improvements.
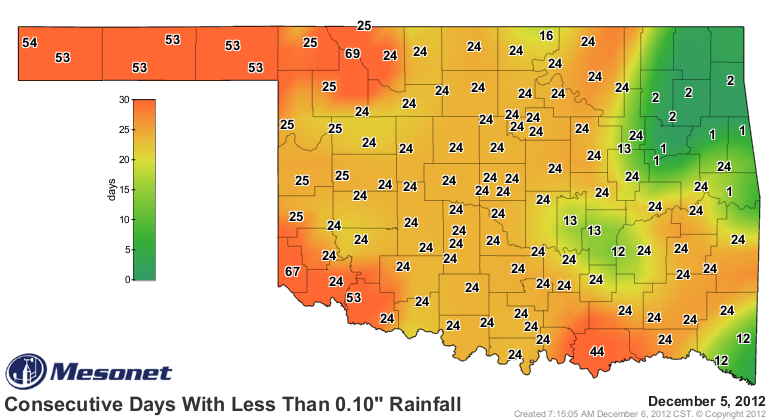
For the remainder of the state, the ridiculously dry weather continued. It has
now been as many as 25 days since most of the state saw at least a tenth of an
inch of rain in a single day, as shown in this Oklahoma Mesonet map (add a day
since no rain is forecast for today). In southwestern and northwestern areas, it's
been as many as 70 days (Freedom).
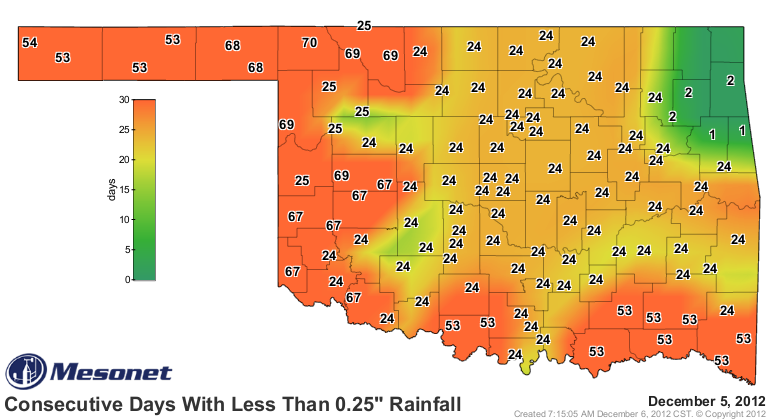
The numbers are similar for the quarter-inch map, with Buffalo (the greatest
place in the Universe) having gone 71 days now without at least that much in
a single day.
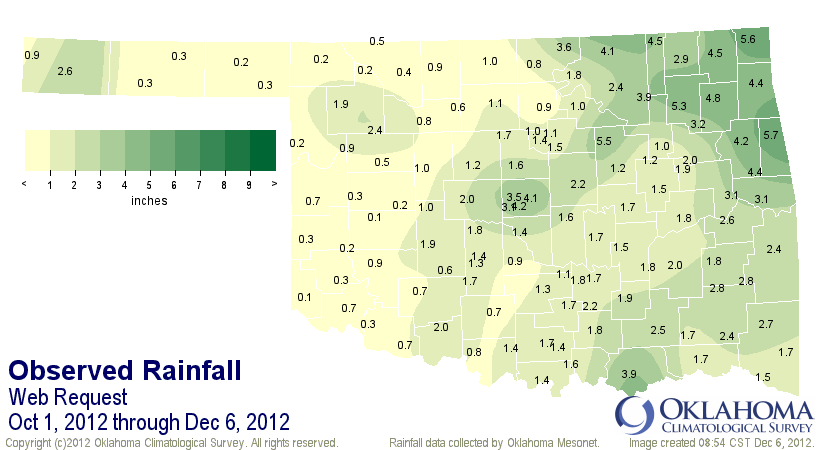
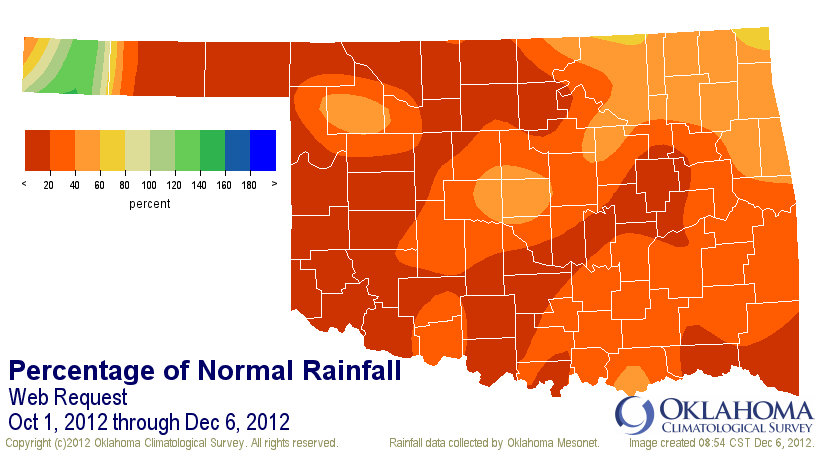
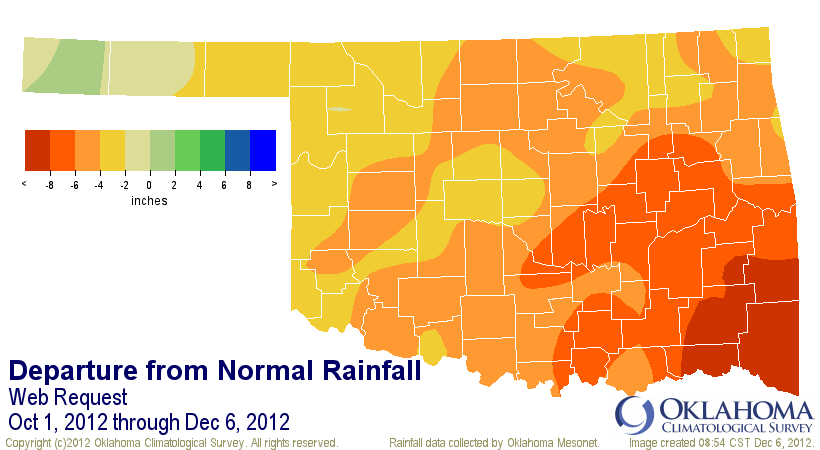
Oh yeah, that's ugly. But so is this. Since October 1 of this year, the state
has seen a statewide average of 1.72", nearly 5" below normal to rank as the
4th driest such period (Oct. 1-Dec. 6) since 1921. The deficits by area range
from 2.05" in the Panhandle (23% of normal) to 8.62 inches in the southeast (20%)
of normal. West central Oklahoma has seen 10% of normal rainfall with an areal
average of 0.46", 4.15" below normal.
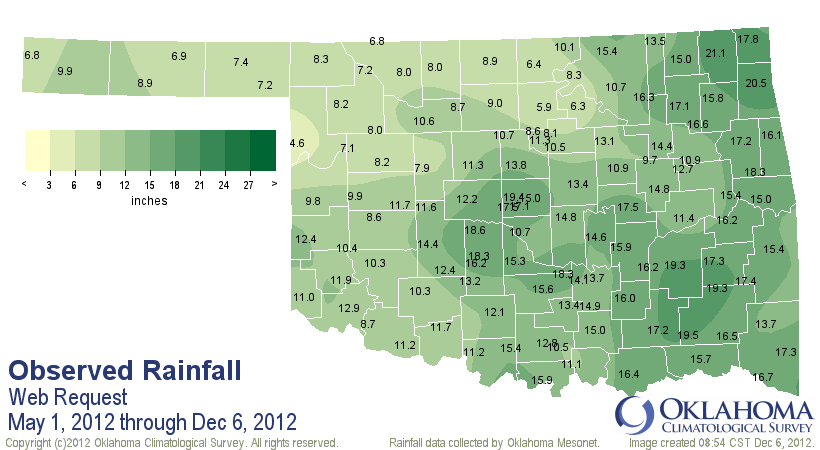
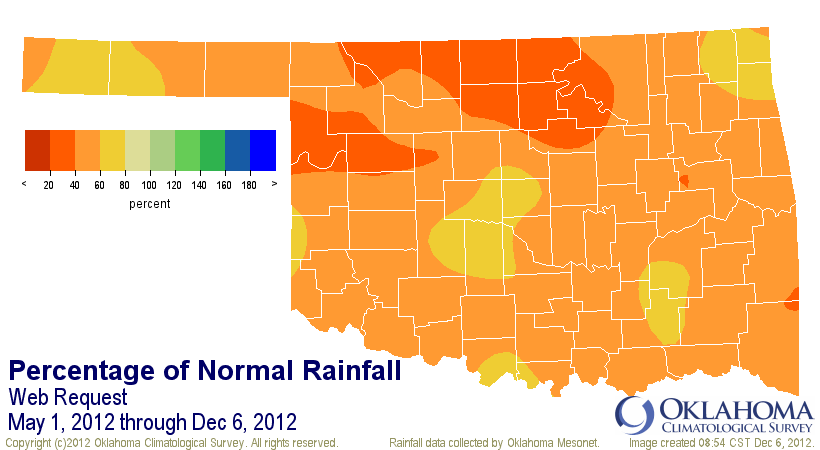
Even more nasty is the rainfall since May 1 of this year. Now this is much worse
since it encapsulates both our primary rainy season (especially May through
mid-June) and then our secondary rainy season of September through early
November. Since May 1, the statewide average rainfall total is 12.43", nearly
13" below normal (49% of normal) and the driest such period since 1921 and the
second driest since 1895.

-****-
Region Avg. Dep. Normal Pct. Normal Rank Since 1921
Panhandle 7.51" -8.35" 47% 2nd driest
N. Central 8.15" -14.84" 35% 1st driest
Northeast 14.66" -14.59" 50% 1st driest
W. Central 9.56" -11.68" 45% 2nd driest
Central 13.85" -12.07" 53% 2nd driest
E. Central 15.24" -15.38" 50% 2nd driest
Southwest 11.49" -10.74" 52% 3rd driest
S. Central 14.33" -12.30" 54% 5th driest
Southeast 16.89" -15.76" 52% 4th driest
Statewide 12.43" -12.81" 49% 1st driest
-***-
A look to the future? Do we have to? It ain't pretty. We do have the arctic
front coming through this weekend, but it is not expected to have much
precipitation associated with it. Here's your 5-day rainfall forecast.
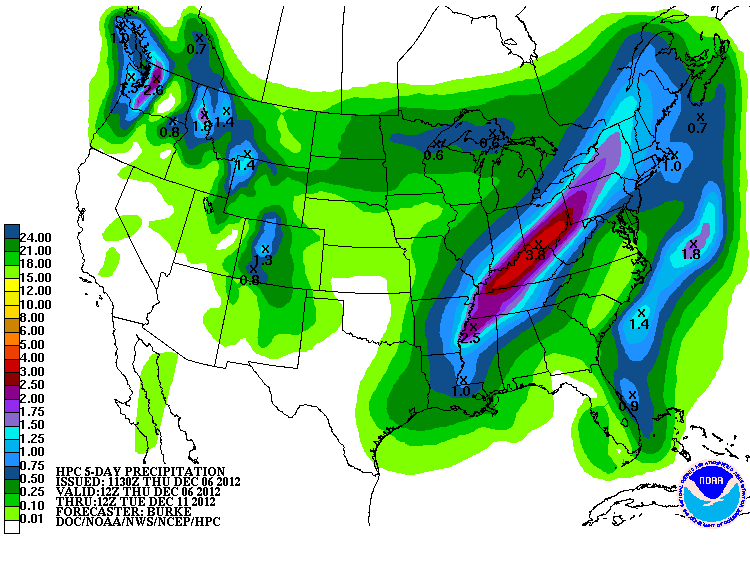
Thanks to that short-range forecast, as well as no longer-term wet signal
showing up, AND the fact that we are beginning our normal three driest months
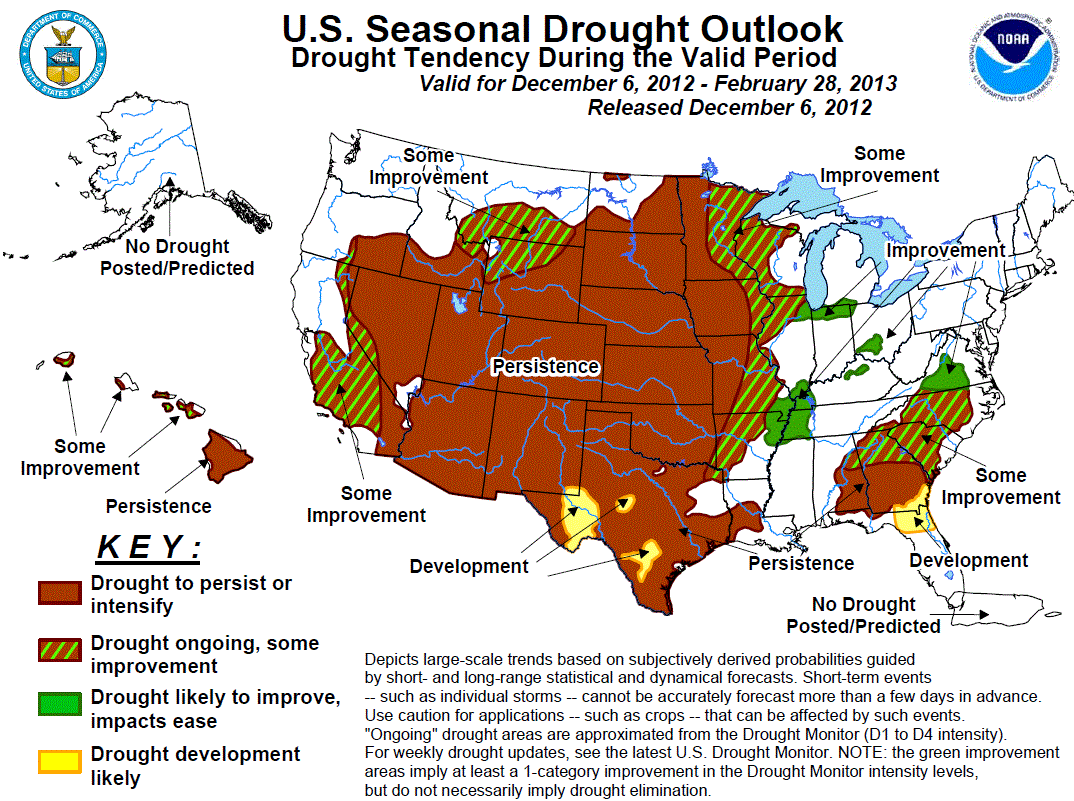
of the calendar year, and that spells a continuation of drought. Drought is
expected to persist or intensify through the end of February according to the
newest U.S. Seasonal Drought Outlook from the NWS' Climate Prediction Center
(CPC). I guess the only mercy there is that it's not a leap year so one less
day to lament.
The longer-term wet signal we needed faded away with El Nino, which began to
develop in the equatorial pacific ocean waters before mysteriously dissipating
to neutral conditions (neither El Nino or La Nina, known otherwise as "ENSO-
Neutral").
That leaves us with another oceanic player working against us ... the Pacific
Decadal Oscillation (PDO). This climate index tracks ocean temperature
anomalies in the North Pacific. Unlike ENSO, this ocean phenomenon tends to
last from two-to-three decades (ENSO from 6 months to a couple of years,
usually). When the PDO is in its negative phase, the west pacific warms and
the east Pacific cools. This is the pattern we are in now, and we should remain
in the negative PDO phase and also ENSO-Neutral conditions through February.
After all of that confusion, here's the result. When those two patterns combine
(the negative PDO and ENSO-Neutral), this is the rainfall pattern that emerges
for December-February. This map was made using all the instances of negative
PDO and ENSO-Neutral since 1948.
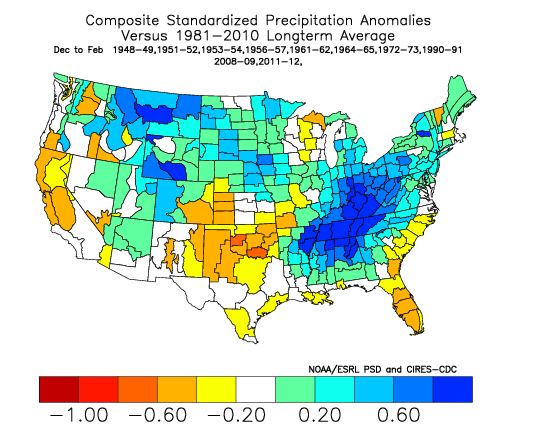
As you can see, Oklahoma is painted with negative precipitation anomalies during
this type of climate signal. It's not necessarily strong across the entire
state (i.e., in the Panhandle, north central and southeast areas), but it doesn't
have to be. Remember, we are in our climatological driest part of the year,
facing long-term deficits of more than 12 inches! Any hint of dryness during
these next three months will keep us in significant drought through that period.
In other words, drier than normal during the driest part of the year spells ...
dry.
Now keep in mind that this is really the only "known" climate driver over the
next few months, so it's the big player at the moment. However, it's usually
what we don't know that makes fools of us later.
Short and sour, here's the takeaway message: it looks likely at this time that
Oklahoma will remain in significant drought conditions through the winter as
we begin to emerge into spring. The type of winter relief we had last year is
just not showing up, and is frankly already a couple of months behind.
Finally, IT IS ABSOLUTELY IMPERATIVE that we have something close to a normal
rainy spring season in Oklahoma or our chances of a full-fledged three-year
drought cycle increase dramatically. We'll worry about spring down the road.
We have enough on our plates for now, I'd say.
Gary McManus
Associate State Climatologist
Oklahoma Climatological Survey
(405) 325-2253
gmcmanus@mesonet.org
December 6 in Mesonet History
| Record | Value | Station | Year |
|---|---|---|---|
| Maximum Temperature | 77°F | ANTL | 2001 |
| Minimum Temperature | -6°F | KENT | 2011 |
| Maximum Rainfall | 1.31″ | OKEM | 2004 |
Mesonet records begin in 1994.
Search by Date
If you're a bit off, don't worry, because just like horseshoes, “almost” counts on the Ticker website!