Ticker for March 29, 2012
MESONET TICKER ... MESONET TICKER ... MESONET TICKER ... MESONET TICKER ...
March 29, 2012 March 29, 2012 March 29, 2012 March 29, 2012
Drought map shows a tad more relief, and boy is it green in Oklahoma!
The slow-moving upper-level storm system 10 days ago eventually got around to
providing a bit of relief for the Oklahoma Panhandle. It was touch-and-go there
for awhile, but one more wrap-around tendril of rain gave much of the Panhandle
a good inch or two. That brought rainfall for the month up to 1-2 inches across
the area, good enough for an improvement on the latest U.S. Drought Monitor map.
U.S. DM map: 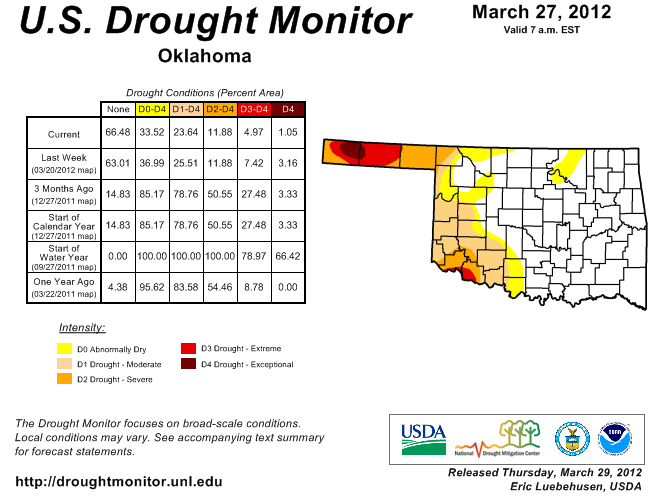
30-day rainfall: 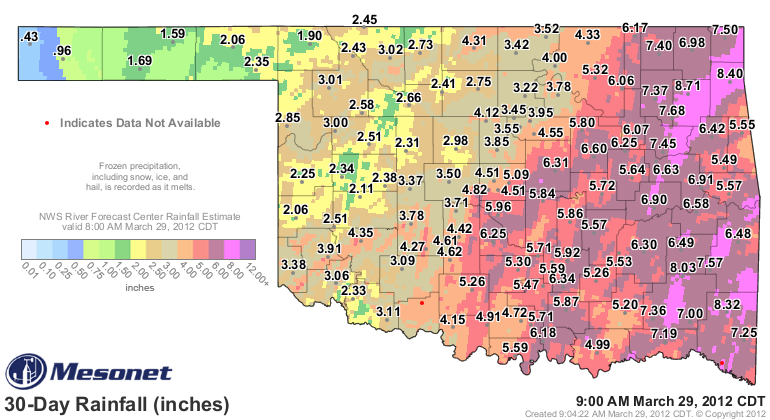
Pct. norm: 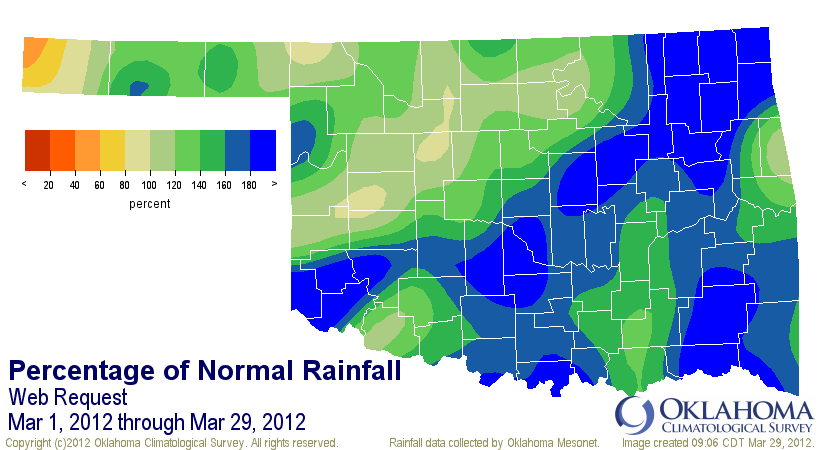
The main improvements this week occurred in the Panhandle with that rainfall
that occurred after the cutoff point of Tuesday morning last week. The D4 area
in Oklahoma, now confined mostly in Cimarron County, has shrunk to about 1% of
the state. The last time we had that little exceptional drought in the state was
April 26, 2011. For the severe-through-exceptional percentage of 11.88%, you
have to travel back a bit farther to the February 15, 2011, map.
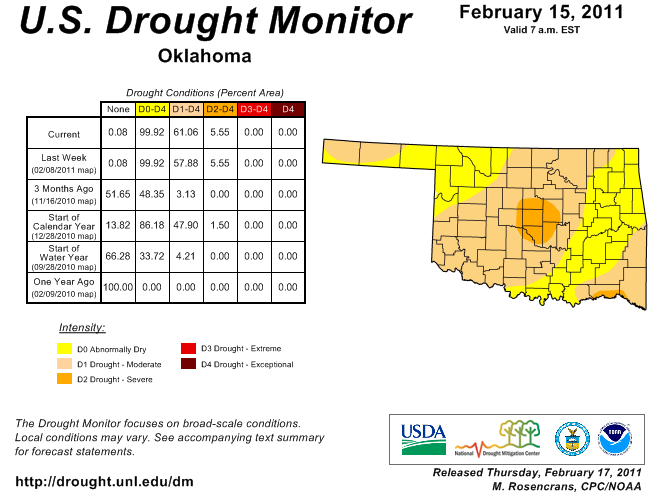
It is still not a fair comparison due to what I've been call the drought
momentum. The drought back in February 2011 was just gaining a toehold over
much of the state, especially western and central Oklahoma, after an extremely
dry winter. So the momentum pointed towards dry at that time. Now we're coming
off of one of our wettest Marches (that is the month of March, not we were
marching somewhere and we got wet) on record, a continuation of a wetter than
normal winter ... at least for much of the state. So the momentum has swung
over to drought relief this year.
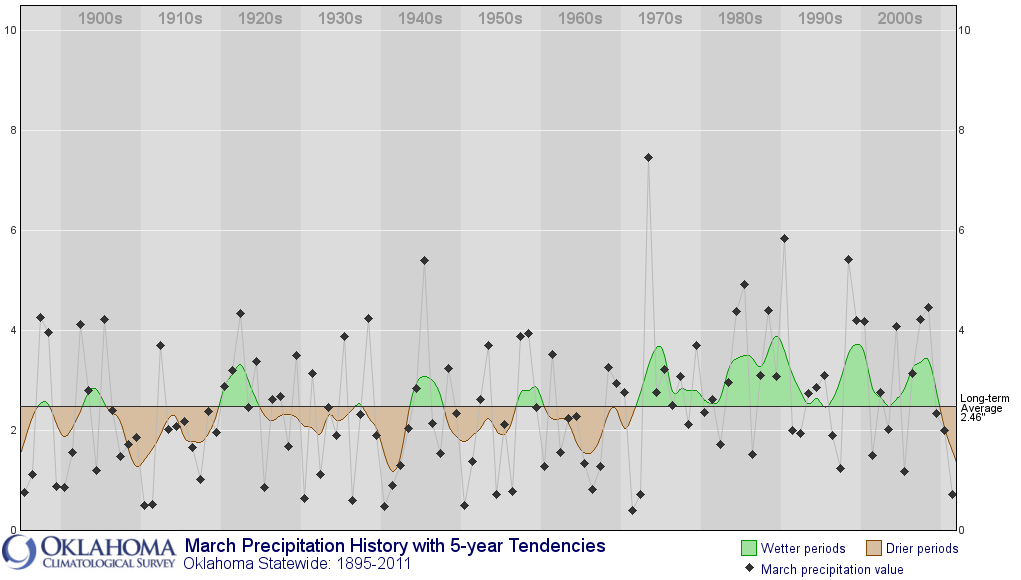
Now if March ended today, that would be extremely unusual since it's usually 31
days long. However, if it did indeed end today, this March would unofficially
rank as the sixth wettest on record, dating back to 1895, with a statewide
average of 4.49 inches. That's according to data from the Oklahoma Mesonet.
Remember, the official records are kept by NCDC and are made up of several
different sources, including about half of the 120 Oklahoma Mesonet stations. The
real-time nature of the Mesonet does give us a quick snapshot that usually ends
up being fairly close to the official records. The wettest March on record from
back in 1973 will be tough to beat with a statewide average of 7.46 inches.
March rainfall totals have definitely been on the upswing over the last 40
years or so, as evidenced by this time series.
Keep in mind we are still contending with possibly our warmest March on record
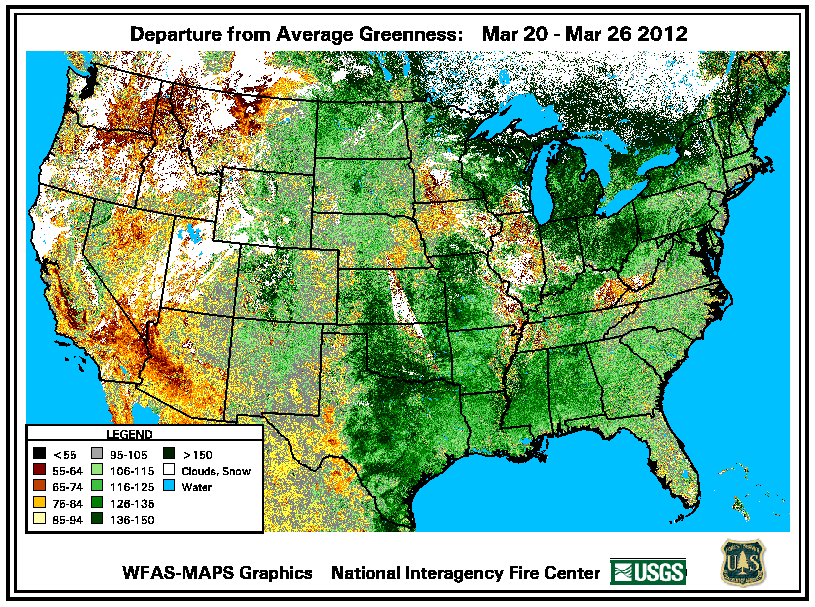
as well, so the vegetation and evaporative demands are about a month ahead. You
definitely don't need me to tell you that it is unusually green for late March,
but in case you do, here's proof. This greenness anomaly map shows what the warm
winter and March have done not only for Oklahoma, but most of the eastern two-
thirds of the U.S.
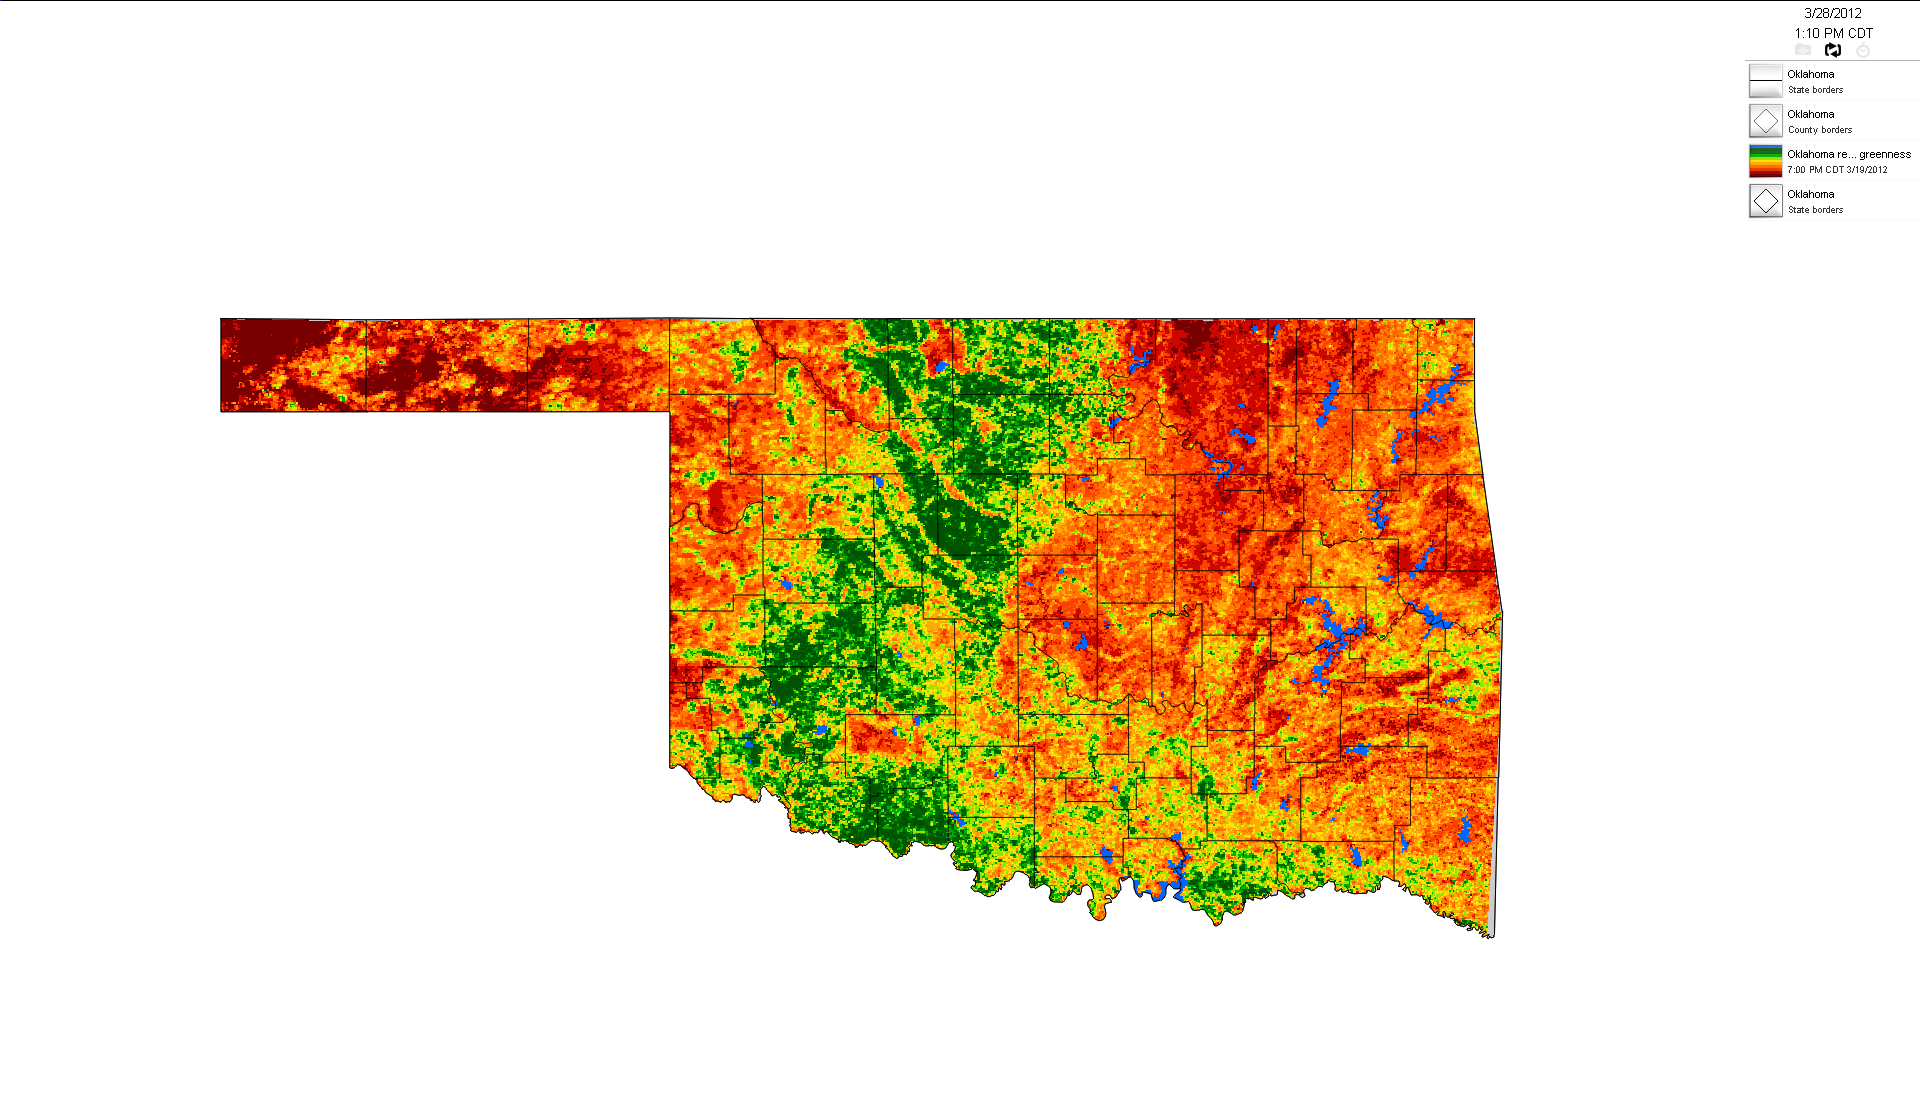
Here's a close-up look at Oklahoma from the Mesonet's OK-FIRE website. This
is relative greenness, so it's compared to an average greenness over the entire
year and not specifically late March like the previous map. But you can
easily pick out Oklahoma's wheat belt running from southwestern-through-north
central Oklahoma.
Compare that to last year's map from at this time and you can see the effect
drought has on relative greenness.

Now compare it to TWO years ago at this time and see the impact persistent cold
weather had on the greenness, even with more-than-adequate moisture.
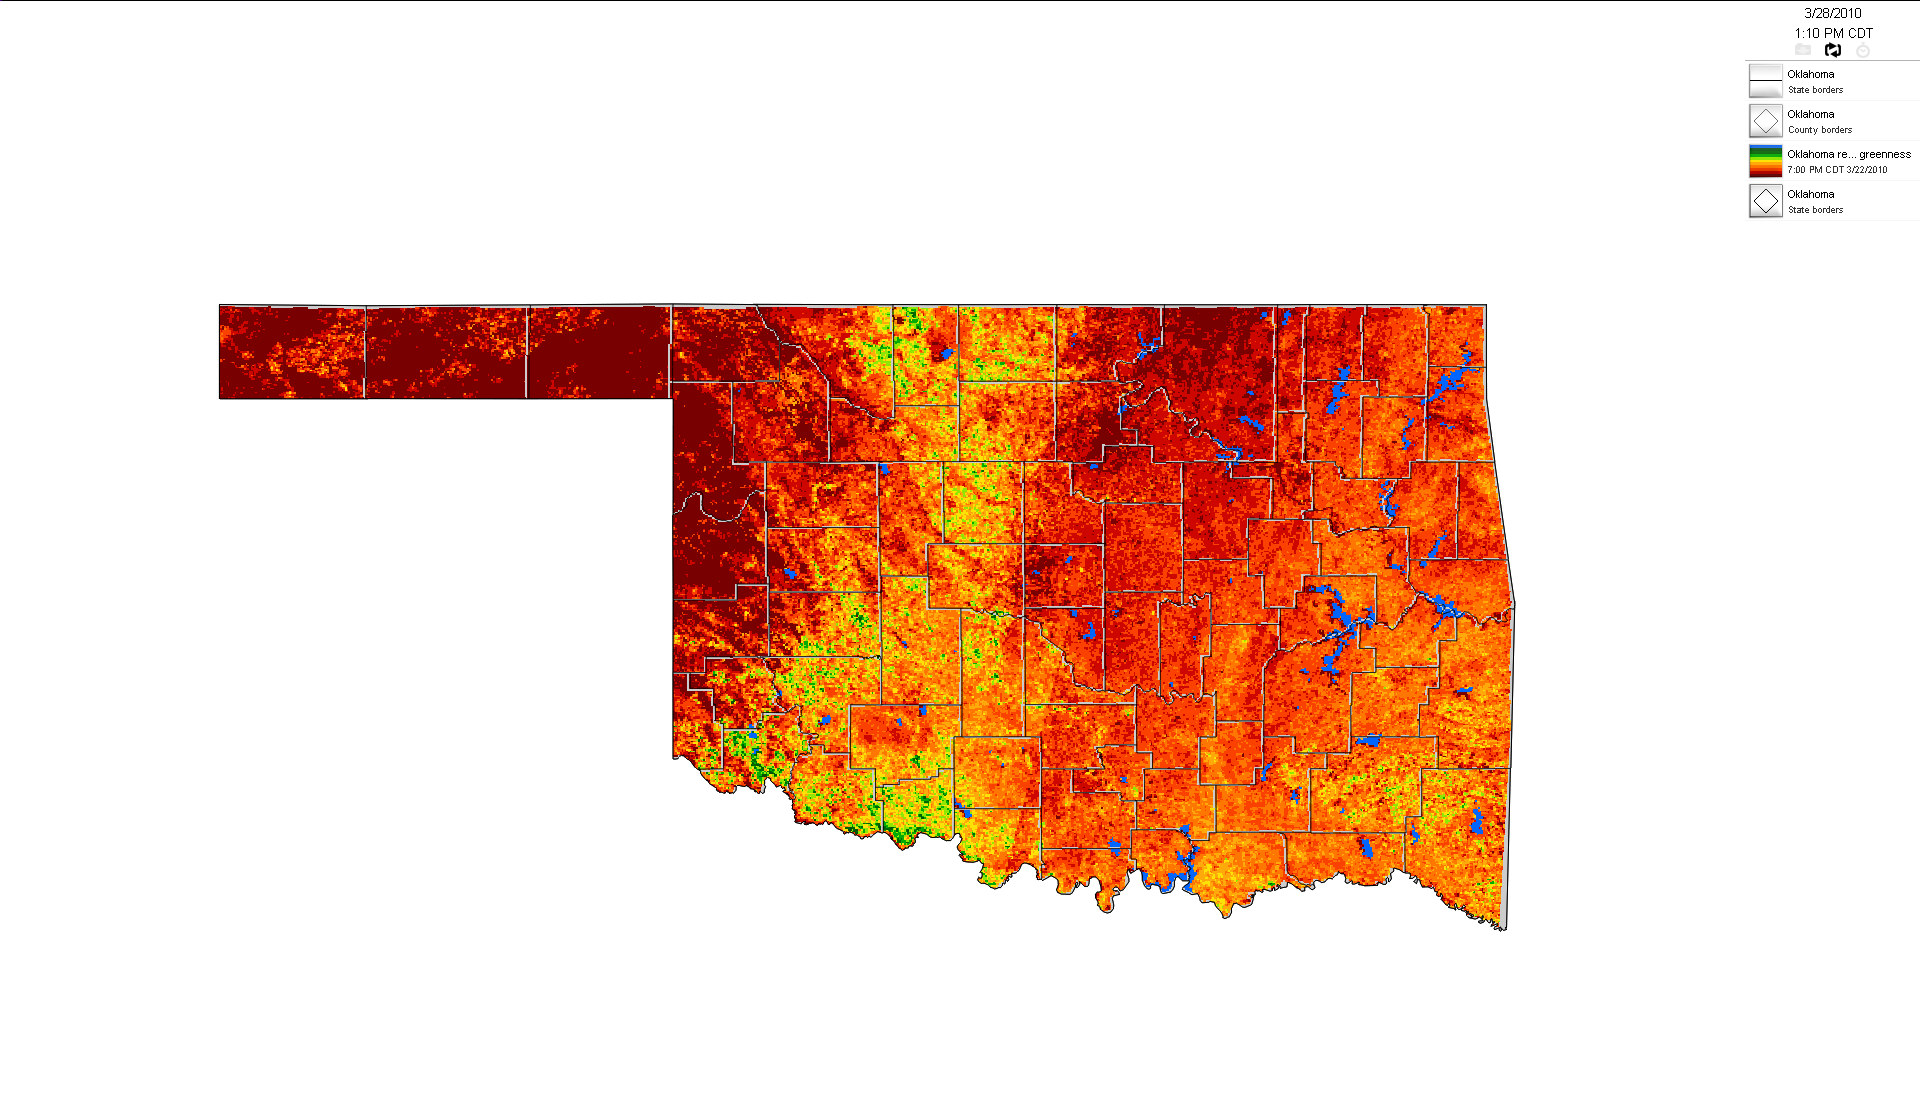
The 2010 wheat crop ended up as a good crop, despite the later development, than
last year's disastrous crop. This year it is pretty obvious that we've hit the
perfect storm of extremely wet and extremely warm to see such an advanced wheat
crop this early in its life cycle.
Now it's a footrace to summer. Don't fret the heat just yet. That chapter will
be written by how much rain we get and how much soil moisture there will be.
At least that's how it normally works. After the last two years, it might just
end up being decided by how cranky Mother Nature is.
Gary McManus
Associate State Climatologist
Oklahoma Climatological Survey
(405) 325-2253
gmcmanus@mesonet.org
March 29 in Mesonet History
| Record | Value | Station | Year |
|---|---|---|---|
| Maximum Temperature | 94°F | HOLL | 2022 |
| Minimum Temperature | 16°F | BOIS | 2009 |
| Maximum Rainfall | 2.93 inches | WATO | 2007 |
Mesonet records begin in 1994.
Search by Date
If you're a bit off, don't worry, because just like horseshoes, “almost” counts on the Ticker website!