Ticker for January 26, 2012
MESONET TICKER ... MESONET TICKER ... MESONET TICKER ... MESONET TICKER ...
January 26, 2012 January 26, 2012 January 26, 2012 January 26, 2012
Near-final epitaph on the rain, and some astounding long-term statistics
I say "near-final" because there is still some sort of weird spider leg thing
of rain moving through southeastern Oklahoma at the moment (and yes, "weird spider
leg thing" is an official weather term). So please note that these values could
still go up a bit. The Mesonet and radar-estimated rainfall totals show that
much of the southeastern quarter of the state received between 3-6 inches of
rainfall from this slow moving storm.
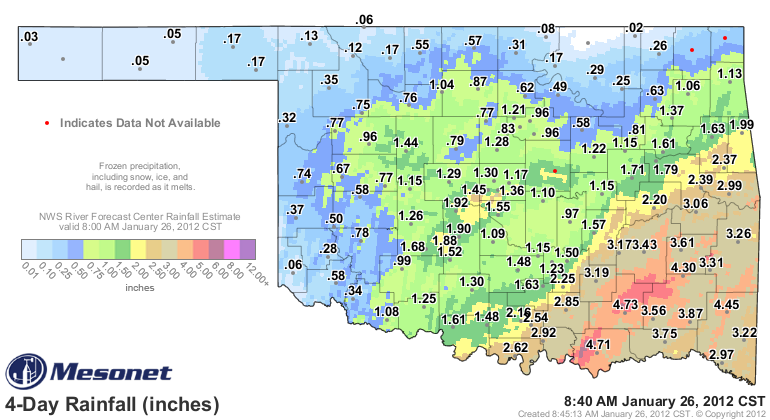
Here are the top 20 totals from the Mesonet
-****-
Lane 4.74" Wister 3.26"
Durant 4.71" Broken Bow 3.21"
Mt Herman 4.44" Centrahoma 3.19"
Clayton 4.30" Stuart 3.17"
Cloudy 3.87" Stigler 3.06"
Hugo 3.76" Sallisaw 2.99"
Wilburton 3.61" Idabel 2.97"
Antlers 3.56" Madill 2.92"
McAlester 3.43" Tishomingo 2.85"
Talihina 3.31" Burneyville 2.62"
-***-
Radar estimates clearly show some amounts over 5 inches in Atoka, Pittsburg
and Pushmataha Counties, and then 5-6 inch amounts from down in Bryan County.
The southeast is fairly well saturated by now, enough that these heavy rain
events are causing flooding. River flooding was reported on Boggy Creek, the
Blue River, the Poteau River, and the Kiamichi River. As a reminder, here is
what the Kiamichi River looked like in August 2011.
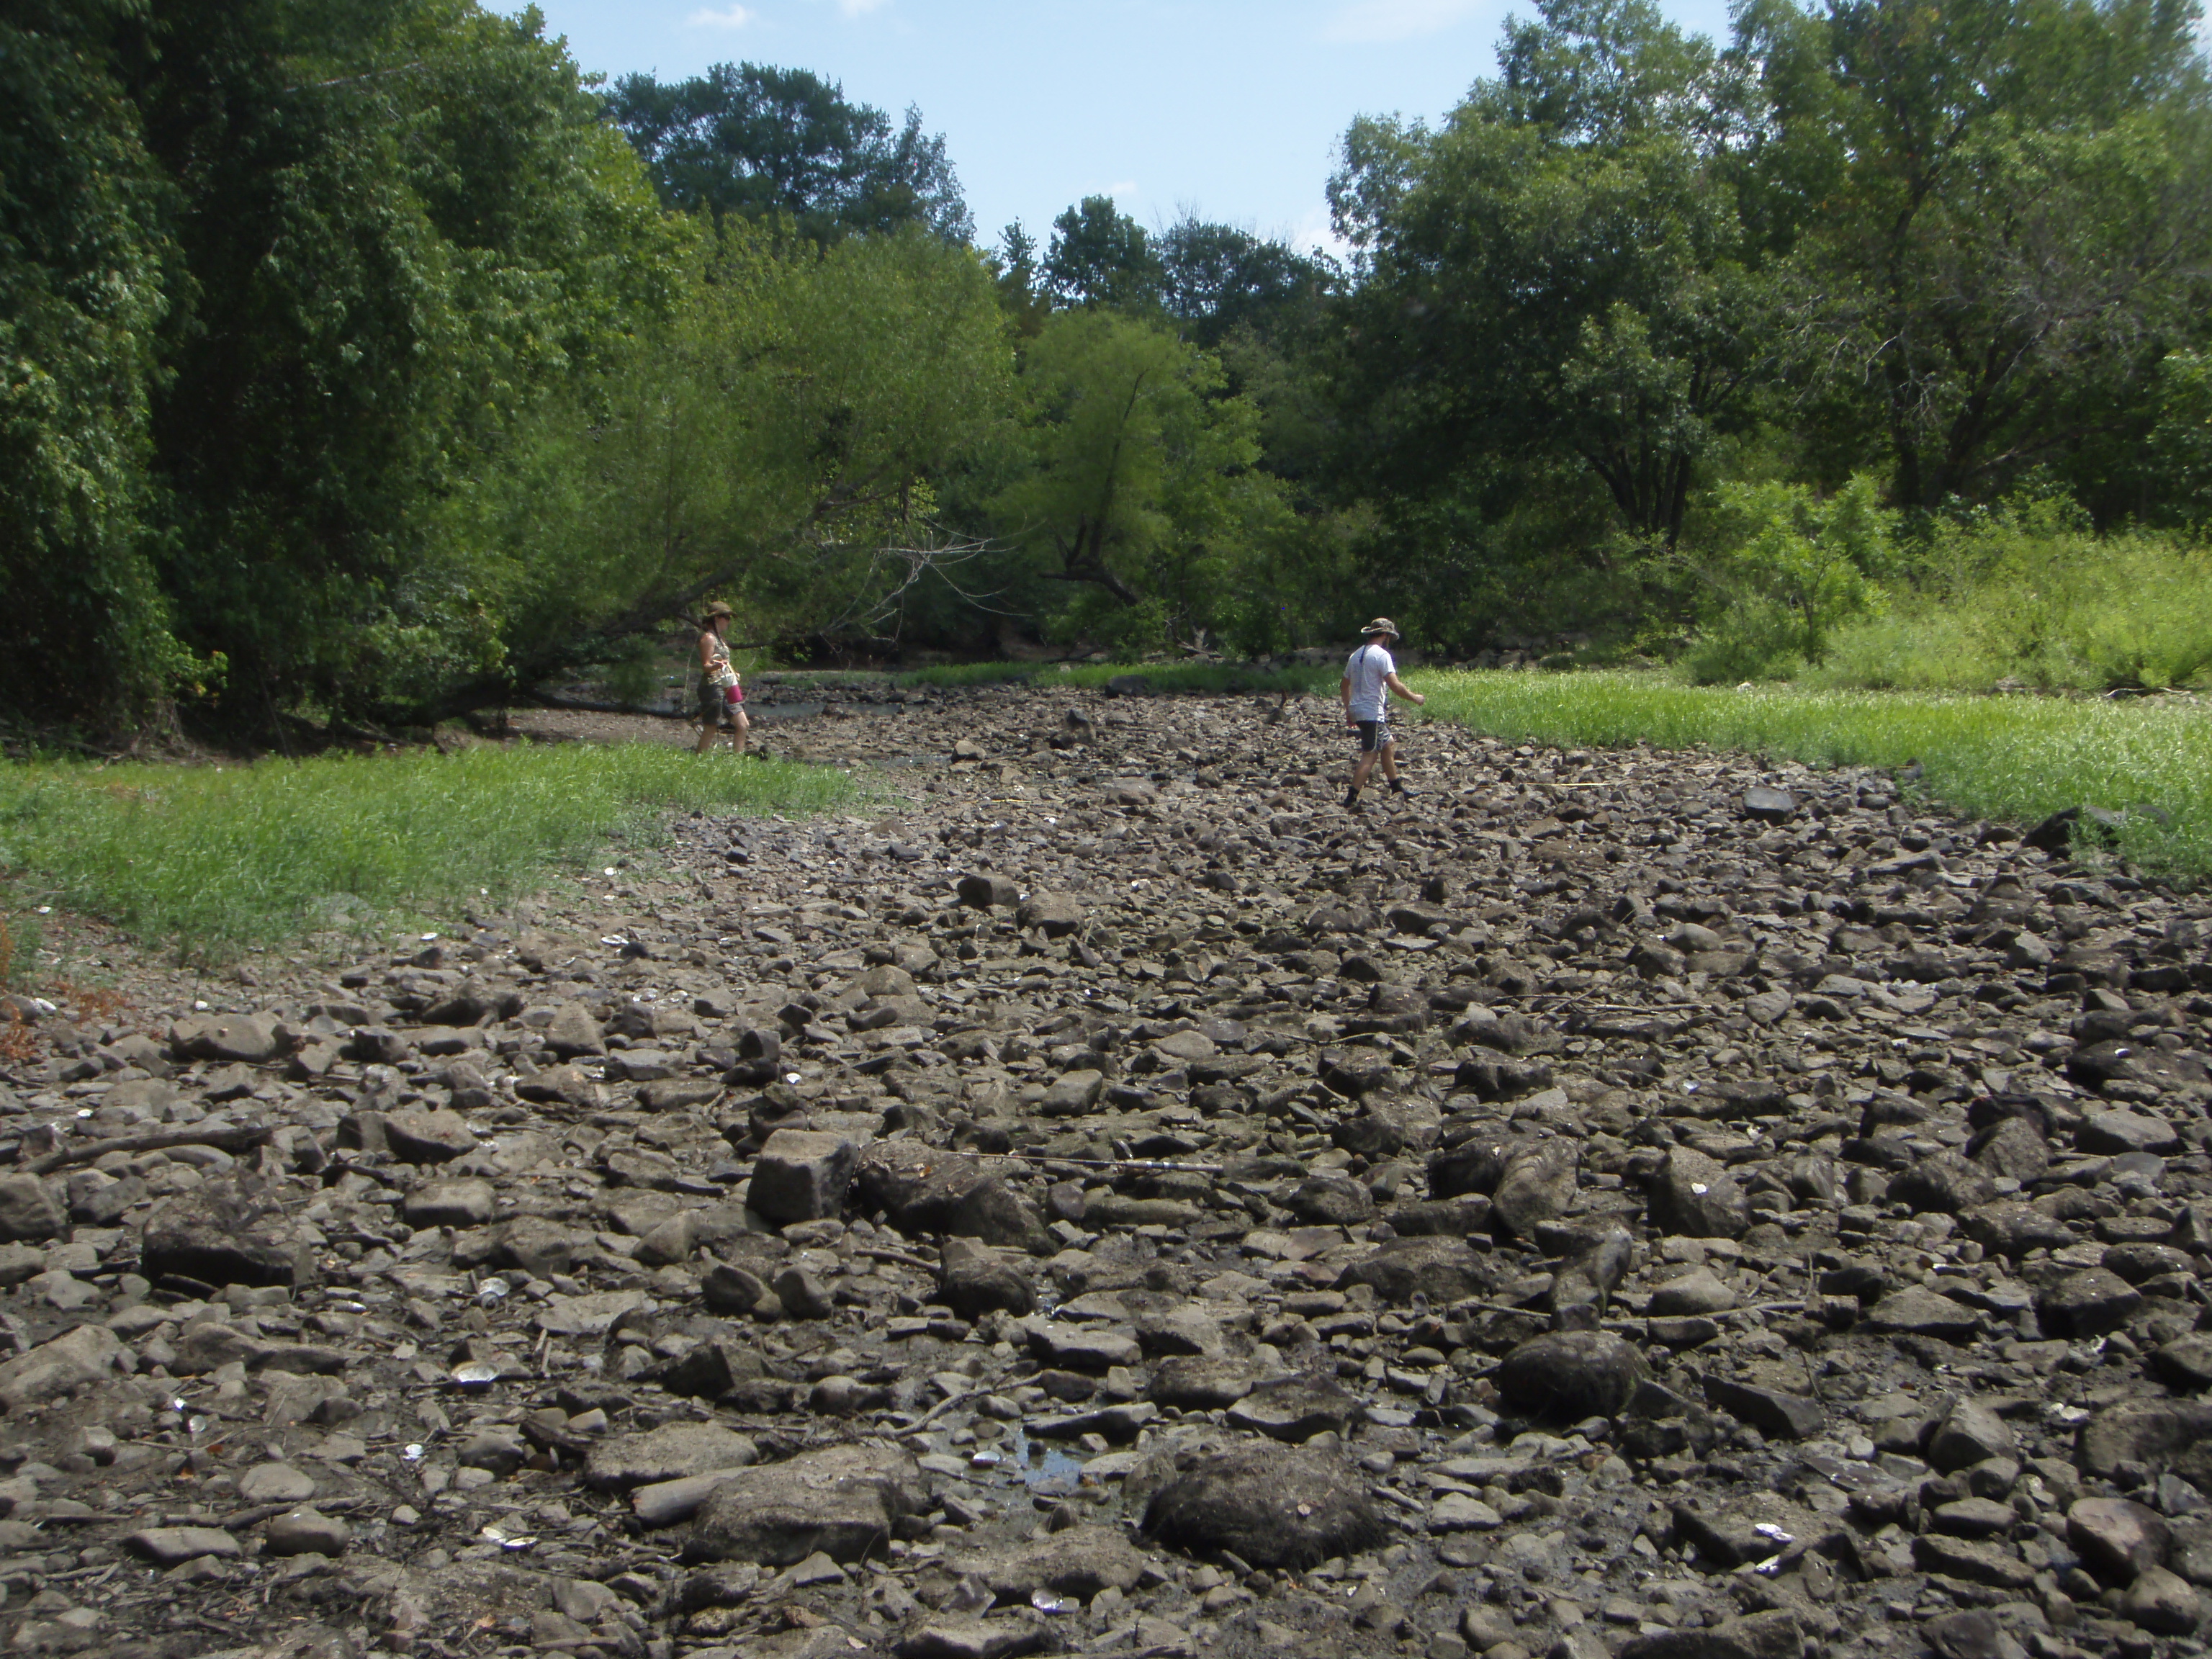
So things have changed dramatically in the span of six months. The latest U.S.
Drought Monitor report, as I warned yesterday, does not portray the impacts
from the latest rain event since the rain occurred after the cutoff point for
consideration. Those will be reflected next week. Here is the latest released
this morning.
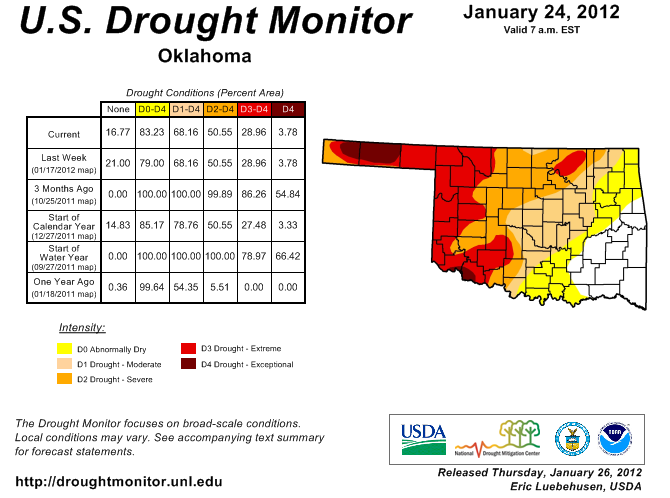
The only change on that map is an increase in the "abnormally dry" area in
northeastern Oklahoma. Dry weather has sort of snuck up on us over the last
month or two in that area. It's easy to simply think that eastern Oklahoma has
been getting lots of rain, but as it turns out, not ALL of eastern Oklahoma.
Check out these maps of percent of normal rain for the last 30 and 60 days from
the Mesonet.
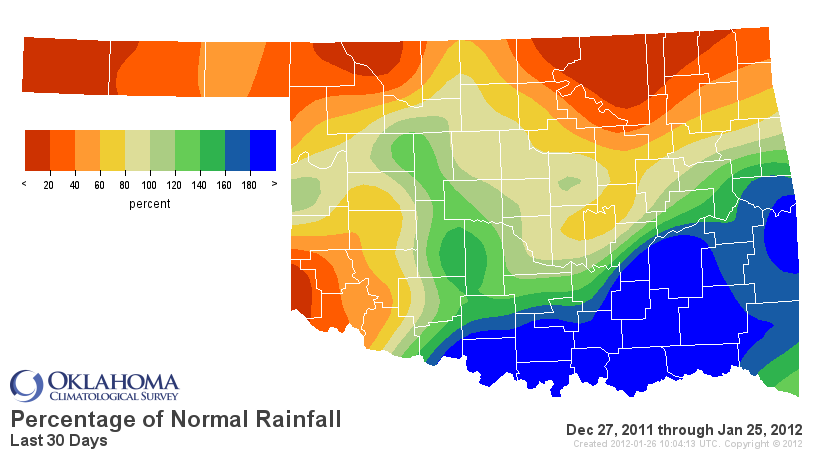
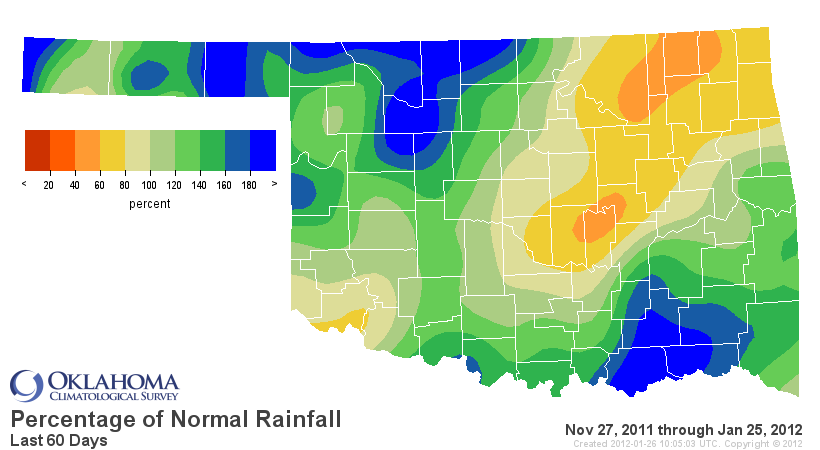
That area in northeastern Oklahoma has definitely not enjoyed the bounty of
moisture during December and January. The lucky part is that we're in the cool
season so the impacts can't progress too quickly. The cooler temperatures and
the lack of growing vegetation mean lower demand for that moisture.
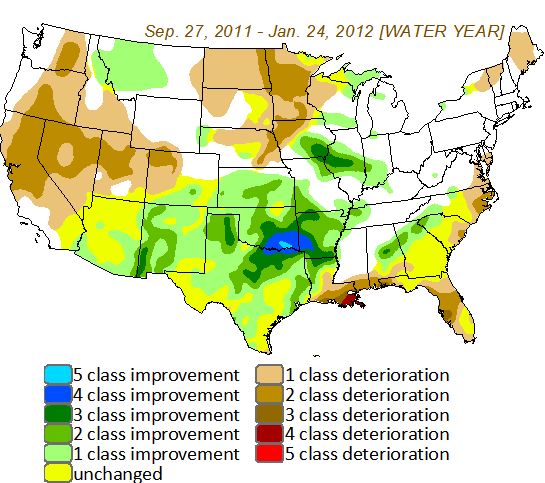
Here is how the drought has changed depictions on the U.S. Drought Monitor map
since October 2011. Southeastern Oklahoma had a full 5 class improvement over
the past four months from D4 exceptional drought to completely free of dry
conditions.
**************************************
Here's something pretty astounding for your consideration. Look at the
differences in precipitation totals for the various areas of the state since
October 1, 2010, near the drought's beginning point.
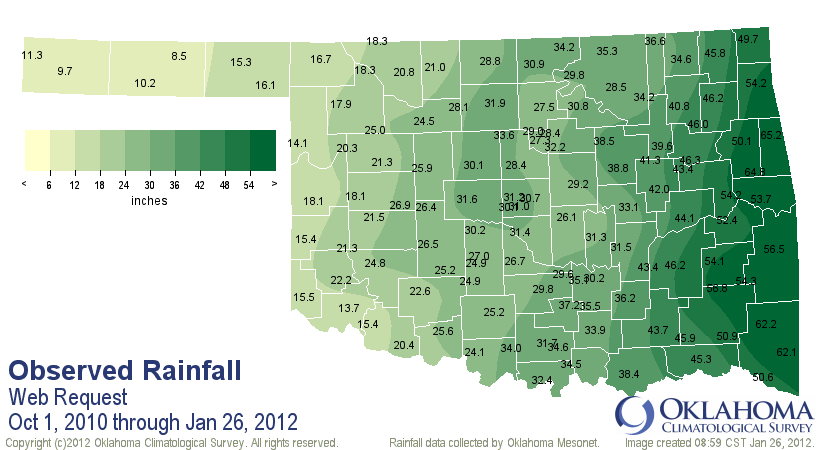
The totals go from 65.2 inches in Westville in eastern Oklahoma to a measly
8.5 inches in Hooker. That's nearly 57 inches difference!
Here's the top 10 wettest vs. the top 10 driest Mesonet sites over that 16 month
period.
-****-
Westville 65.22" Hollis 15.54"
Cookson 64.77" Erick 15.45"
Mt Herman 62.16" Tipton 15.41"
Broken Bow 62.05" Beaver 15.34"
Clayton 56.78" Arnett 14.11"
Wister 56.47" Altus 13.69"
Talihina 54.33" Kenton 11.28"
Jay 54.25" Goodwell 10.20"
Webbers Falls 54.24" Boise City 9.70"
Wilburton 54.12" Hooker 8.46"
-***-
The following is a table of benefits of receiving only 8.5 inches of rain over
16 months:
(intentionally left blank)
So while there is flooding in southeastern Oklahoma, this is the fate of farm
ponds in northwestern Oklahoma. These are once again the pictures of my favorite
fishing hold south of Buffalo, a spring-fed farm pond.
Times of plenty: 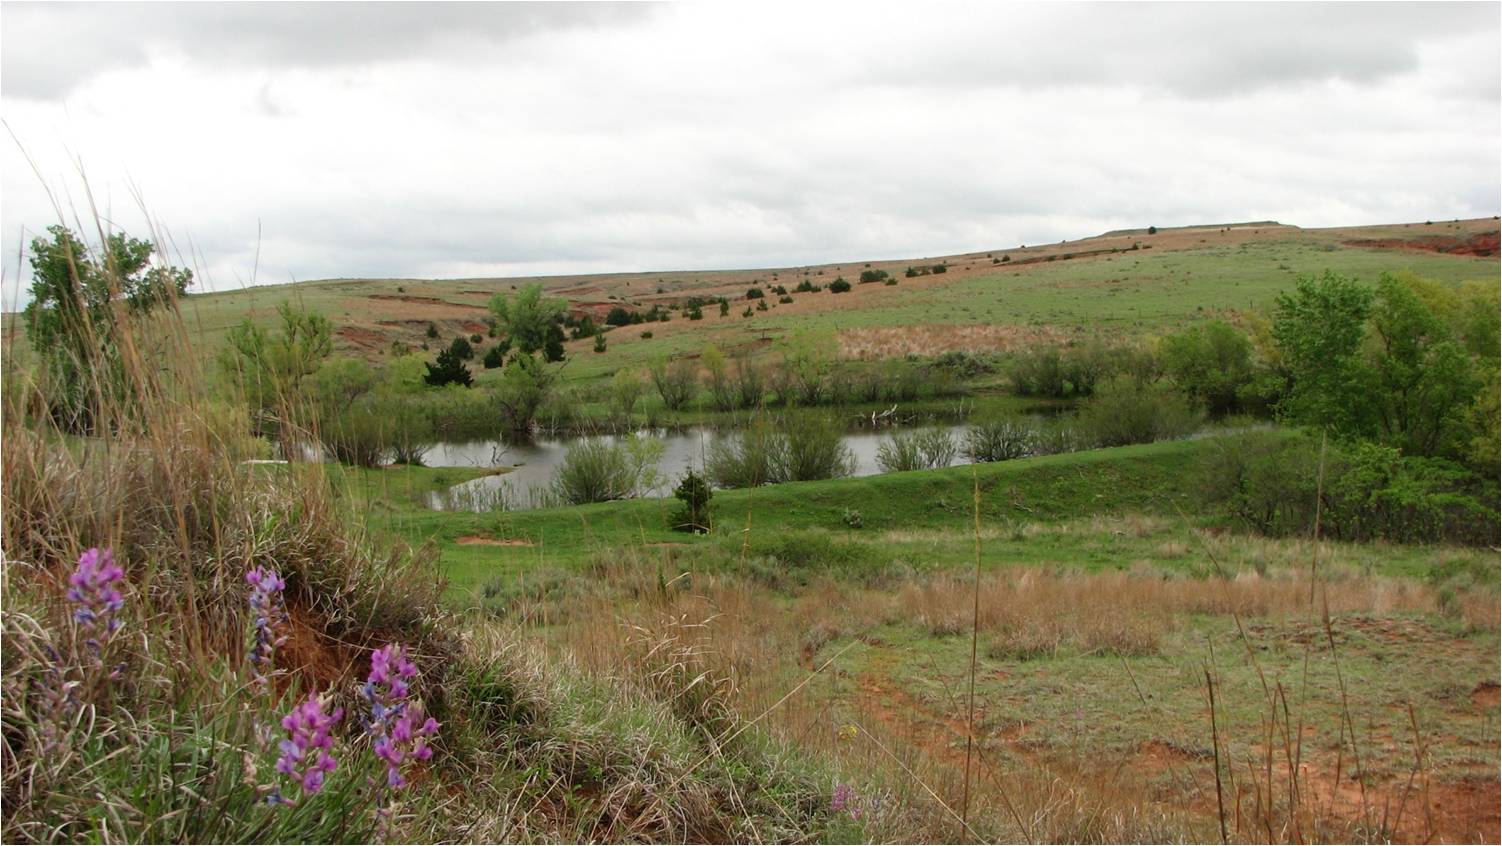
Uh oh: 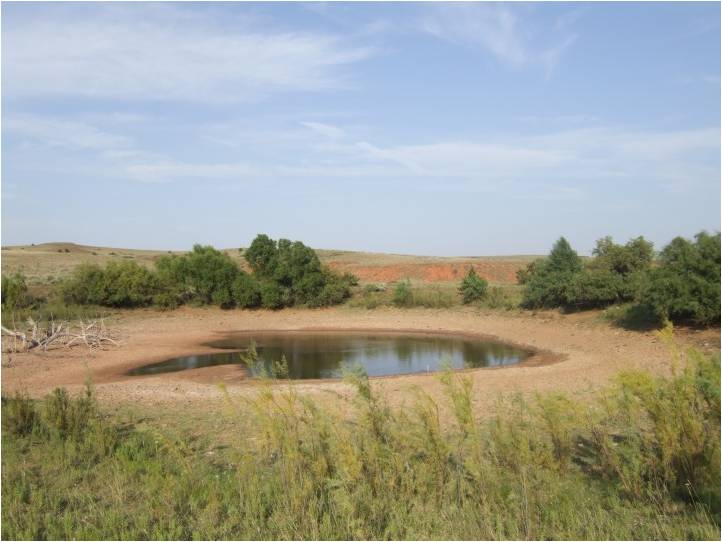
Nothing bitin': 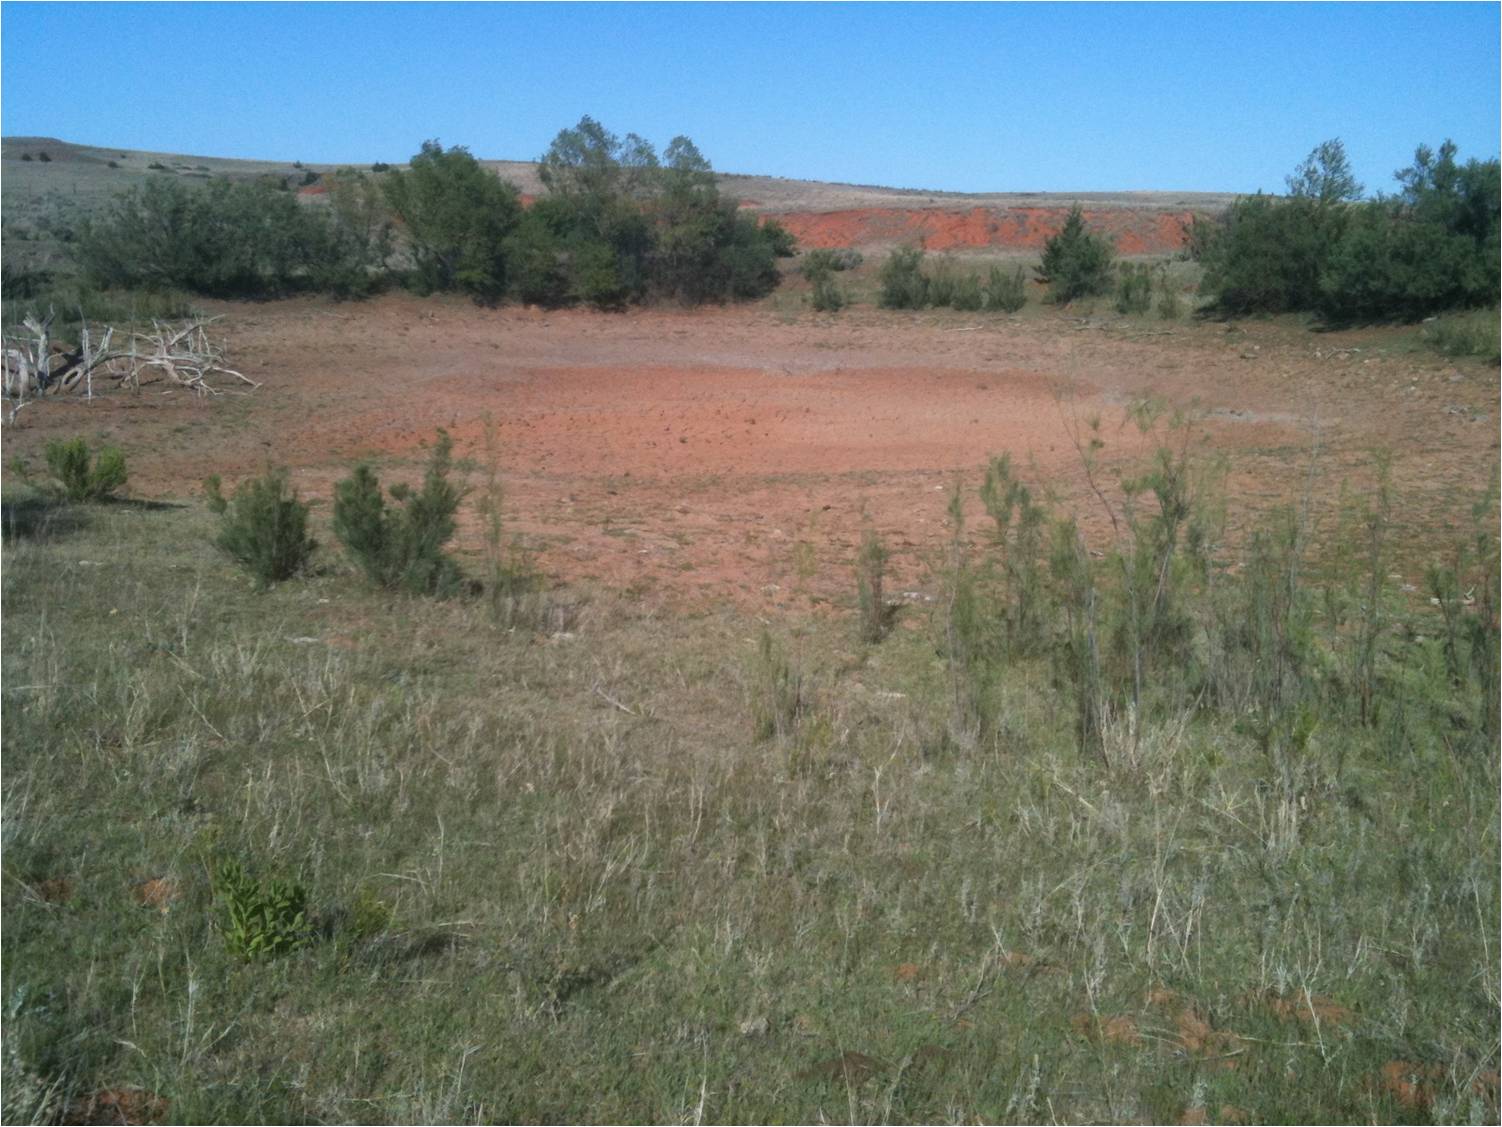
Pave it: 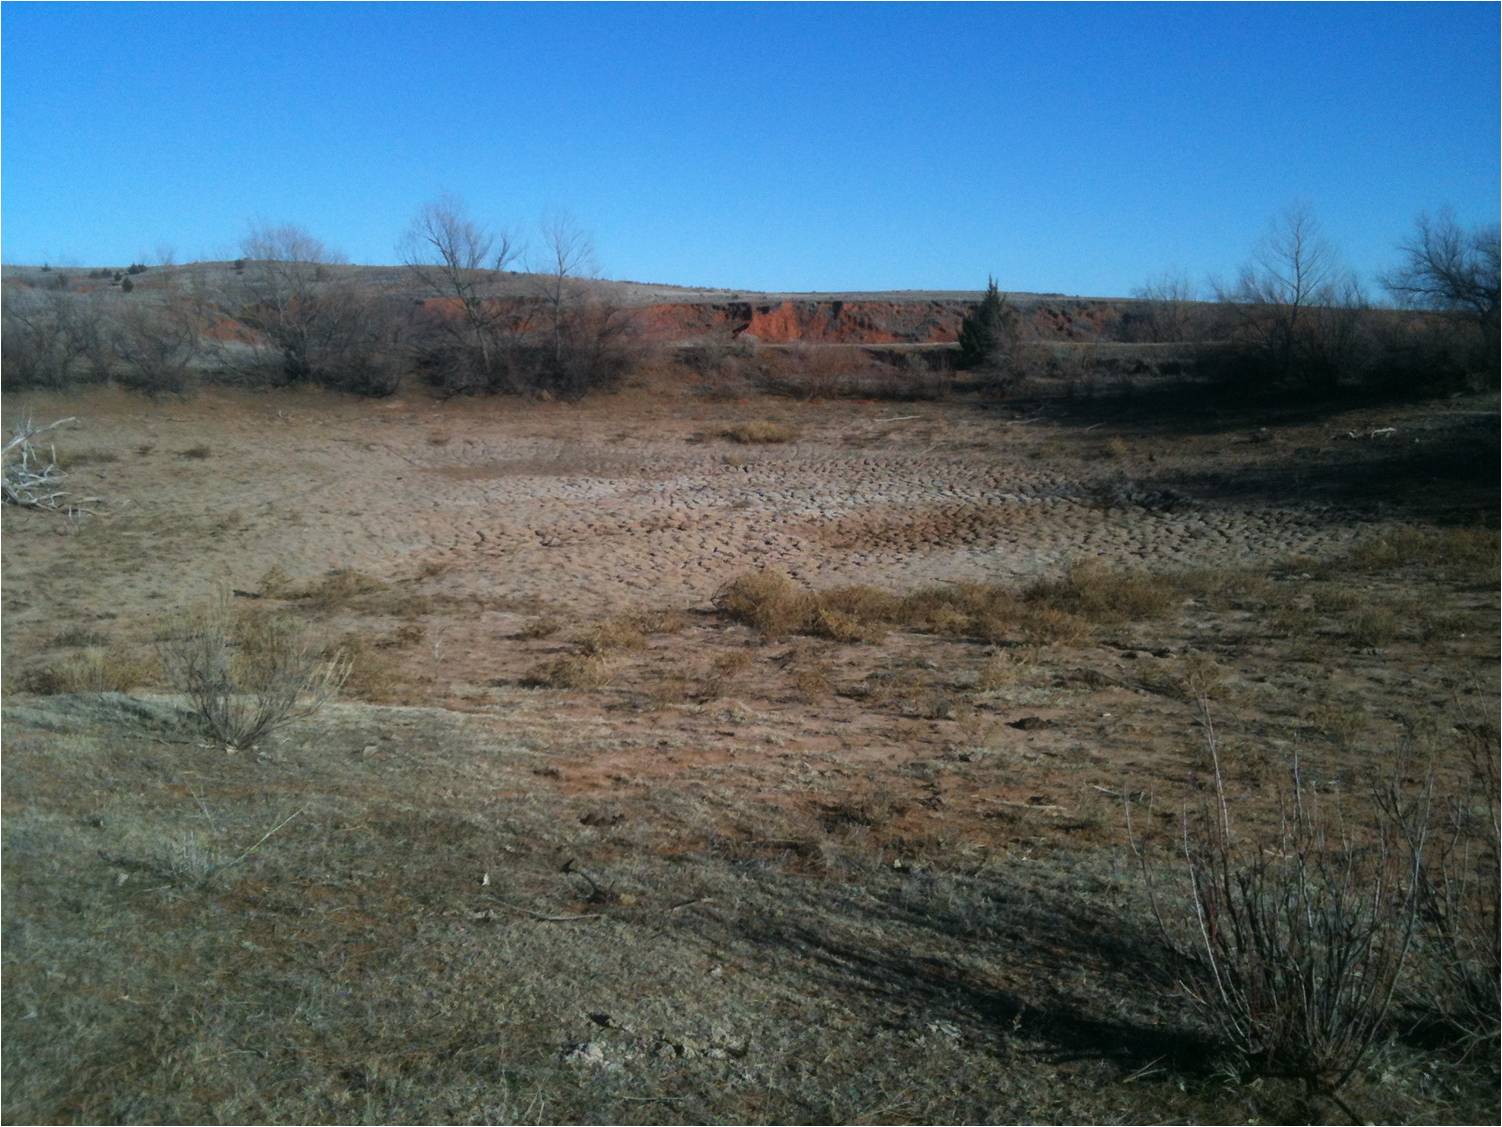
Now my purpose here is not to be a Debbie Downer, but it is always important to
remember our neighbors that are still in the midst of a pretty severe and
cantankerous drought. That's the Okie way.
One final question ... why the heck is there a Westville in far eastern
Oklahoma???
Gary McManus
Associate State Climatologist
Oklahoma Climatological Survey
(405) 325-2253
gmcmanus@mesonet.org
January 26 in Mesonet History
| Record | Value | Station | Year |
|---|---|---|---|
| Maximum Temperature | 81°F | MANG | 2015 |
| Minimum Temperature | 4°F | BUFF | 2004 |
| Maximum Rainfall | 3.45″ | CLAY | 1994 |
Mesonet records begin in 1994.
Search by Date
If you're a bit off, don't worry, because just like horseshoes, “almost” counts on the Ticker website!