Ticker for February 25, 2011
MESONET TICKER ... MESONET TICKER ... MESONET TICKER ... MESONET TICKER ...
February 25, 2011 February 25, 2011 February 25, 2011 February 25, 2011
It's the Great Drought Update, Charlie Brown
Are you like me (quit laughing!) and you decided to wait up and see how the
90-day percent of normal rainfall maps changed when today's rain was added? No?
That's okay, excitement like that is not for the faint-hearted. Or those with a
life for that matter.
The first real rainfall in quite some time fell at my house Thursday morning
(not counting the meltage - yes, new word - from those abominations known as
"snowstorms" during the first two weeks of the month). While we probably
received a good half-inch here, some parts of the state got much more, as
evidenced by the Mesonet rainfall map:
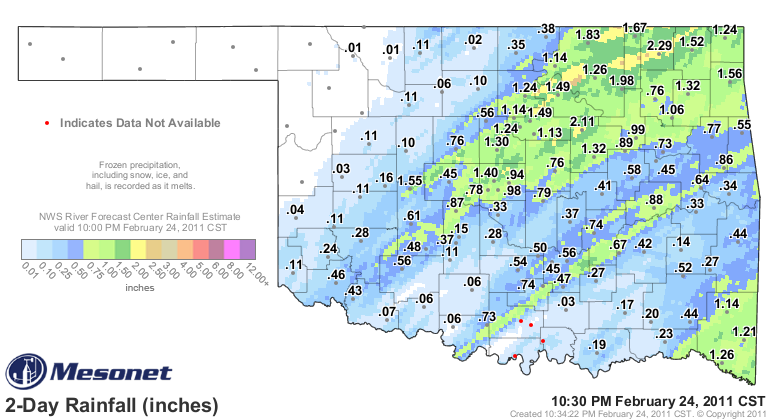
As you can see, a good chunk the I-44 corridor and points north received between
1-2 inches of rainfall. A few localized areas had totals nearing the 3-inch mark.
Compare those totals to the latest U.S. Drought Monitor map, released Thursday
morning, and you can see that those areas made some headway on the drought
conditions. That is especially true in the northeast where the previous snowfalls
had already provided 1-2 inches of moisture.
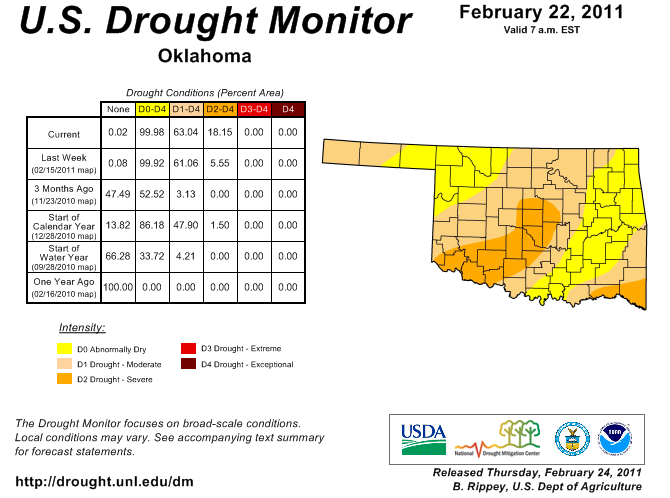
Nevertheless, the drought remains for much of the state, especially those areas
to the south and west of Oklahoma City where the drought was labeled "severe"
and "moderate" by the U.S. Drought Monitor. Even with Thursday's rains, the
last 90 days in west central Oklahoma are the driest such period (Nov 27-Feb 24)
since 1921. Central and southwestern Oklahoma are not much better with a
second- and third-driest ranking for the same period. The statewide average
gets a fifth driest ranking.
Here are the rather gruesome statistics:
Climate Division Total Rainfall Departure Pct of Normal Rank
Panhandle 0.60" -1.27" 32% 8th Driest
N. Central 0.86" -2.77" 24% 3rd Driest
Northeast 3.23" -3.24" 50% 14th Driest
W. Central 0.57" -2.70" 18% 1st Driest
Central 1.99" -3.34" 37% 2nd Driest
E. Central 4.08" -3.95" 51% 10th Driest
Southwest 0.76" -3.19" 19% 3rd Driest
S. Central 3.99" -2.55" 61% 21st Driest
Southeast 6.39" -3.82" 63% 13th Driest
Statewide 2.46" -2.97 45% 5th Driest
What's that look like on a map? Looks like Bedlam ... lots of orange and red.
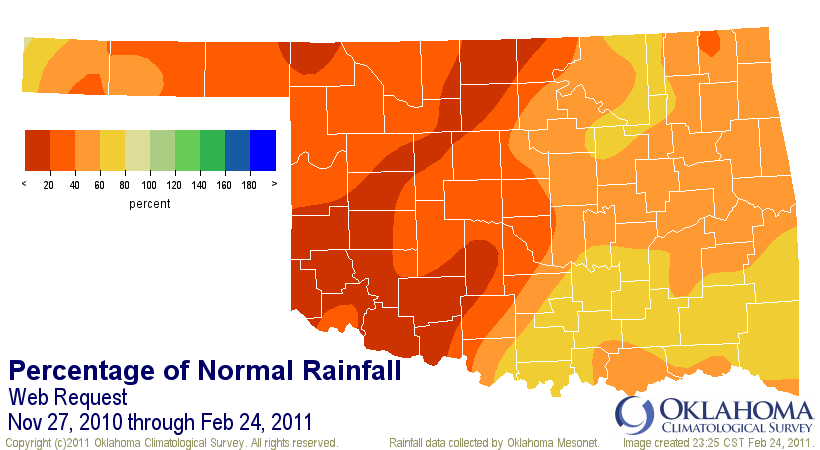
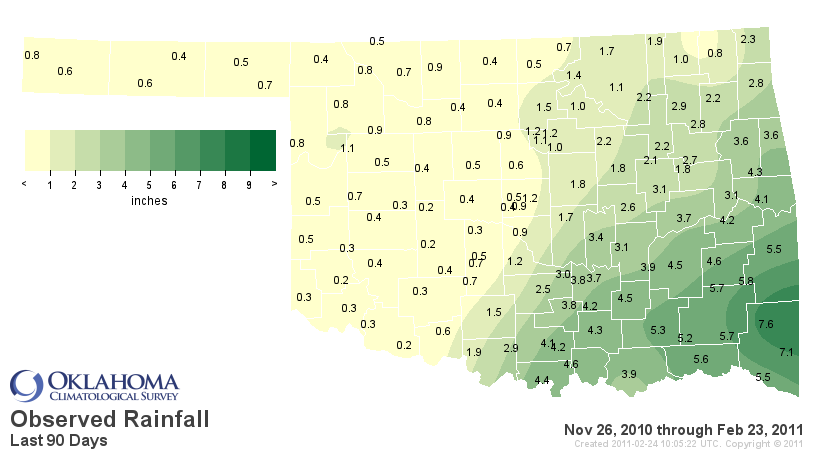
We need to keep in mind that these maps are a bit of an under-estimate because
of the difficulty of accurately measuring the liquid water content of snow,
especially blowing snow, by the Mesonet. The totals are not drastically off,
however.
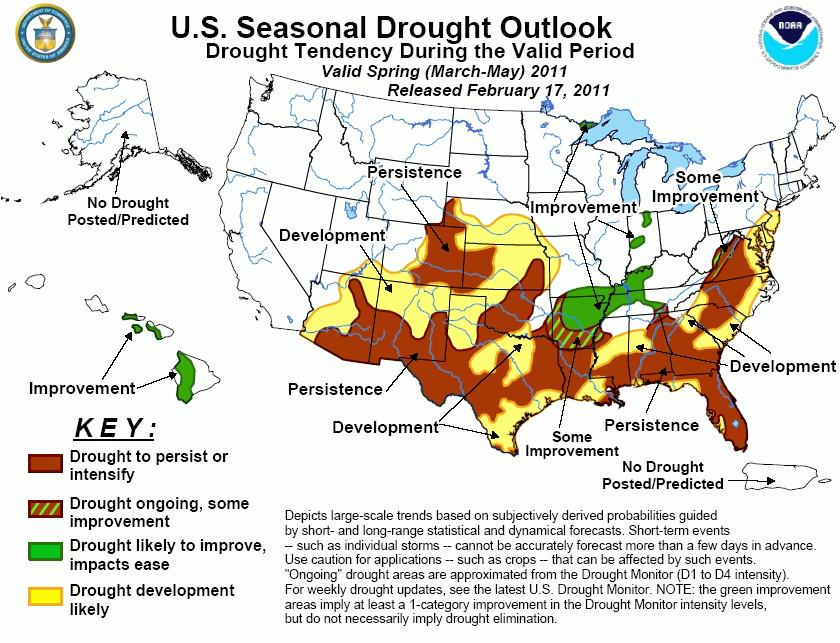
Are there good chances of widespread relief? Not according to the Climate
Prediction Center. They still indicate persistence/intensification/development
of drought in the western two-thirds of the state:
So there you have it, the ugly truth. Mine's a mirror, but for the Oklahoma
wheat farmer, it's the 90-day departure from normal rainfall map. Those that
got the abundant rains are lucky. It's a good start for many, but much more
is needed.
Gary McManus
Associate State Climatologist
Oklahoma Climatological Survey
(405) 325-2253
gmcmanus@mesonet.org
February 25 in Mesonet History
| Record | Value | Station | Year |
|---|---|---|---|
| Maximum Temperature | 85°F | HOLL | 1999 |
| Minimum Temperature | -2°F | CHER | 2003 |
| Maximum Rainfall | 1.79″ | KIN2 | 2013 |
Mesonet records begin in 1994.
Search by Date
If you're a bit off, don't worry, because just like horseshoes, “almost” counts on the Ticker website!