Ticker for March 8, 2010
MESONET TICKER ... MESONET TICKER ... MESONET TICKER ... MESONET TICKER ...
March 8, 2010      March 8, 2010      March 8, 2010      March 8, 2010


Big Storms Today!

And you know what that means! Whenever there is a chance for big storms, you
can count on the Ticker staff to provide you with the latest ... climate
information. (Oh yeah? Same to you!)

We'll go back to reporting weather tomorrow when we have rain totals and max
wind gusts and all that good stuff. Although by then I guess it will be climate
information. Go figure. Until then, we have a bit more on this crazy blocking
pattern that has disrupted our winter variability west of the Rockies. In
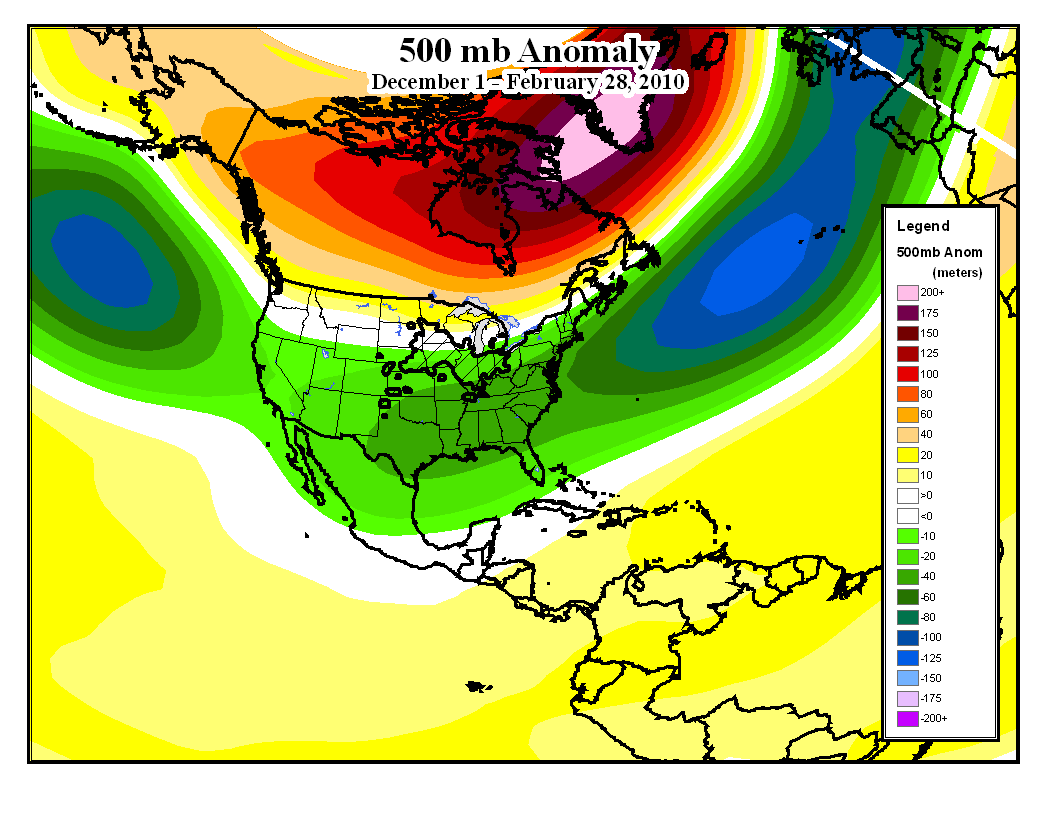
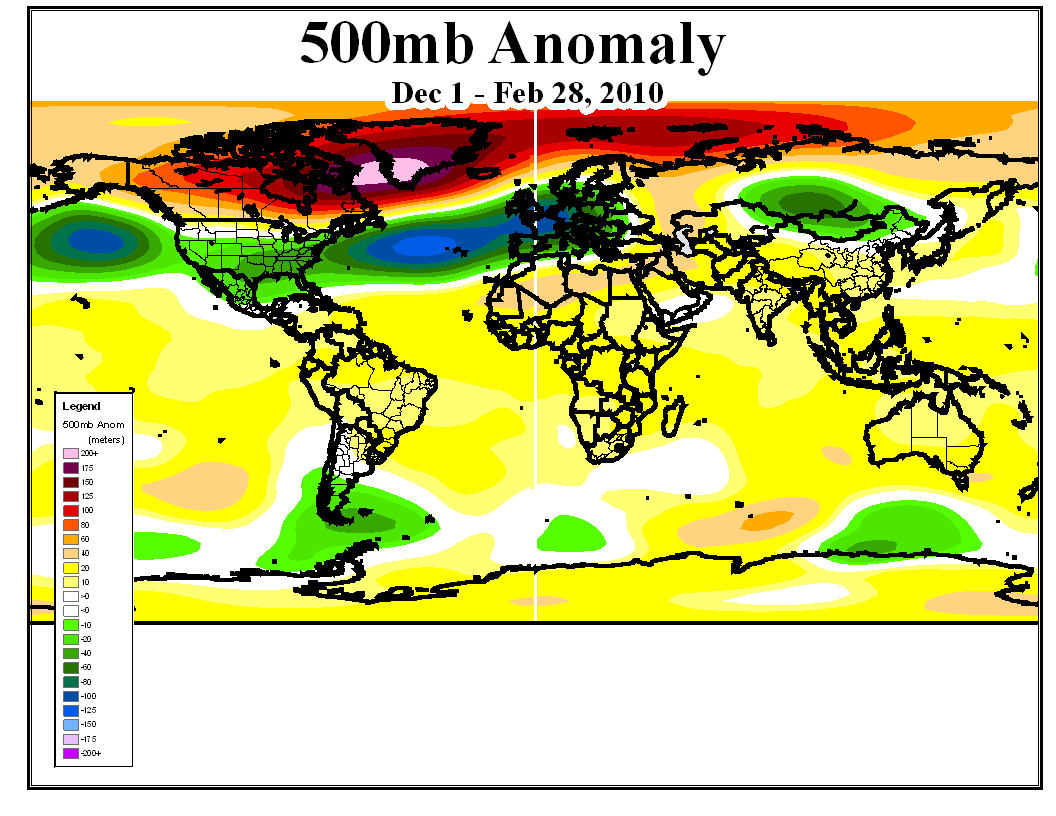
fact, it's probably best described with a couple of pictures. Below you see
the December-February 500 mb anomaly patterns for the North America region and
the entire globe.


That pattern is a classic blocking scenario associated with the negative
phase of the North Atlantic Oscillation (NAO), with abnormally high pressure
centered over the far North Atlantic and lower-than-normal pressure across the
central North Atlantic. Since it is located close to the steering level for
storms, it effectively "blocks" and shifts storms and cold air masses.

It is that blocking pattern that helped give parts of the Southeast and the
Mid-Atlantic regions their snowiest winters on record. And along with El Nino,
helped give the entire southern U.S. one of the most active winter weather
patterns in quite some time.

Historical climate records indicate that heavy snow events along the East
Coast correlate quite strongly with negative phase NAO episodes. For the
southern U.S. (places like Dallas, for instance), the correlation with El Nino
is stronger. However, they more than likely acted in concert to give both areas
a cool and wet (snowy) winter.

For the "in a nutshell" version, here's how I look at it. Both El Nino and the
NAO are part of natural climate variability. The two combined, however, to form
an extreme climate event. For the record, the events of this winter are not
part of any sort of climate trend or change. They are exactly what they seem
to be, extreme events due to natural climate variability.

Okay, now that I've killed all the excitement and joy of the storms today, I'll
sign off. For those of you that really want to get your climate geek on, please
continue reading below for a comparison/contrast of the NAO and the AO.

Anybody want to go El Nino chasing?

Gary McManus
Associate State Climatologist
Oklahoma Climatological Survey
(405) 325-2253

AO/NAO Madness

You may remember our Ticker of a couple weeks ago explaining our severe winter
( http://ticker.mesonet.org/select.php?mo=02&da=24&yr=2010 ). We have a bit more
info on the Arctic Oscillation, including a clarification. While it was not
incorrect to have used AO in our explanations, it would probably have been a bit
safer to use the the NAO instead. They are very strongly correlated, but the
NAO is viewed as a regional representation of the hemispheric AO. The Climate
Prediction Center focused on the AO since the cold anomalies extended into
Europe and Asia. Just a bit of confusion there.

I queried Marty Hoerling, NOAA climate dynamics researcher at ESRL in Boulder,
further on the subject and received an excellent bit of information that I
would like to share with you:

"The scientific debate, which doesn't detract from the practical meaning of an
extreme negative index value of the AO and NAO as occurred in this winter, is
whether the AO is mainly a statistical feature, and not a physical mode of how
the climate varies.

The nutshell summary of this debate is that the AO is neither annular (i.e,
Pacific and Atlantic basin jets are not both intensified during AO extremes),
nor is it an spatially coherent oscillation (i.e., the Pacific and Atlantic
centers of variance that define the mid-latitude portion of the AO are
temporally uncorrelated). The AO does, however, describe a statistical pattern
which explains the largest fraction of the monthly variability of the NH sea
level pressure.

Importantly, the AO is not a teleconnection pattern, whereas the NAO is a
teleconnection pattern. This distinction is key from a prediction and an
attribution perspective, and is why the NAO is preferred. In atmospheric
science, a teleconnection refers to climate anomalies related to each other at
large distances. The historical identification of such linkages serves as a
building block for understanding climate variability.

In addition to the NAO teleconnection (out-of-phase correlation between SLP
near Iceland and the Azores), other examples are the Southern Oscillation
(relation between SLP in the western and eastern tropical Pacific), and the
Pacific-North American teleconnection. These teleconnections, often first
discovered via data analysis of time-averaged atmospheric data (monthly means),
have come to be understood dynamically using theory and complex models. The
teleconnections themselves then tells us much about the potential for weather
and climate predictability."
March 8 in Mesonet History
| Record | Value | Station | Year |
|---|---|---|---|
| Maximum Temperature | 84°F | HOLL | 2002 |
| Minimum Temperature | 7°F | SEIL | 2008 |
| Maximum Rainfall | 3.01″ | BESS | 2016 |
Mesonet records begin in 1994.
Search by Date
If you're a bit off, don't worry, because just like horseshoes, “almost” counts on the Ticker website!