Ticker for June 5, 2008
MESONET TICKER ... MESONET TICKER ... MESONET TICKER ... MESONET TICKER ...
June 5, 2008       June 5, 2008       June 5, 2008       June 5, 2008


Pinwheels: Made for Rotation

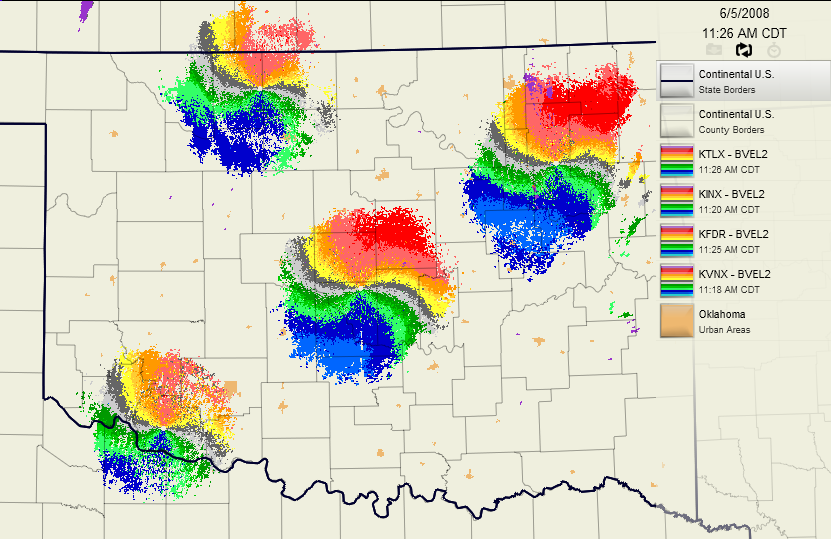
This map, from late this morning, of Doppler Radar base velocities
contains a tip-off for the severe-weather potential that we are
realizing today:


First of all, what in the heck are those pinwheels surrounding the
four Oklahoma-based radars?

The colors are indicative of motion in the atmosphere: warm colors
(reds, oranges, yellows) indicate particles moving *away* from the
radar (the particles are "showing their taillights" as they scoot
away from the radar. Cool colors (blues, greens) show inbound
particles, moving toward the radar.

Each of the four stations shows the same pattern: roughly half of
the scope shows the red-orange-yellows of outbound particles, while
roughly the other half shows the blues-greens of inbound particles.

But what's more important are the gray shades in an S-shape. At these
locations, airborne particles are neither getting closer nor further
from the radar: in other words, they are flying directly across the
radar beam (from greens to reds, in fact).

These S-shapes *are* the tip off for strong directional wind shear
in the lower part of the atmosphere. So, how does an S-shape
indicate directional shear? And what is directional shear, anyway?

Let's answer the second question first: directional wind shear is a
lot like it sounds: the changing of wind direction with height. And
it's important to severe weather because highly-sheared environments
support rotating, tilted updrafts. Rotating, tilted updrafts tend to
be longer-lived and have the capacity to produce higher-end severe
weather, like very large hail and (occasionally) tornadoes.

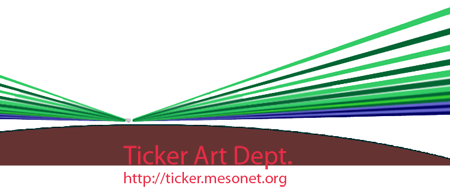
Now back to that first question: how does the S indicate directional
shear? It's because radar beams get higher off the ground the further
you get from the radar. This is because the beam is slightly elevated
from horizontal to begin with and because the earth's curvature
actually helps "bend" the surface away from the radar beam:


(notice how even the lowest radar beam gets higher off the ground
with distance)

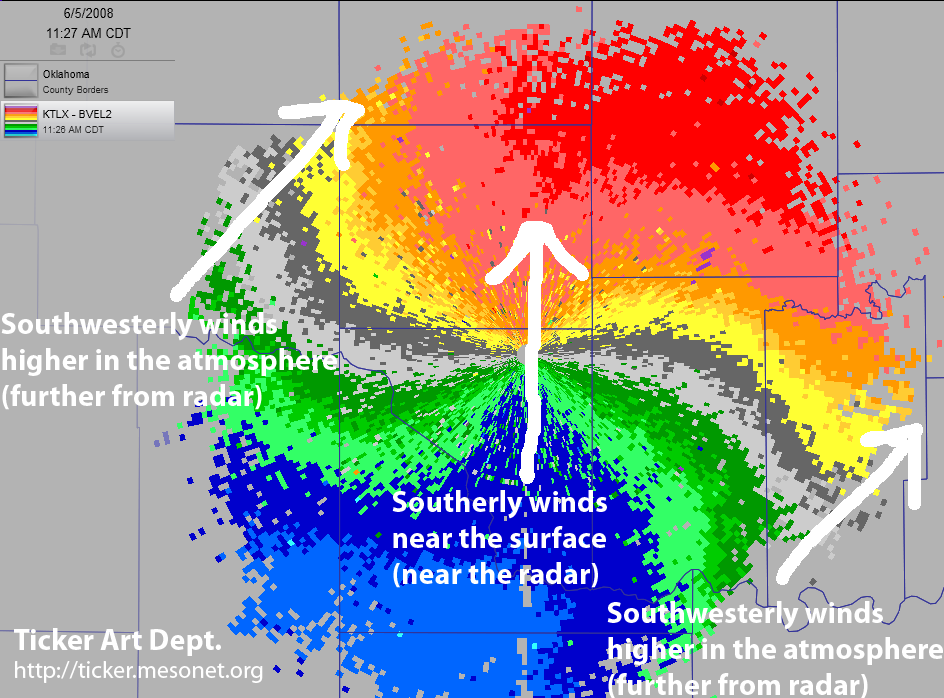
Anyway, what all this means is: the further you are from the radar,
the higher you are off the ground. In the context of the "pinwheel"
image, it means that near-surface winds are out of the south (blowing
from greens to reds across the radars themselves). However, higher up
in the atmosphere (further away from the radar) the gray lines are
oriented more northwest-southeast, indicating southwesterly winds.

Here's a marked-up map zoomed into one of the radars. It's a little
more informative:


Some additional notes about radar-indicated environmental shear:

1. The wind shear that we're looking at is about the large-scale
environment, and not any individual storm. It addresses the
question "Is the atmosphere in the mood to support rotating
storms?" and has nothing to do with "Is a particular storm
rotating?"

2. Wind shear is only one of the several ingredients that need
to come together to produce severe weather. In other words,
wind shear alone will produce nothing. Forecasters pay attention
to many other factors, but strong wind shear will often ramp up
the potential for long-lived, rotating storms.

3. Finally, there are better tools than radar velocities to diagnose
wind shear (but none of them are nearly as pretty).
June 5 in Mesonet History
| Record | Value | Station | Year |
|---|---|---|---|
| Maximum Temperature | 106°F | ALTU | 2006 |
| Minimum Temperature | 42°F | BOIS | 1998 |
| Maximum Rainfall | 4.30″ | LAHO | 2008 |
Mesonet records begin in 1994.
Search by Date
If you're a bit off, don't worry, because just like horseshoes, “almost” counts on the Ticker website!