Ticker for June 21, 2007
MESONET TICKER ... MESONET TICKER ... MESONET TICKER ... MESONET TICKER ...
June 21, 2007      June 21, 2007      June 21, 2007      June 21, 2007


Of Highs and Mins, Part2
(subtitled "We can Seive off the Facts of the Lines")

Yesterday's Ticker looked at the dearth of extreme high Tmax events
in recent decades. Today, we'll look at the flip side, kind of.
Instead of looking at extreme Tmin (low temps) events, we're gonna
look at the flip side of high temperatures. So, today's content has
to do with what might be loosely termed "record cool highs", or the
lowest high temp recorded on a station for a particular day.

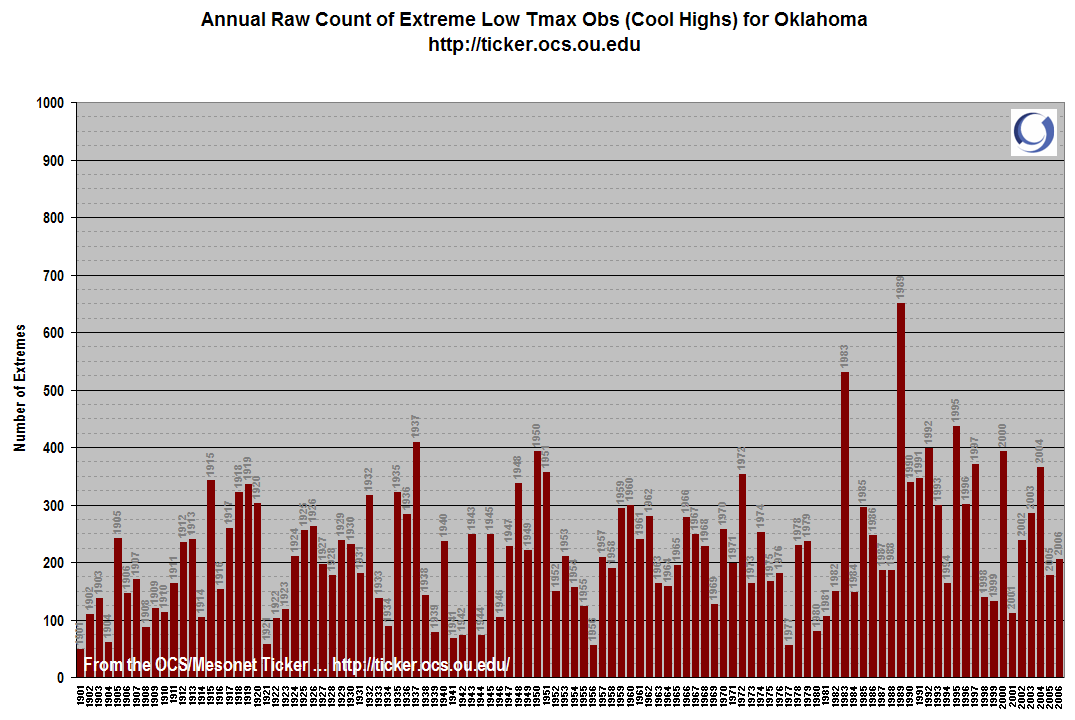
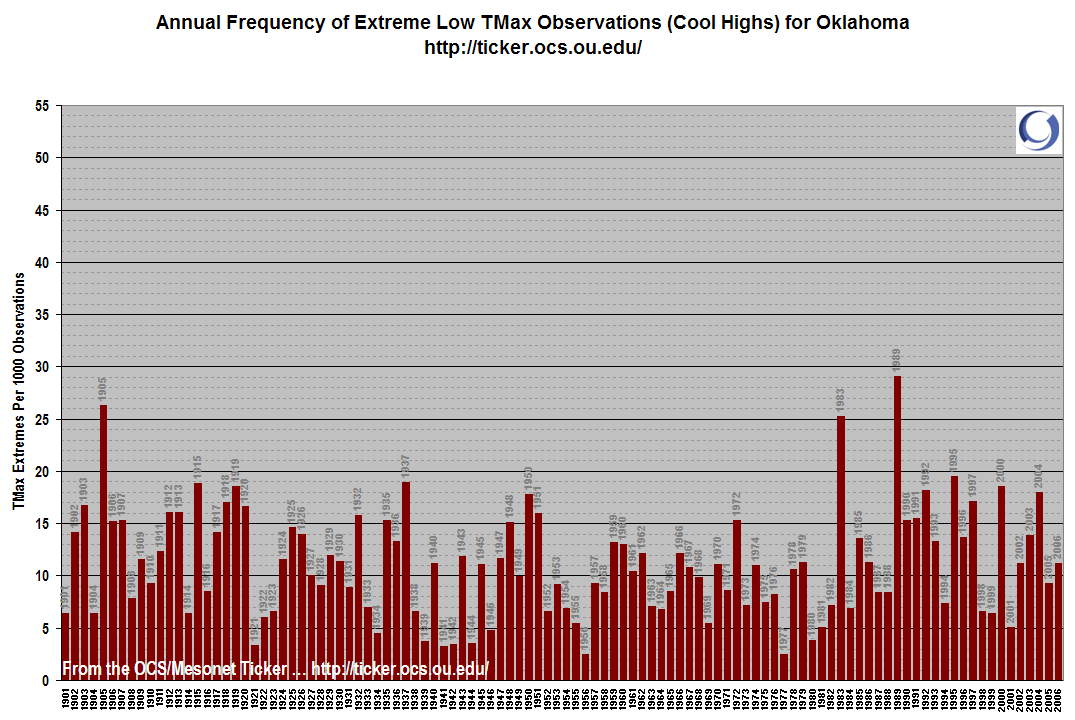
Here are the graphs:


Before we dive into them, a couple more points that apply to these
and yesterday's graphs:

a. These are not a count of records being set or broken. That would
certainly bias the numbers toward earlier years (when records
were broken routinely, due to the very short period of record).
Instead, they are all compiled after the fact. For example, for
July 31st at Ardmore, if the record was originally set in 1901,
then broken in 1906, again in 1922, again in 1928, and finally
in 1975 ... only 1975 would get credit, because it represents the
extreme event.

b. These Ticker graphs don't discriminate within the year. A record
high in December counts as much as a record high in July, even
though the impact on people might seem less. We'll take a peek
at within-year signals later this summer.

Make sense? Let's hit today's graphs.

First of all, they seem to indicate no real linear trend (a simple
increase or decrease over time), especially in the partially-corrected
frequency-of-event graphs (details in yesterday's Ticker). However,
they do show a striking wave pattern over time. At first glance, it
appears that every other decade has slightly more (or less) of these
Lo-Tmax events than the previous.

1905, 1983 and 1989 stand out as three years that had an abundance
of extremely low high temps. Possible explanations are:
* The winter of 1905 was quite cold.
* December 1983 contained possibly the most anomalous cold snap
in state history (if you were here, you remember it!).
* 1989 had a very cool, wet summer.

Anyway, putting yesterday's and today's graphics together, we can
tentatively assert that high temperature trends are careening toward
moderation. There seem to be fewer extreme-warm events in recent
decades (last year is an exception worth noting), and there seems to
be no apparent linear trend in the number of extreme-cool highs.
There does seem to be a decadal-scale cyclic pattern in high temps,
which is particularly clear in today's data ("record cool highs").

Of course, this is a very limited look at things; first, it's confined
to Oklahoma, and second, it ignores the tremendous variations that
occurred before 1900, largely due to the lack of a rich instrumental
record.

Oh, speaking of record low events: we apologize to Steinbeck, George
and Lennie for our horrendous title. Our headline editor has been
reprimanded.
June 21 in Mesonet History
| Record | Value | Station | Year |
|---|---|---|---|
| Maximum Temperature | 107°F | HOLL | 1998 |
| Minimum Temperature | 52°F | KENT | 2004 |
| Maximum Rainfall | 6.57″ | COOK | 2000 |
Mesonet records begin in 1994.
Search by Date
If you're a bit off, don't worry, because just like horseshoes, “almost” counts on the Ticker website!