Ticker for June 20, 2007
MESONET TICKER ... MESONET TICKER ... MESONET TICKER ... MESONET TICKER ...
June 20, 2007      June 20, 2007      June 20, 2007      June 20, 2007


Speaking of Extreme Heat

A popular topic of contemporary discussion is the specter of
increased numbers of extreme events in our climatic future. Well,
there are lots of different ways to define "extreme events", and
we won't pretend to visit them all, but based on the overwhelming
response to last week's climate correlations (thanks again, Mom),
we're gonna run some more climate graphs.

(waiting for the stampede of mouse-clicks away from the Ticker ...
and ...)

Okay, thanks for sticking around. Over the next few weeks, on the
days that Mother Nature throws boring weather at us (banality is
the reality of summer seasonality), we'll look at something much
more tangible than those obscure T-P correlations. We'll count up'
the number of extreme daily events that have occurred over the years.

By "extreme daily events", we mean, for a given date, which years
were its current "records" set?

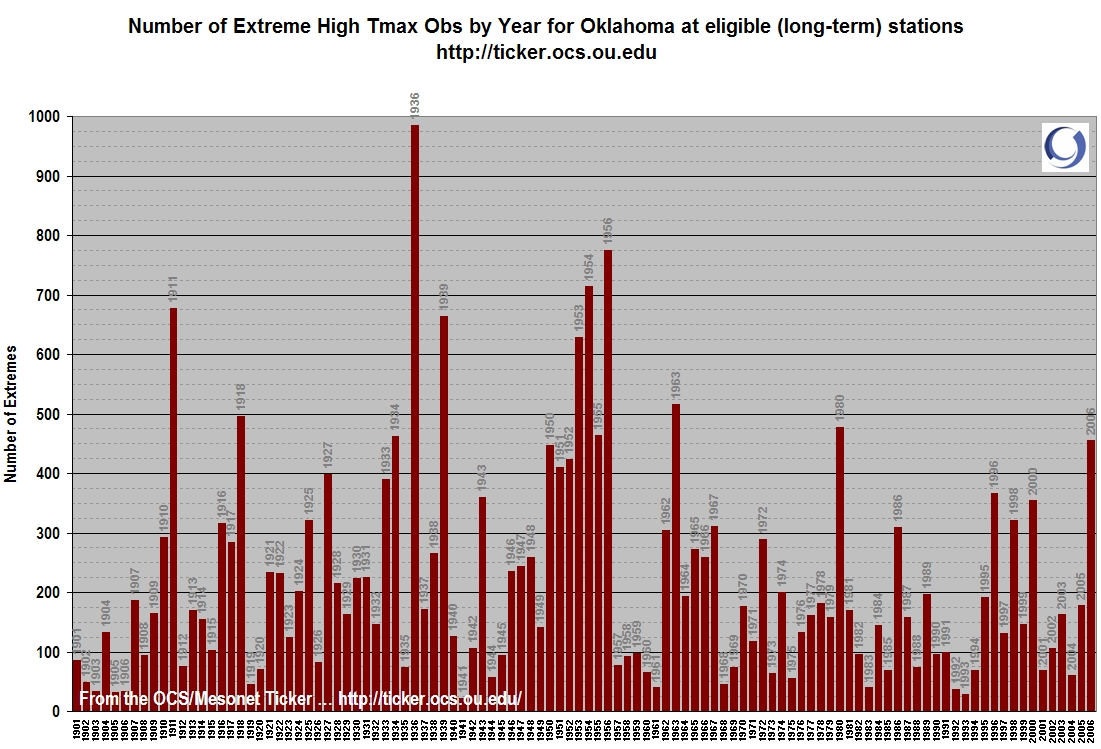
For example, here's a graph that shows the number of "Hi-TMax"
(record highs) set each year since 1901:


A few details about this graphic:

1. A year gets one point for each extreme-hi-TMmax event recorded
on one of it's days. In other words, if January 1's record high
at Altus, Alva and Ada was set in 1936, these would add three
points to 1936's total number of records. If January 2's record
highs at Altus and Alva were also set in 1936, but Ada's was set
in 1943, two points would be added to the 1936 tally, and one
would be added to 1943. Repeat for all eligible stations for each
day of the calendar.

2. Ties are distributed evenly (if the record temp at a station
for July 3 was set in 1917 and tied in 1974, each year gets
half a point).

3. Only long-term stations - whose lives stretch over most of the
106 year period - are considered (it wouldn't be smart to use
stations that were born recently). There are about 65 eligible
stations in Oklahoma's climate history.

4. There weren't as many operational stations at the beginning (or,
sadly, toward the end) of this graphic. This means that the
earliest years have fewer stations, and fewer chances to "score
points" in the total number of extreme events. To (clumsily and
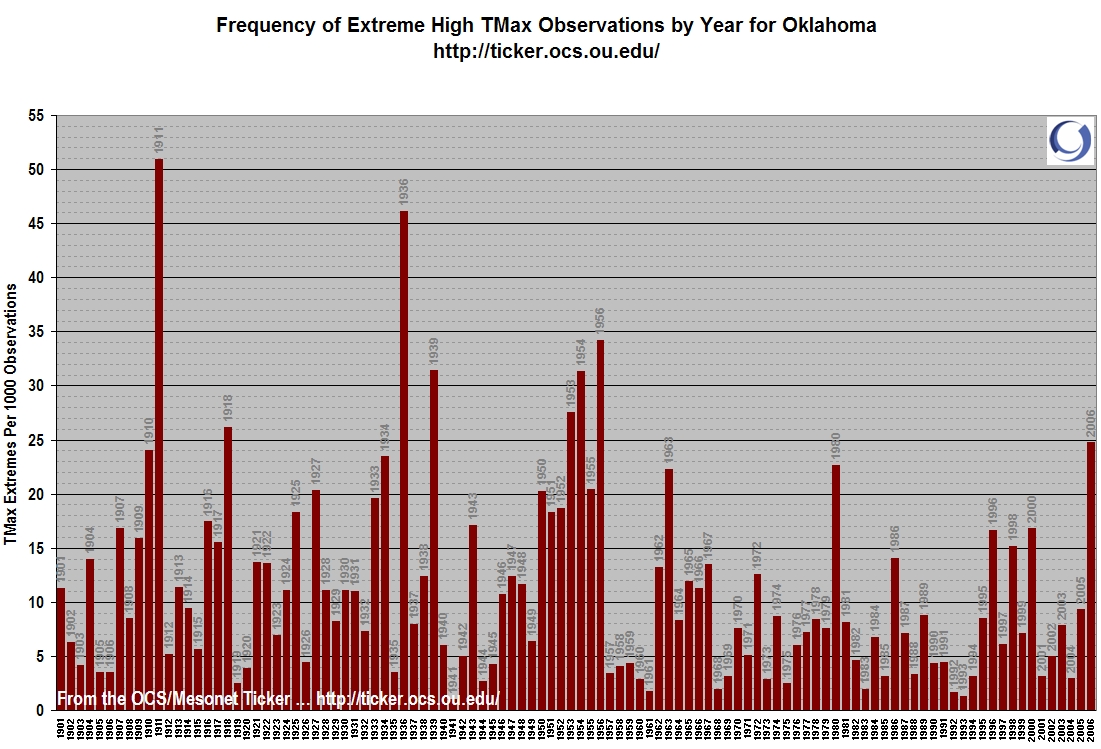
partially) compensate for this, we've added a companion statistic
that shows the rate at which a year's observations set records:


So, for example, for those long-term stations that recorded
daily highs in 1911, an average of 51 of every 1000 obs (5.1%, or
1 out of 20) of those remain the warmest on record for their
station, on that day.

Make sense?

Anyway, now some interpretation:

It's pretty apparent that 1911 and 1936 set the standard for an
individual year wihth lots of record highs. The mid-1950s was a
very consistent period of extreme temps, even if no individual
year produced daily extremes like 1911 and 1936. 1954, the warmest
year on record, didn't feature quite as many extreme events as 1956.
Finally, last year produced more extremes-per-observation than any
year since the mid-1950s. But the competition over that period
wasn't very strong. In fact, the rate of record-setting highs has
been pretty weak for decades now.


The number of extreme hot daily highs has been very slow over the
last few decades, but there's more than one way to set an extreme.
We'll look more at that in future Tickers.


Give 'em What They Want

Big response to yesterday's Ticker, so here's an update, through noon.
31 Mesonet stations (about 1/4 of the network) have already exceeded
their 2006 rainfall totals:

Mesonet       2006      2007      The
Station       Total     So Far    Difference

Burbank       23.93"    33.21"    +9.28"
Apache        23.52"    30.06"    +6.54"
Marshall      22.85"    28.89"    +6.04"
Marena        24.45"    30.39"    +5.94"
Minco         25.55"    31.42"    +5.87"
Stillwater    25.98"    31.71"    +5.73"
Cherokee      16.38"    21.73"    +5.35"
Foraker       24.25"    29.36"    +5.11"
Watonga       23.24"    27.98"    +4.74"
Medford       16.78"    21.39"    +4.61"
Newkirk       26.29"    30.90"    +4.61"
Copan         27.41"    31.97"    +4.56"
Red Rock      24.08"    28.58"    +4.50"
Putnam        18.80"    23.24"    +4.44"
Alva          15.88"    19.71"    +3.83"
Ft. Cobb      21.64"    24.90"    +3.26"
Breckinridge  17.61"    20.78"    +3.17"
Kingfisher    23.88"    26.92"    +3.04"
Fairview      19.64"    22.37"    +2.73"
Perkins       24.90"    27.56"    +2.66"
Erick         20.98"    23.48"    +2.50"
Seiling       17.36"    19.85"    +2.49"
Pawnee        24.01"    26.49"    +2.48"
Woodward      16.26"    18.72"    +2.46"
Guthrie       27.46"    29.27"    +1.81"
Spencer       24.67"    26.47"    +1.80"
El Reno       24.75"    26.54"    +1.79"
Lahoma        18.02"    19.10"    +1.08"
Butler        21.92"    22.87"    +0.95"
Oilton        27.62"    28.29"    +0.67"
Hinton        26.45"    27.06"    +0.61"
June 20 in Mesonet History
| Record | Value | Station | Year |
|---|---|---|---|
| Maximum Temperature | 112°F | MANG | 1998 |
| Minimum Temperature | 52°F | KENT | 2000 |
| Maximum Rainfall | 4.32″ | BOWL | 2007 |
Mesonet records begin in 1994.
Search by Date
If you're a bit off, don't worry, because just like horseshoes, “almost” counts on the Ticker website!