Ticker for January 19, 2007
MESONET TICKER ... MESONET TICKER ... MESONET TICKER ... MESONET TICKER ...
January 19, 2007   January 19, 2007   January 19, 2007   January 19, 2007


You Saw It Here First!

The Ticker is known far and wide for two things: plagiarism and sloppy
editing. But, #3 and #4 might be a love of time traces and a dedication
to finding important climate information. And that's helped us secure
some advance copies of OCS's Oklahoma Climate graphs, thanks to a cozy
relationship with their producer. Years of parking in his driveway,
mowing his lawn, and even taking his family on vacations finally paid
off and he agreed to share them with us before they go public next week.

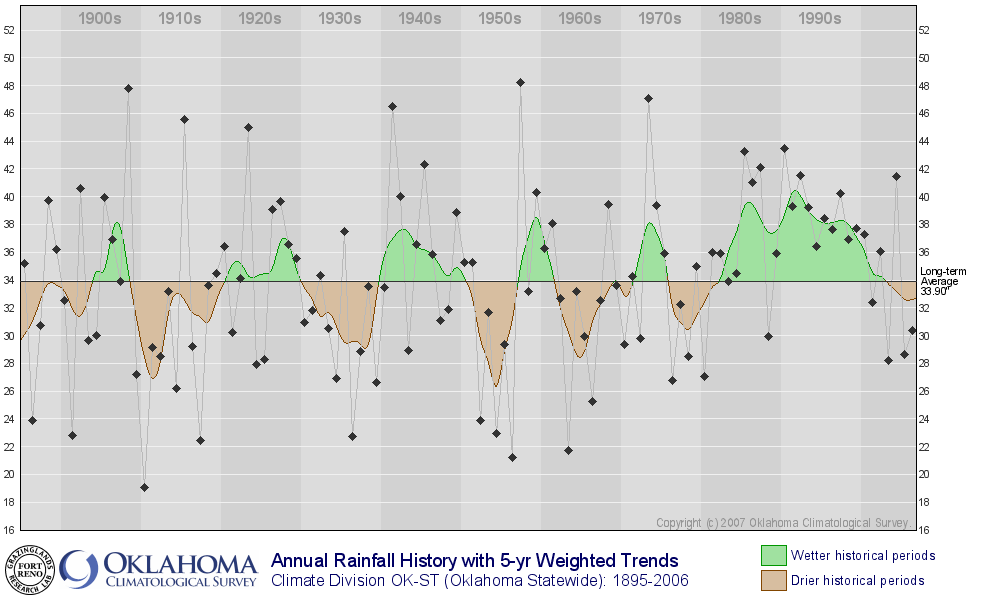
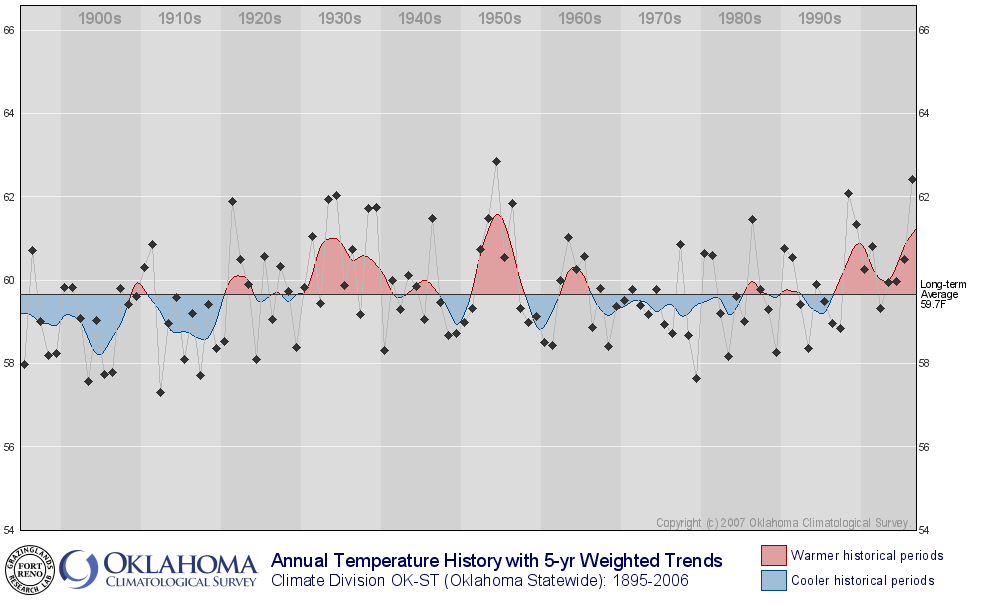
Here they are, complete through 2006:

Precipitation:


Temperature:


Several features jump out of these time series ... foremost is the
cyclic nature of Oklahoma's dry/wet and warm/dry eras. The temperature
pattern seems to show swings on the scale of quarter-centuries, while
the precip patterns follow a roughly decadal pattern.

It's also obvious that the mid-century droughts of the 30s and 50s
up strongly in the temperature patterns (dry equals hot, for these
events). These droughts were dominated by summer episodes, so the
warmth is understandable. The early century drought period of the
1910s was dominated by cool season episodes, so associated heat
is non-existent.

But our picks for the most prominent feature on each graph are:

On the temperature graph, the last decade has been quite warm in
Oklahoma. 2006 was exceedingly so! In fact, it was the second-warmest
year on the state's ledger.

On the precip graphic, much has been said about how wet the 1980s and
1990s were ... and they were quite wet. But that's only scratching
the surface of their bizarre precip behavior. We want to emphasize
that the precip patterns of those decades were remarkably different
in three (3) components:

1. Magnitude. The peak of the multi-year average (the green part)
reaches higher than during any previous era.

2. Duration. The breadth of the feature, in number of years, is
easily the longest of any period, wet or dry, on the graphic.

3. (and this is what we feel is most important and least appreciated)
Consistency. The lack of variability within the wet feature is
absolutely astnoishing. Look at how tightly tthose individual
diamonds are clustered duing the wet 80s and 90s! At no other
time during the trace is the year-to-year precipitation
reliability even remotely close to what we witnessed then.
Only one year during an entire 20-year stretch was
significantly below normal. That is a sea-change of epic
proportions.

We are wading into opinion here, but we believe we were "spoiled",
for lack of a better term by these three factors: the magnitude of our
wet period, the duration of our wet period, and most of all, by the
reliability of our wet period.

The profound wetness allowed many species to thrive like never before
on a historic surplus of water. Many of those species, one of which
is reading this message, are involved in the buildup of conditions
that exacerbate drought and wildfire when the climate swings the
other way.
January 19 in Mesonet History
| Record | Value | Station | Year |
|---|---|---|---|
| Maximum Temperature | 77°F | BURN | 1999 |
| Minimum Temperature | 1°F | KENT | 2001 |
| Maximum Rainfall | 0.66″ | COOK | 2019 |
Mesonet records begin in 1994.
Search by Date
If you're a bit off, don't worry, because just like horseshoes, “almost” counts on the Ticker website!