Ticker for January 25, 2002
MESONET TICKER ... MESONET TICKER ... MESONET TICKER ... MESONET TICKER ...
January 25, 2002 January 25, 2002 January 25, 2002 January 25, 2002
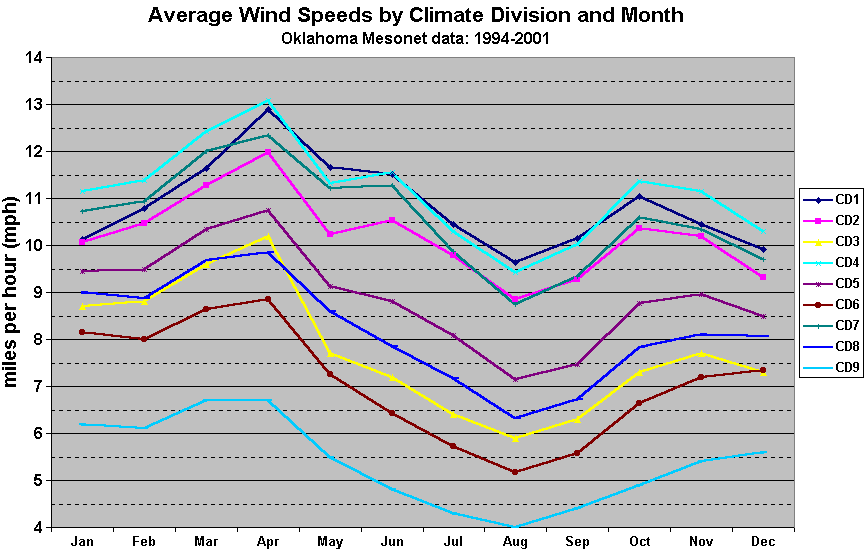
Oklahoma Wind Speeds Show Seasonal and Spatial Trend
The following graphic shows average wind speeds for each month of the
year, for each of Oklahoma's nine climate divisions:

( The 9 CDs:  )
)
The graphic shows two distinct signals:
1. An east-to-west gradient in average wind speed across the state.
The eastern climate zones (3,6,9) show the smallest wind speeds,
while the western zones (1,4,7) show the greatest. A number of
factors influence this pattern, including terrain, frequency of
dryline penetration, the common position of the nocturnal
low-level jet, and the general synoptic climatology of the region.
2. A bimodal time pattern peaking in spring, then again in autumn.
These are the times of change at our latitude, when the jet stream's
migration ushers frequent transitory systems through our neck of the
woods.
But that's just the very beginning of all the climatological fun one
can have, even with just eight years of high-density data. Next week
we'll look at how wind speeds vary by time-of-day across Oklahoma.
January 25 in Mesonet History
| Record | Value | Station | Year |
|---|---|---|---|
| Maximum Temperature | 77°F | MADI | 2005 |
| Minimum Temperature | 7°F | VINI | 2019 |
| Maximum Rainfall | 3.32″ | MTHE | 2012 |
Mesonet records begin in 1994.
Search by Date
If you're a bit off, don't worry, because just like horseshoes, “almost” counts on the Ticker website!