Ticker for December 14, 2022
MESONET TICKER ... MESONET TICKER ... MESONET TICKER ... MESONET TICKER ...
December 14, 2022 December 14, 2022 December 14, 2022 December 14, 2022
NEXT!
Well that will about cover severe weather, am I right? I mean, before yesterday
there had been 30 confirmed tornadoes in December across Oklahoma dating back to
when the most accurate records began in 1950...and now there have been at least
31. The EF-2 tornado that struck Wayne early yesterday was #31, of course, and
rated as such by survey teams from NWS Norman. Just a quick jaunt down the
interstate from their office and where I work (LOL!) at the National Weather
Center on the OU campus. Here are the particulars of their report. AND other
surveys are ongoing to determine if other damage areas were caused by tornadoes
or just straight-line winds.
-------------------------------------------------------------------------------
...NWS Damage Survey for 12/13/2022 Tornado Event...
.Wayne Tornado...
Rating: EF2
Estimated Peak Wind: 120 to 125 mph
Path Length /statute/: 3.0 miles
Path Width /maximum/: 300 yards
Fatalities: 0
Injuries: 0
Start Date: 12/13/2022
Start Time: 05:27 AM CST
Start Location: Wayne / McClain County / OK
Start Lat/Lon: 34.91 / -97.32
End Date: 12/13/2022
End Time: 05:31 AM CST
End Location: 2 NNE Wayne / McClain County / OK
End Lat/Lon: 34.95 / -97.30
Survey Summary:
A tornado developed south of Wayne and move north-northeast through
Wayne. Within the town of Wayne, tree and power line damage was
observed some roof damage. As the tornado moved north-northeast of
Wayne, the roof of a home was removed by the tornado with some
exterior walls damaged. Additional tree and power line damage was
observed farther north-northeast as the tornado approached the
Canadian River.
&&
EF Scale: The Enhanced Fujita Scale classifies tornadoes into the
following categories:
EF0...Weak......65 to 85 mph
EF1...Weak......86 to 110 mph
EF2...Strong....111 to 135 mph
EF3...Strong....136 to 165 mph
EF4...Violent...166 to 200 mph
-------------------------------------------------------------------------------
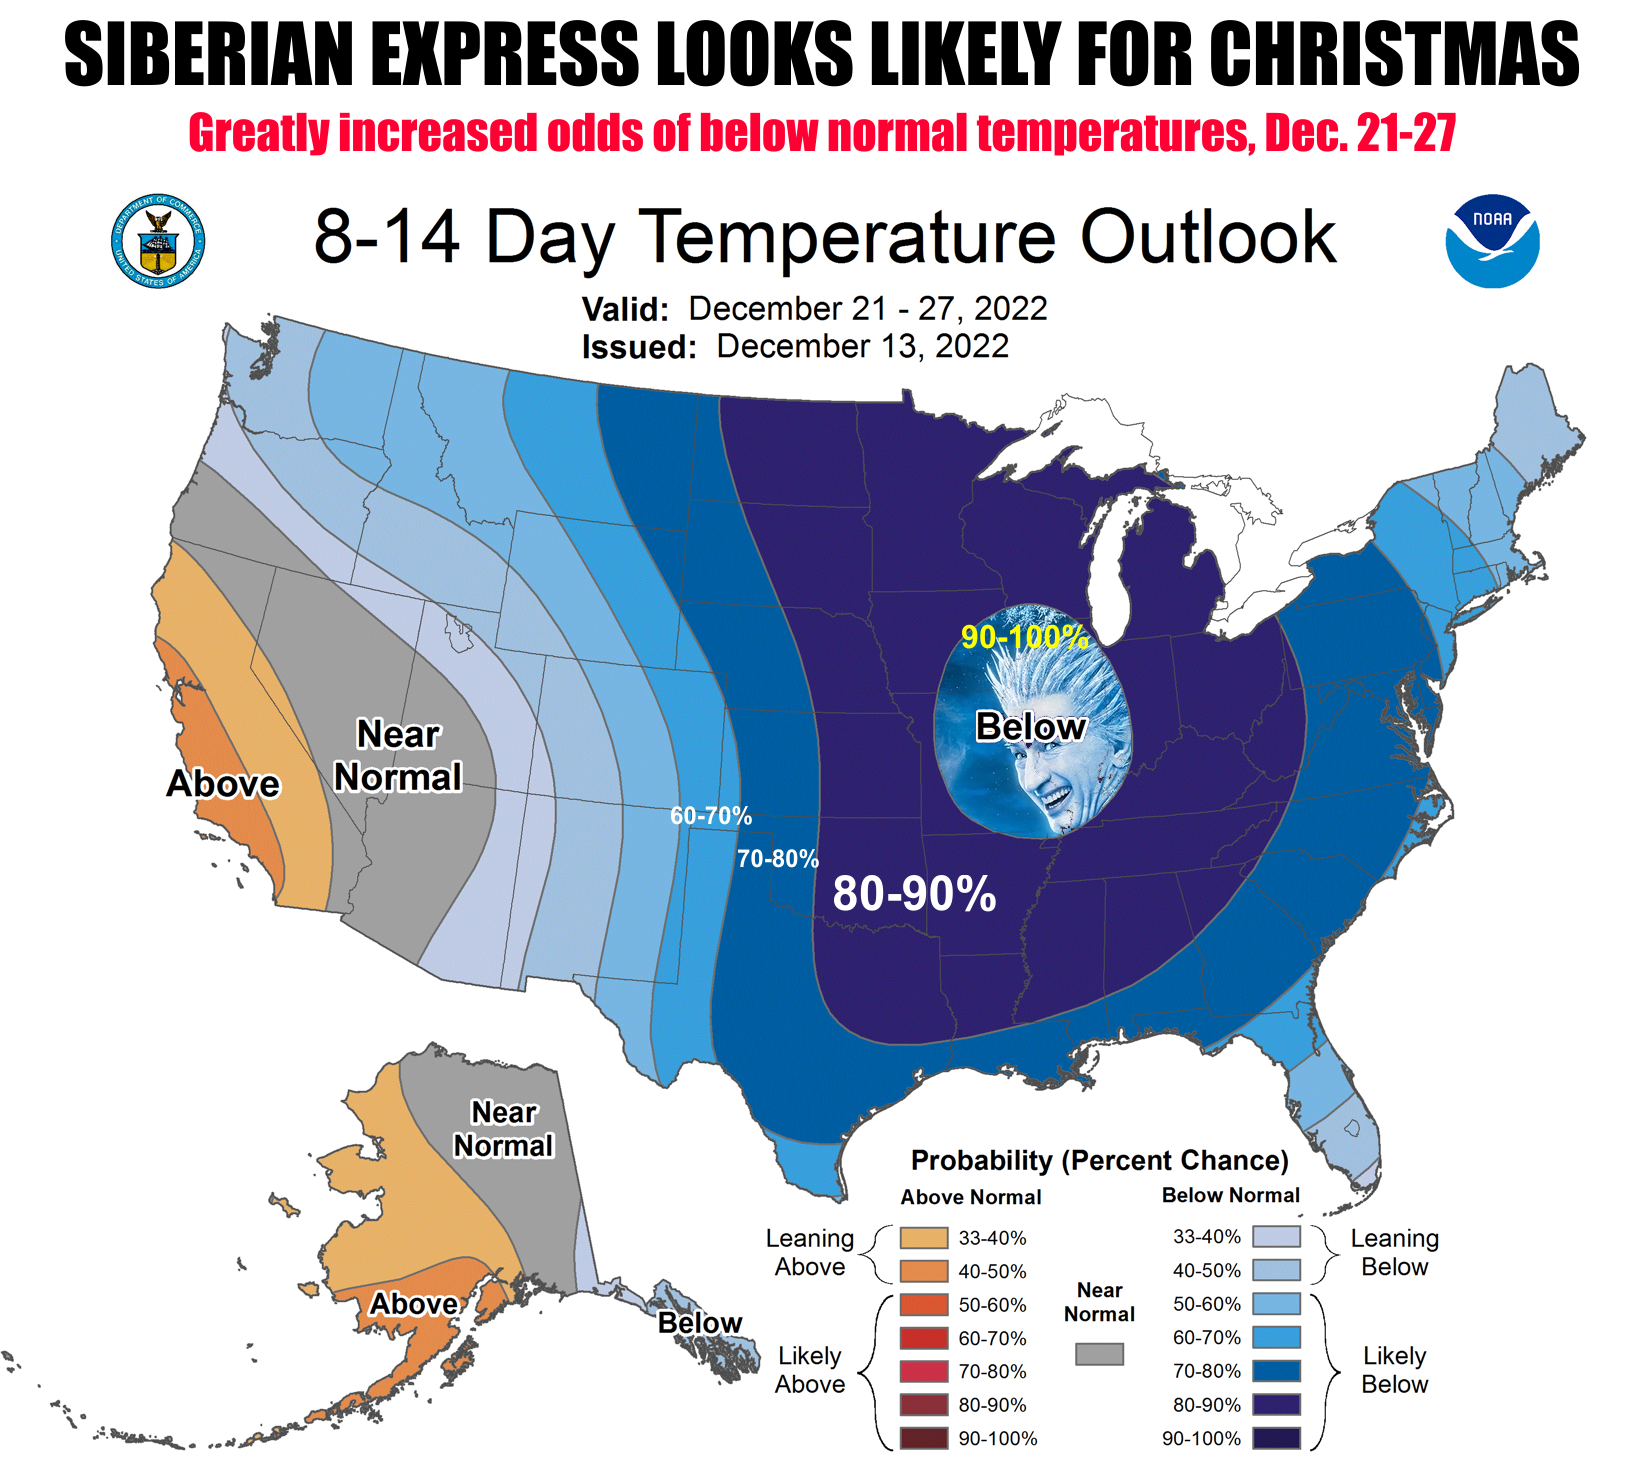
Now let's talk about the 800-lb gorilla (I've heard it called the 900-lb gorilla,
and a few maniacs have used 799-lb gorilla, but I'm sticking with the 800-lb
moniker) in the forecasting room...the cold air outbreak that is looking "LIKELY"
for later next week. Because that's what the top map there shows, right? It
doesn't show magnitudes of the below-normal air, or just how cold it's gonna
get. It shows the odds of temperatures being above-, below-, or near-normal
based on the large-scale synoptic patterns. So it doesn't show "much below
normal," "below normal," or the same for above normal, right? Now you can intuit
(English to Okie translation: "figger out") a few things from the map about
the magnitudes of those temperature anomalies from the overall pattern, but that
doesn't ALWAYS work. So judging by the scope of that area of INCREASED ODDS OF
BELOW NORMAL TEMPERATURES, it seems reasonable to assume that this is a cold
air outbreak from origins to our north, climes which are much colder than ours.
Here is a bit more about CPC's methodology:
The probabilities of all three categories are implied on the map,
and sum to 100%. The forecast probabilities given on the map generally
fall far short of complete confidence (100%) in any single category.
When the probability of the above (A) or below (B) category is greater
than 33.33% by some amount, the probability of the opposite category
declines by that amount, while the probability of the middle category
remains at 33.33%. In the event that the N category is greater than
33.33%, the probabilities of both the "A" and "B" categories is each
reduced by 1/2 the amount that the "N" category exceeds 33.33%. When
the probability of "A", or "B" reaches 63.33% or higher, the odds of
the opposite category reach a minimum allowed value of 3.33%, while
the odds of the middle category are allowed to drop below 33.33%.
And if you can understand that, then welcome to my job!
So for much of Oklahoma, which sees it's odds of below normal temperatures (of
some unknown magnitude, at least for the purposes of this map) at 80-90%,
that means the odds of ABOVE NORMAL temperatures are fixed at 3.33%, per the
rules of the CPC methodology, and the odds of NORMAL temperatures are
approximately 7-17%. Here are the actual odds as indicated by the CPC 8-14 day
interactive tool (as opposed to myself, just your everyday average tool) for
both OKC and Tulsa. Notice it doesn't give magnitudes!
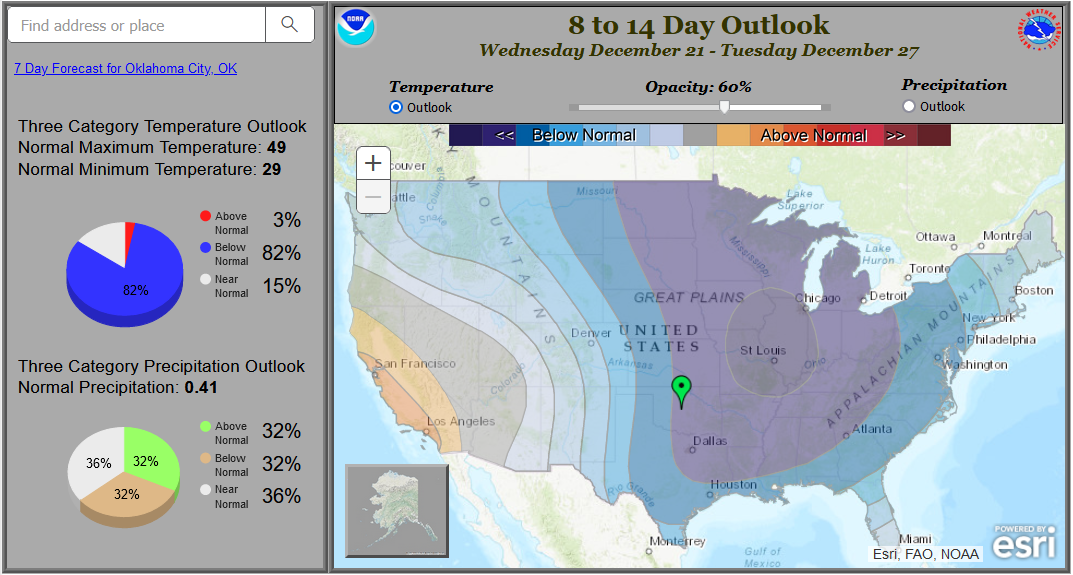
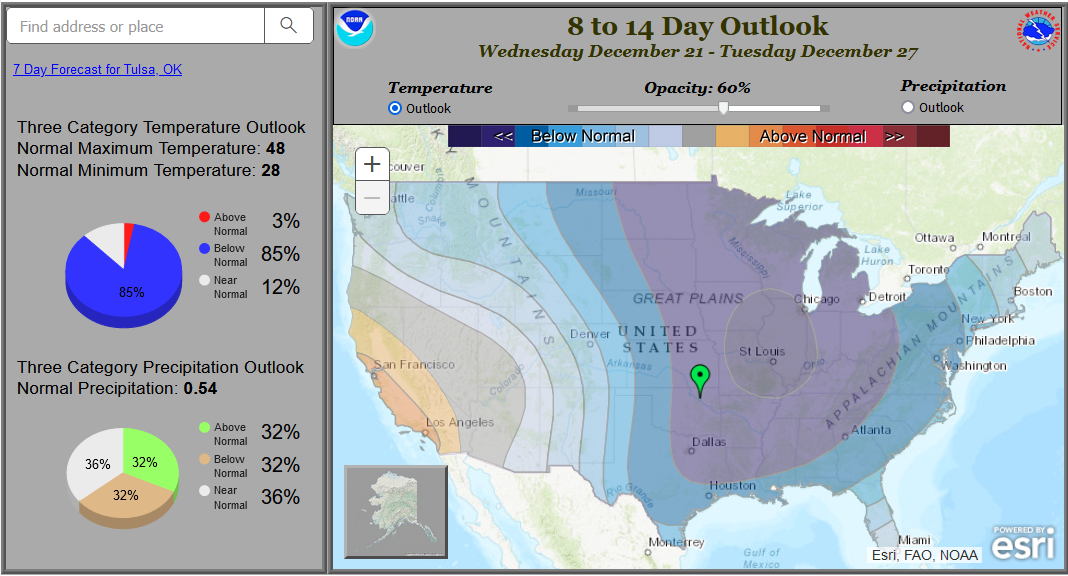
And also keep in mind that this is for an averaged 7-day period (in this case,
Dec. 21-27), and the weather can sometimes vary greatly through that period.
Does all that make sense? Yeah, I KNOW it doesn't! Even my explanation has a few
holes in it, much like my head. That's why sometimes it's just good to look at
a map like that and say "Oh, we have greatly increased odds of below normal
temperatures later next week, and possibly on Christmas as well!"
As for that actual forecast, we have to rely on fantasy-cast material to see
just how cold it's looking. Things are varying widely through each forecast
model run. So we can look at a single model run and see temps in the teens
Christmas morning, with wind chills in the single digits below zero. And no
snow.
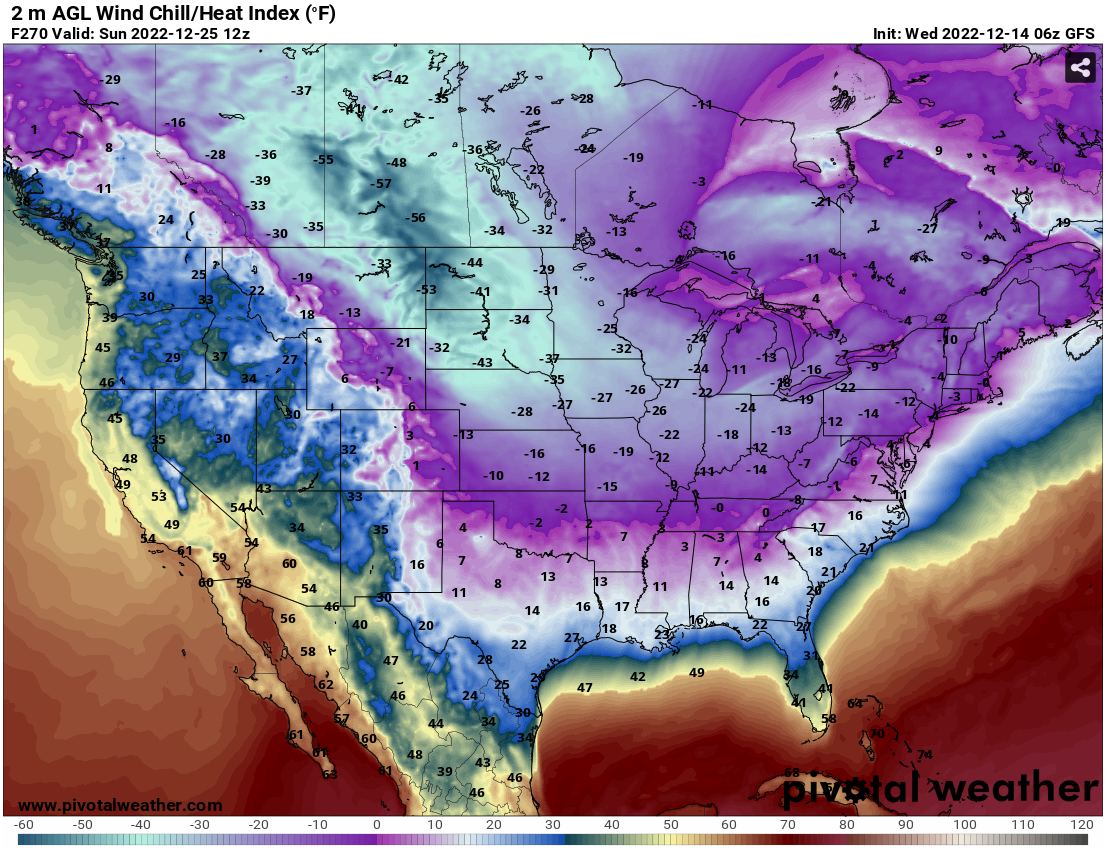
And we can look at a mean of a collection of many model runs, and see temps
in the 20s on Christmas morning...and no snow.
In other words, we're getting way ahead of ourselves. But it's fun to look
ahead with a bit of excitement, AS LONG AS WE UNDERSTAND IT'S MORE FOR FUN THAN
PLANNING PURPOSES!
And anyway, isn't it cold enough already, with yesterday's cold front almost
all the way through the state by now?
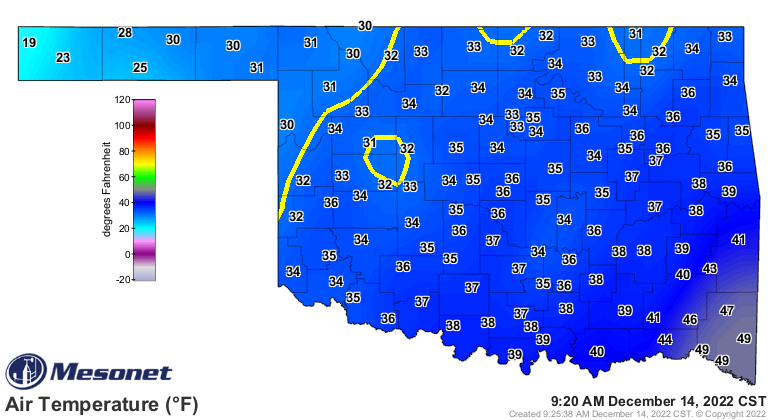
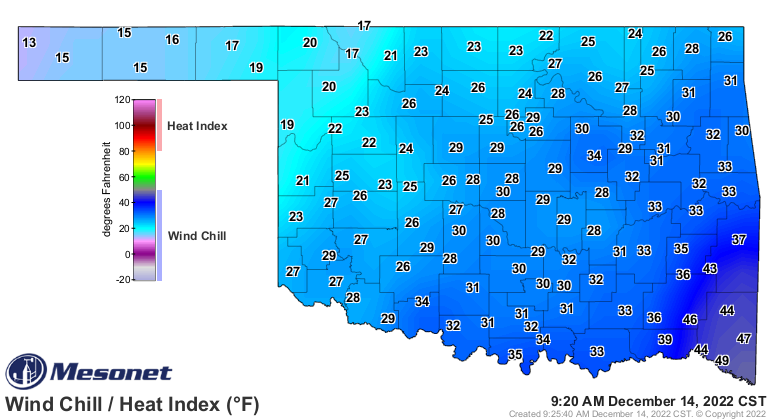
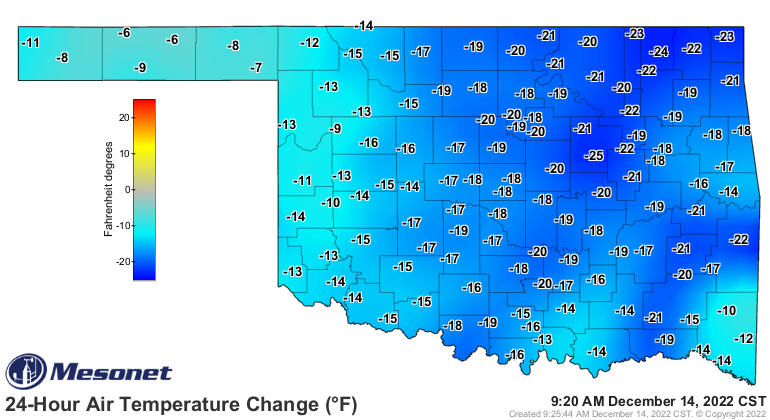
And this air is gonna dominate the region for the next week or so, with a few
minor roller coaster rides up or down, until that series of fronts next week
possibly plunge us into the arctic region.
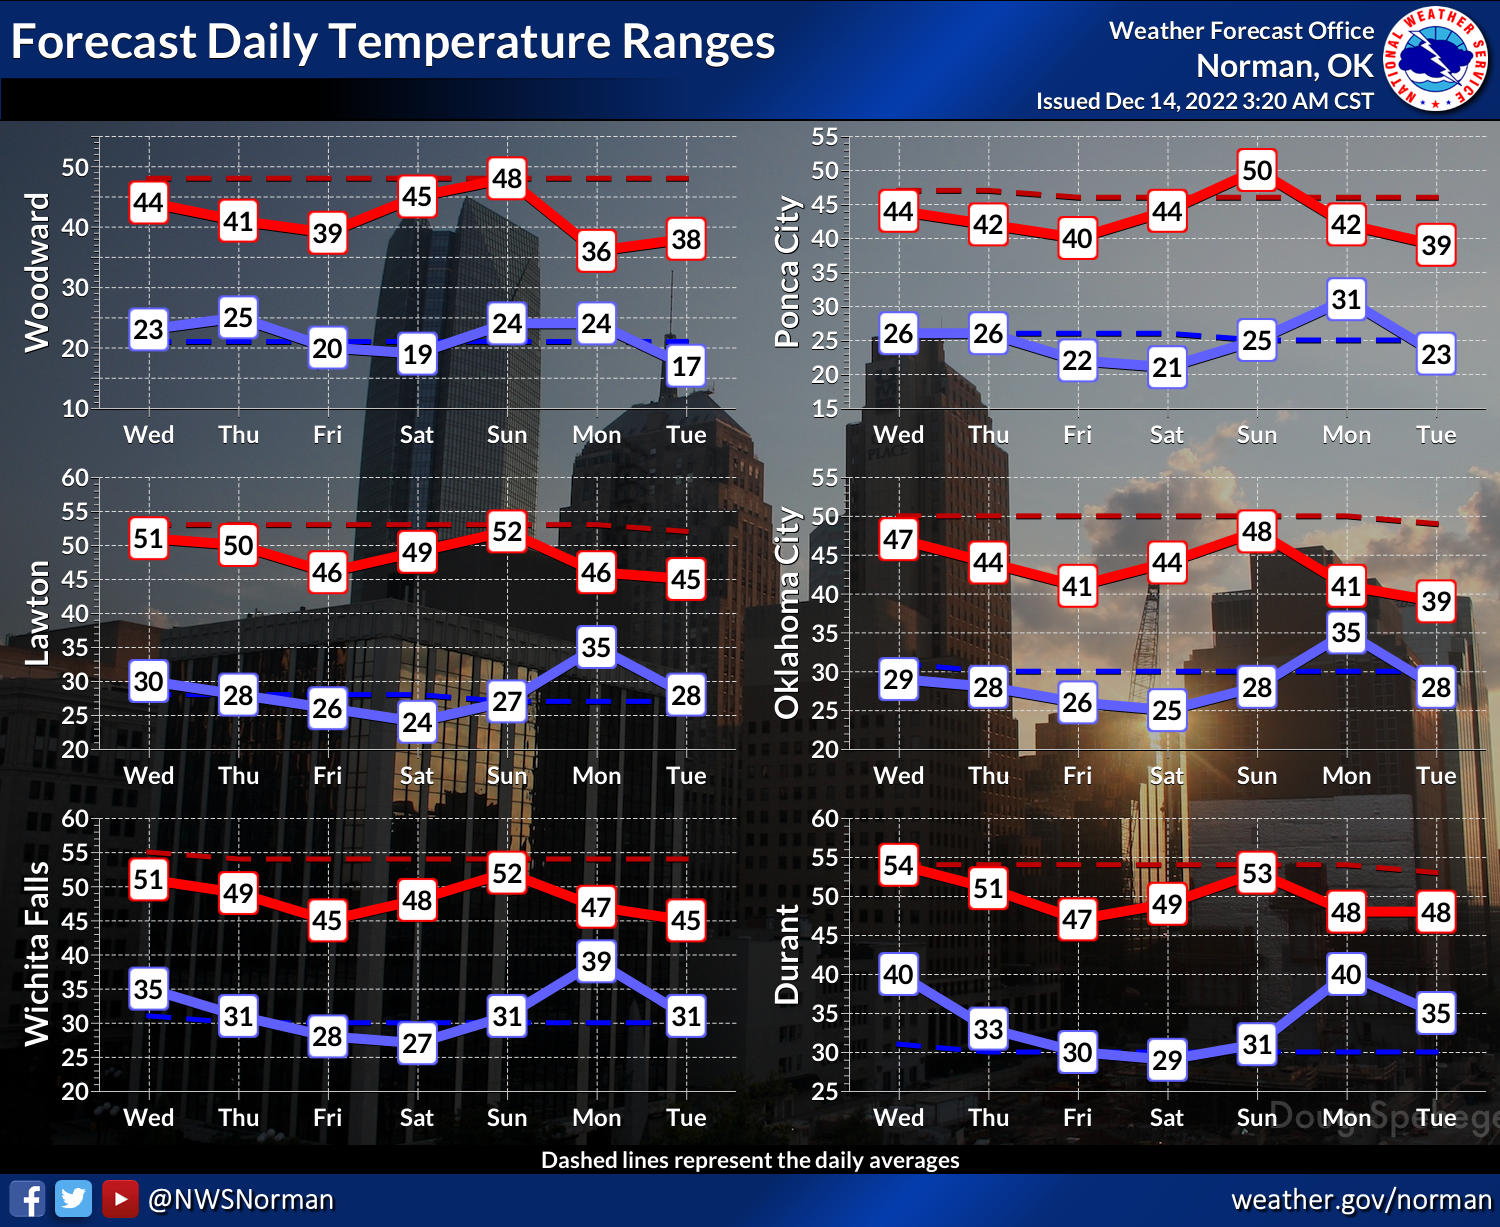
So let's have some fun with it, until it's no longer fun. And really really cold.
Gary McManus
State Climatologist
Oklahoma Mesonet
Oklahoma Climatological Survey
gmcmanus@mesonet.org
December 14 in Mesonet History
| Record | Value | Station | Year |
|---|---|---|---|
| Maximum Temperature | 83°F | ARNE | 2021 |
| Minimum Temperature | -3°F | MEDF | 2000 |
| Maximum Rainfall | 2.69″ | SLAP | 2023 |
Mesonet records begin in 1994.
Search by Date
If you're a bit off, don't worry, because just like horseshoes, “almost” counts on the Ticker website!