Ticker for December 8, 2022
MESONET TICKER ... MESONET TICKER ... MESONET TICKER ... MESONET TICKER ...
December 8, 2022 December 8, 2022 December 8, 2022 December 8, 2022
A Dubious Honor
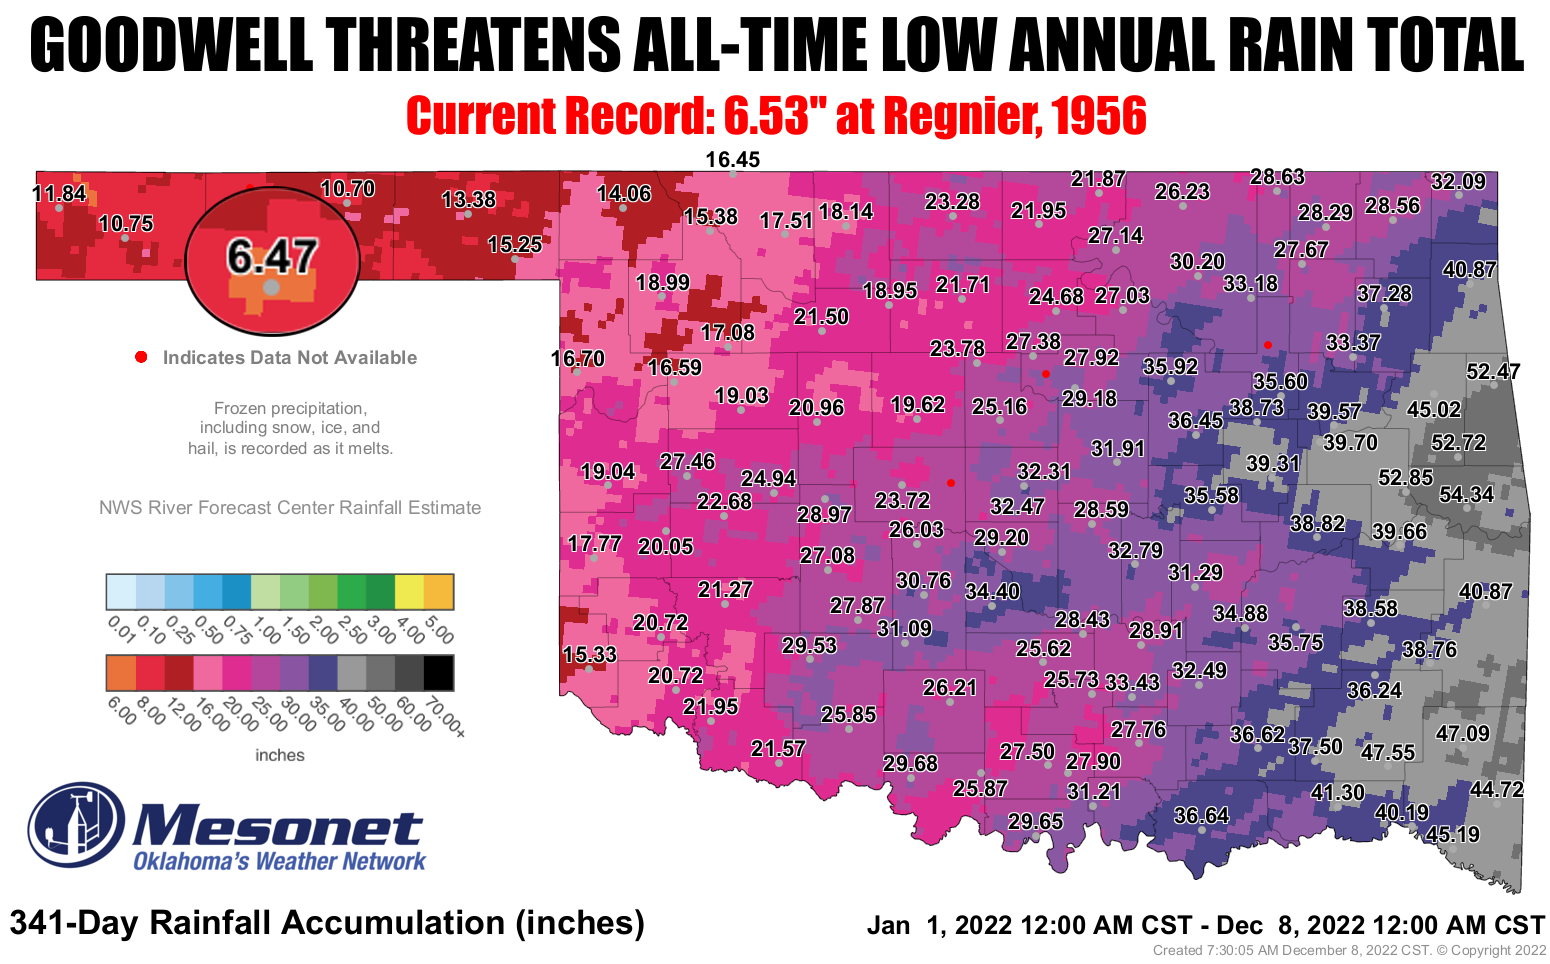
"Dubious"...you know, like my need of a hairbrush.
This is one all-time record I am definitely trying to jinx. So the 6.47 inches at
Goodwell would break the all-time low precipitation total of 6.53 inches set at
Goodwell, way back in 1956. And as I've said many times, those middle 1950s years
are ones to avoid hanging out with, as are the 1930s, much of the 1910s, and
2010-15 (though halfway thru May, at least), if you don't want to be in drought
trouble.
-***-
Top-10 Lowest Annual OK Rainfall Totals (1880-2021)
Regnier 1956 6.53 inches
Boise City 1956 6.95 inches
Turpin 2011 7.26 inches
Kenton 1956 7.44 inches
Gage 2011 7.62 inches
Range 2011 7.77 inches
Hardesty 1952 8.10 inches
Beaver 1956 8.40 inches
Guymon 2011 8.43 inches
Goodwell 2011 8.71 inches
-****-
It's actually much worse than that. You can go back to Oct. 13, 2021, and
Goodwell's total rainfall of 6.5 inches would STILL break than record.
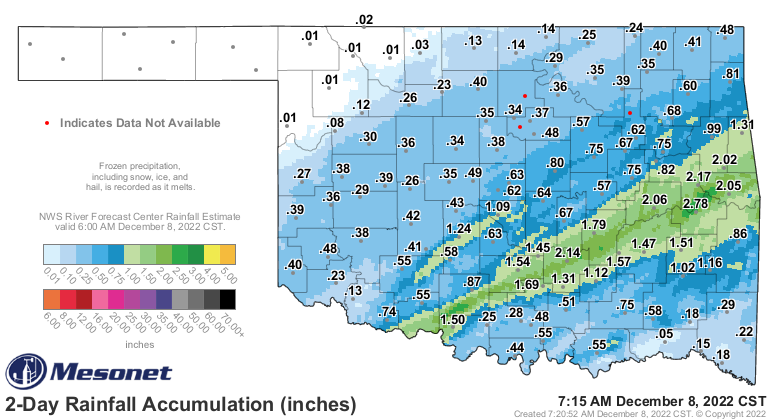
The totals map above only goes through midnight of last night, but it
don't (Okie to English translation: "doesn't") matter much, the NW corner of the
state got a big old goose egg for this whole storm system.
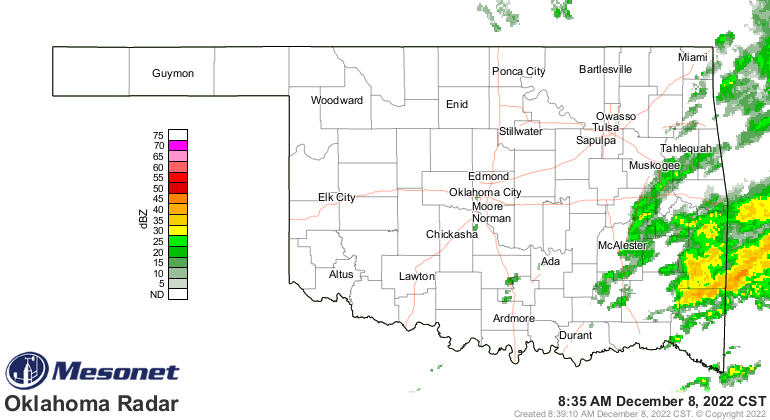
Heck, it's raining right now for crying out loud!
Those are some wonderful totals down to the SE of I-44, but woeful for the most
part to the NW of I-44.
Let's face it. Okay, now turn back. Now face it again. Now, turn back. Okay,
face it one more time. YES, that is your face in the mirror. Now if we can move
along from your vanity moment, let's face the fact that while southern and
eastern OK continue to get good relief, points to the north and west are still
hurting terribly.
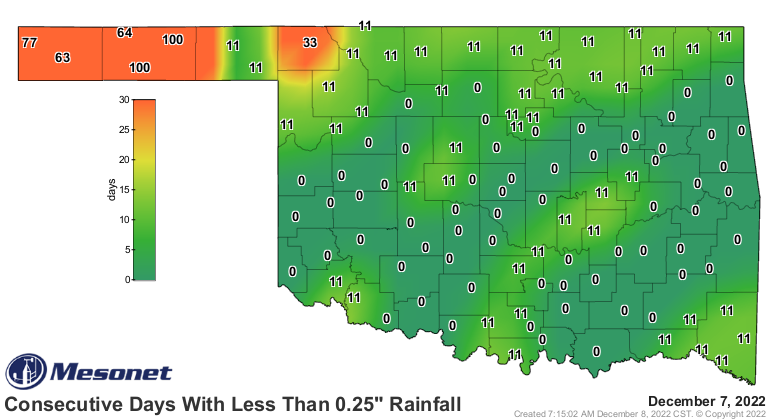
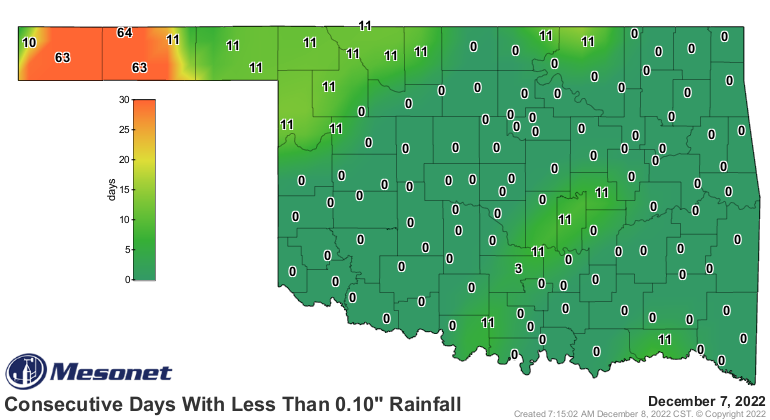
Neighbor, how long's it been since you've had at least a quarter-inch of rain
in a single day?
100???
Well, that's too long. And so is 63 for a tenth of an inch.
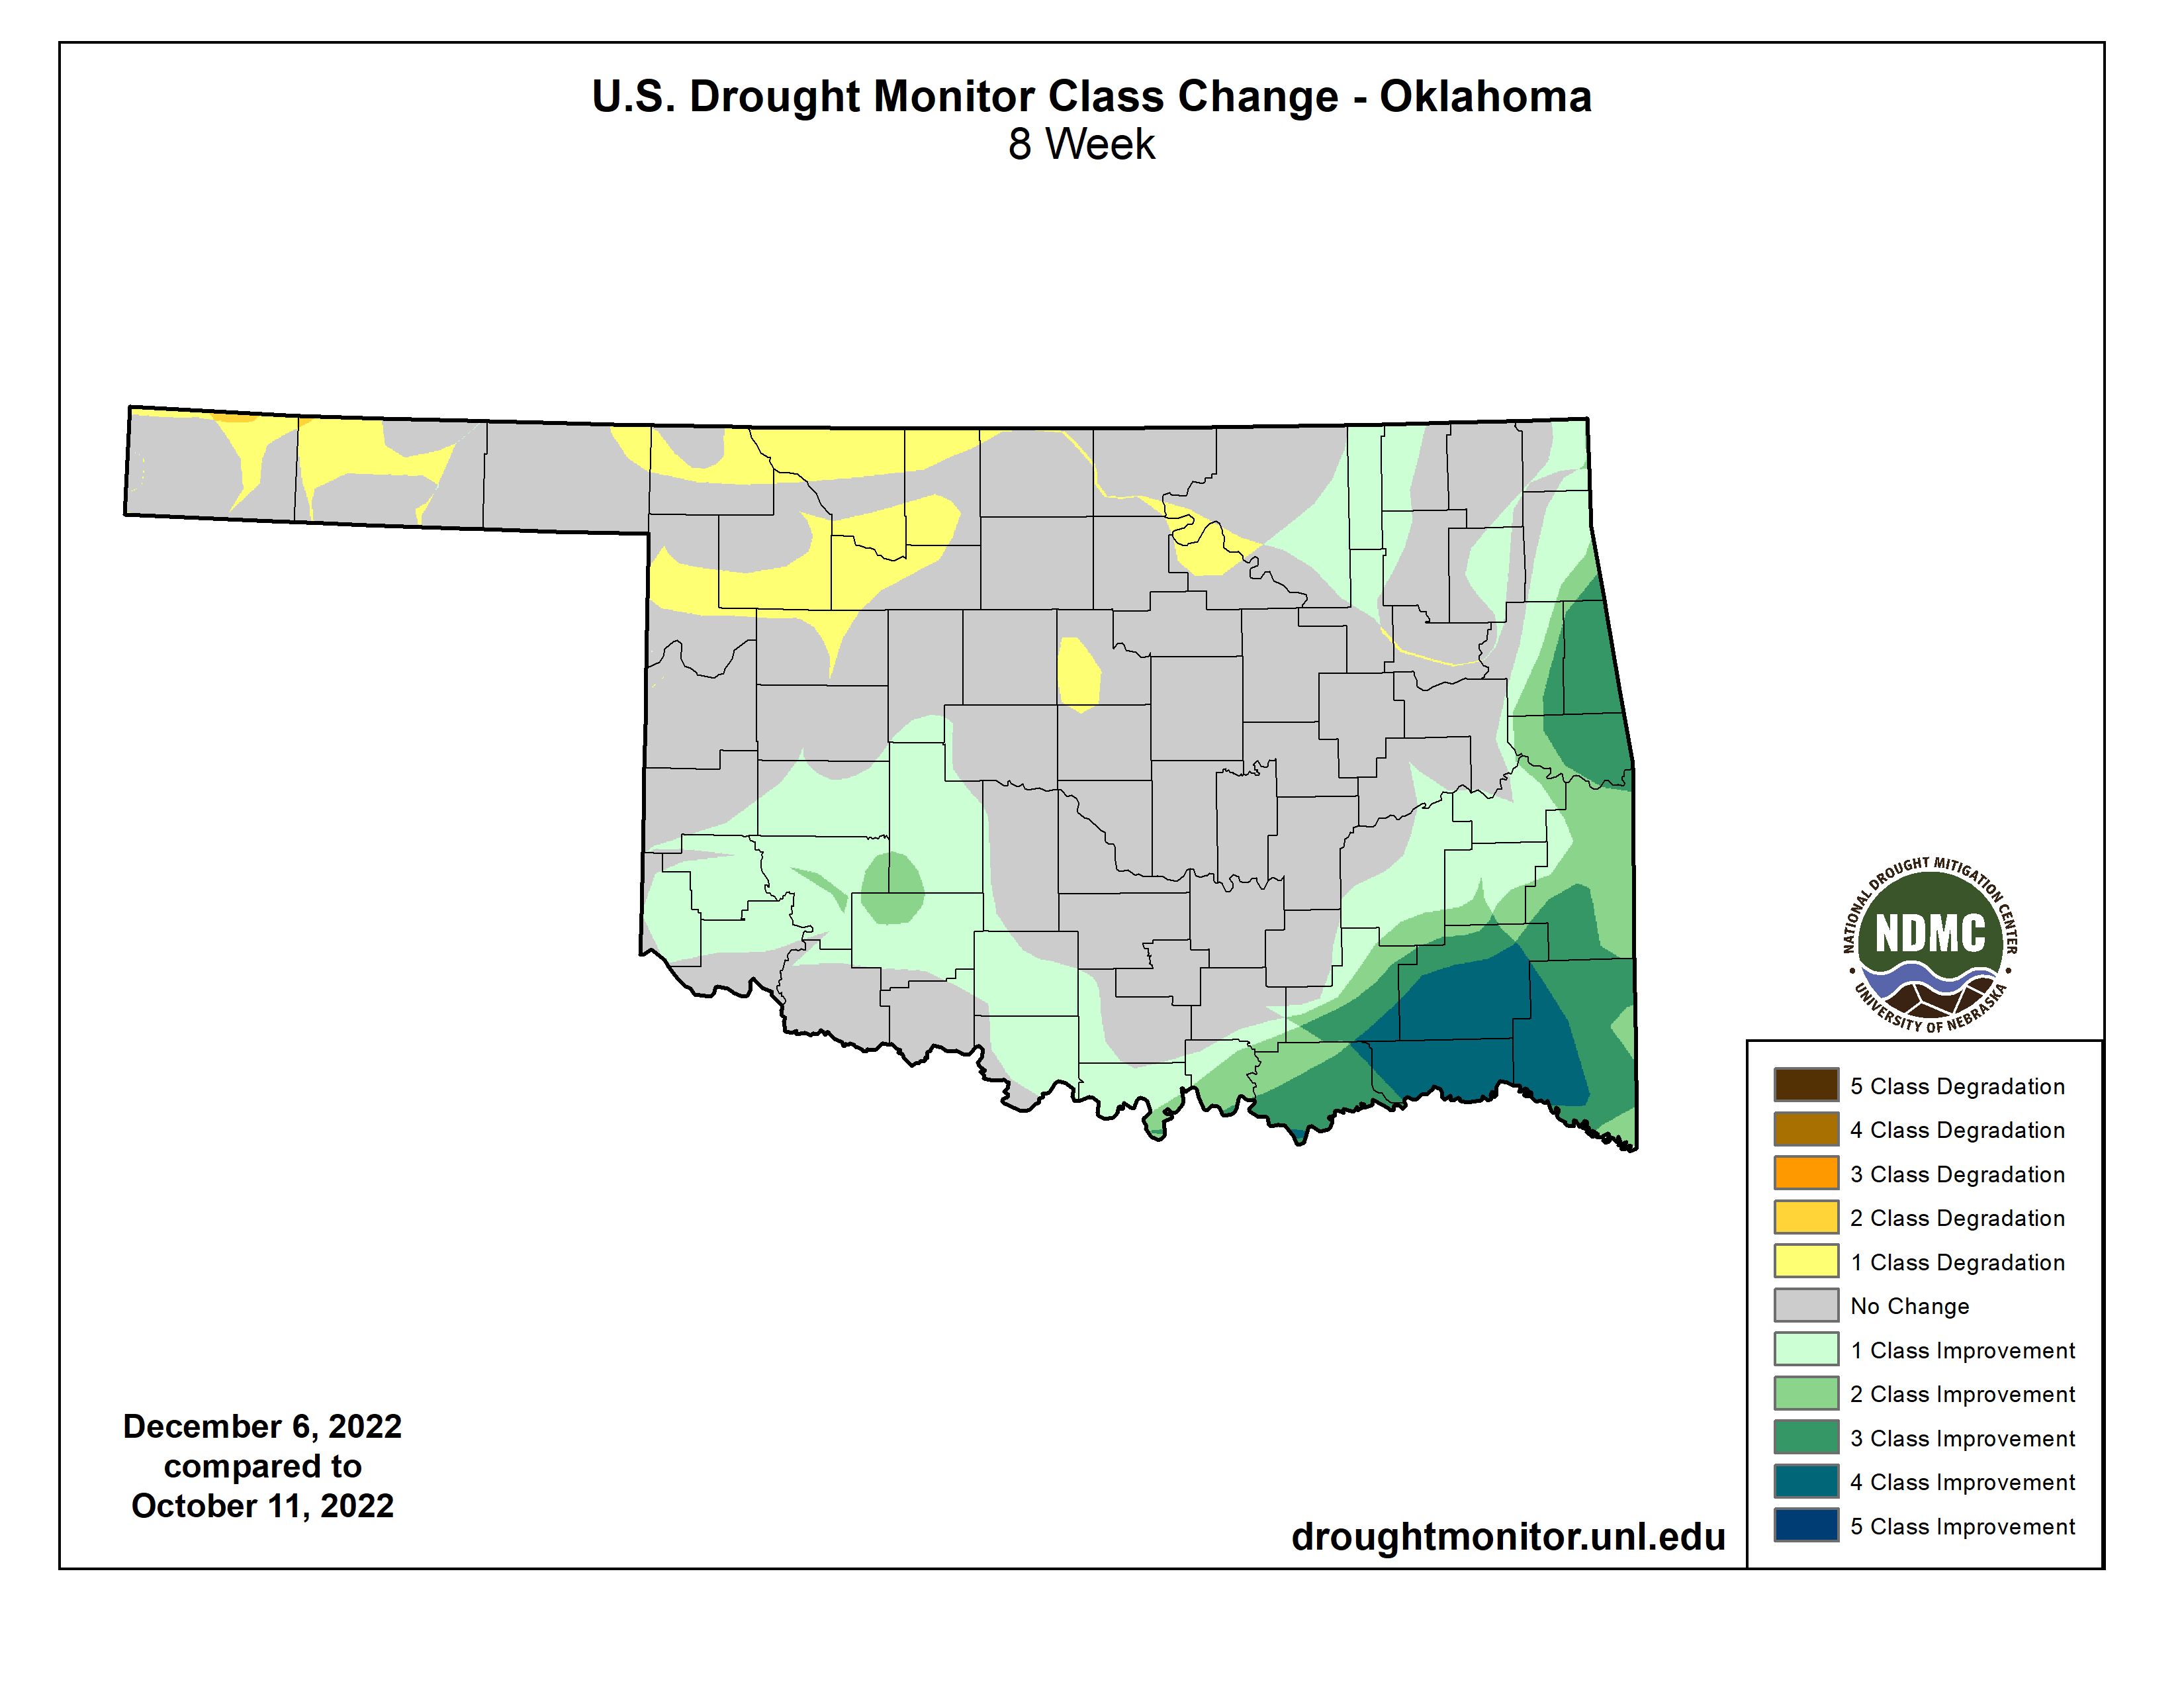
The Drought Monitor continues with way too much color on it, from the yellow
(Abnormally Dry conditions...which is NOT a drought designation on the intensity
scale) to D4 (Exceptional drought...1-in-50 to 1-in-100 year event).

We have made pretty good progress across the SE 1/3, as well as up into east
central OK, over the last 60 days with repeated bouts of significant rainfall.
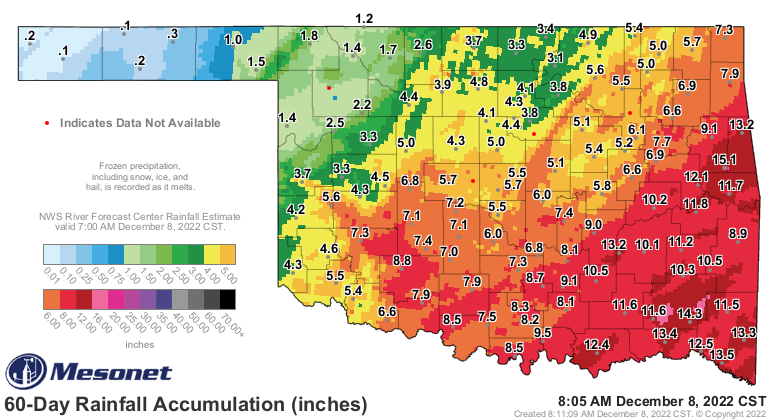

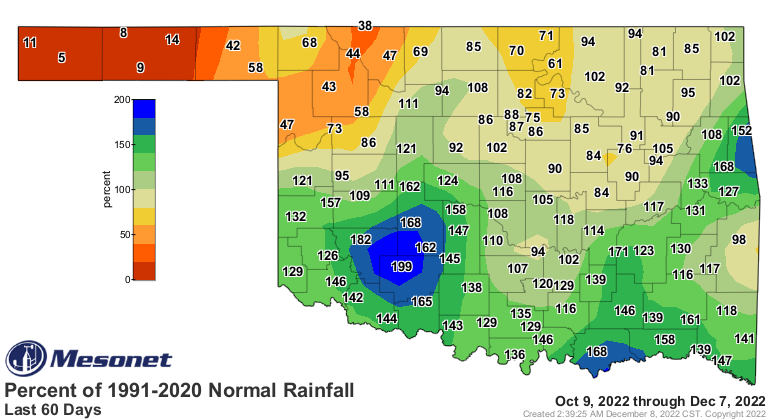
As you look at those maps, you may be asking yourself "Why did I have that
third cup of coffee." Then, when you come back from the bathroom, you might
look again and think "Since there are surpluses up north of I-40, and at least
close to normal across much of northern OK, why not more improvements up that
way?"
Well, remember when our flash drought began back on June 11? And remember the
hottest summer since 2011, AND consistent much-above normal temperatures through
mid-November? Remember the deficits? Let's take a look at the 180-day rain maps.
They match up with that period quite well.
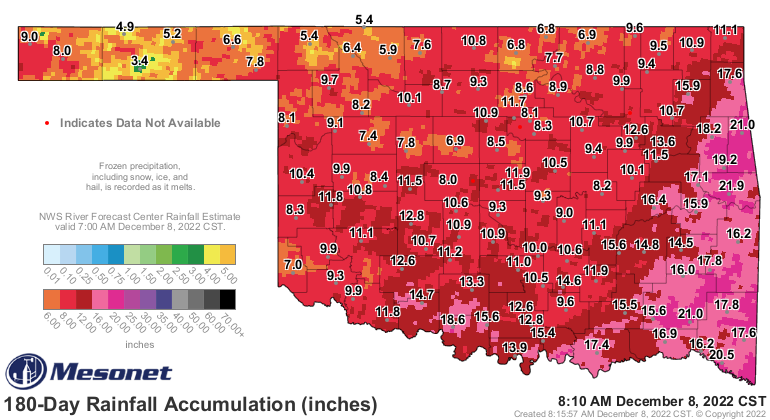
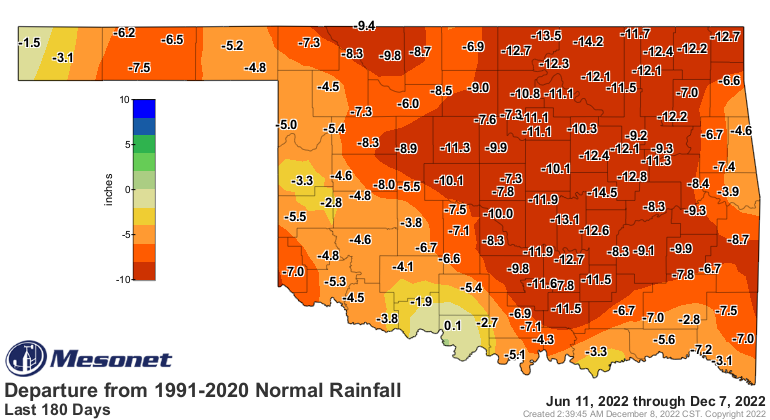
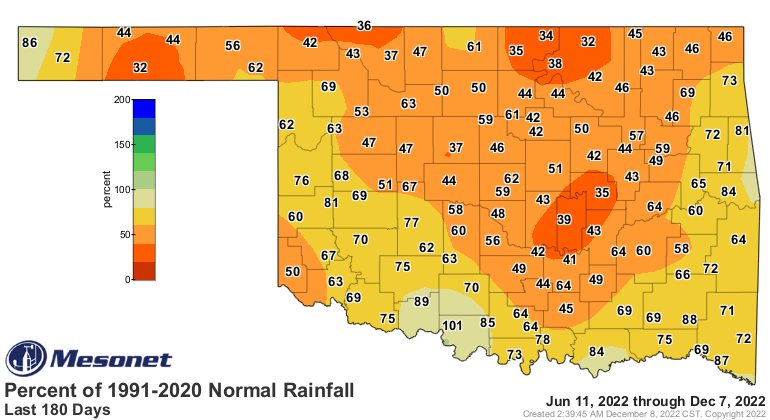
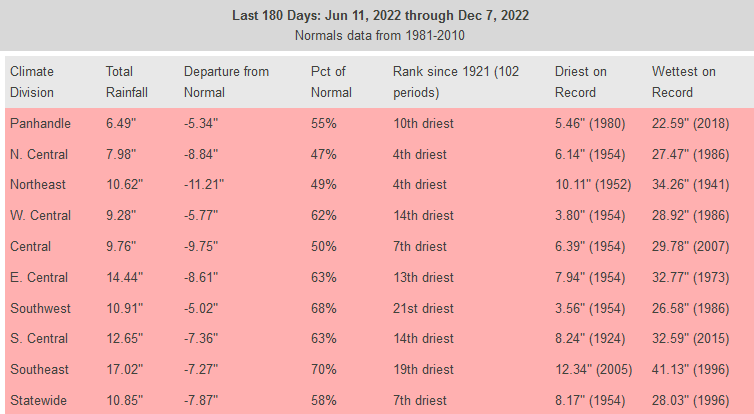
Yeah, those surpluses wash right out in what is the driest June 11-Dec 7 period
in the last 100 years, which is pretty darned significant considering it's a
6-month period.
We also have to consider the last 365 days, which goes back to just when this
drought was intensifying rapidly in the face of an incredibly warm, dry, and
windy December 2021 (warmest on record by over 5 degrees, 10 degrees above
normal).
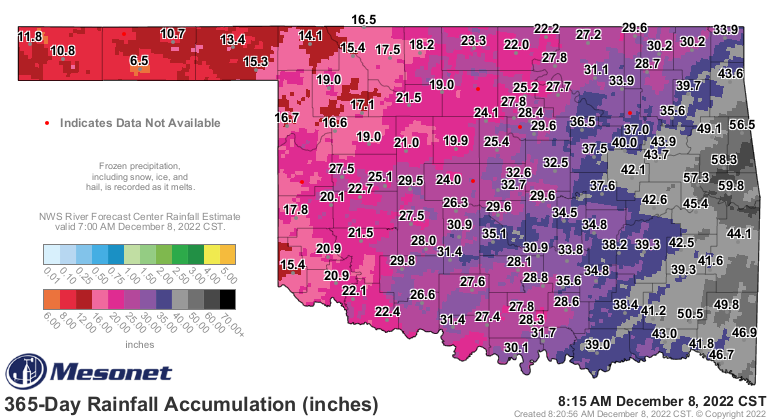
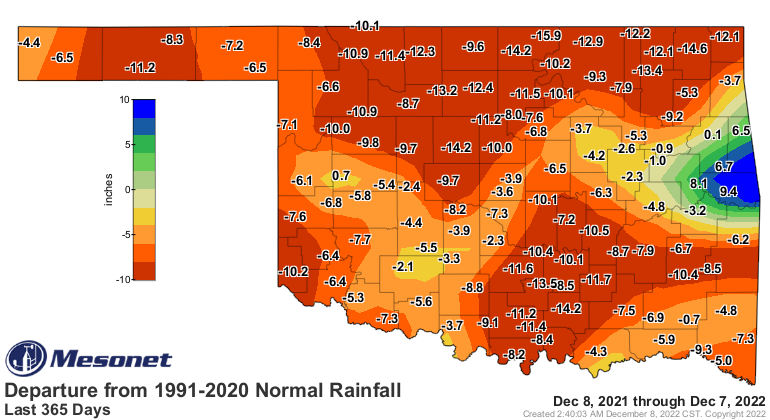
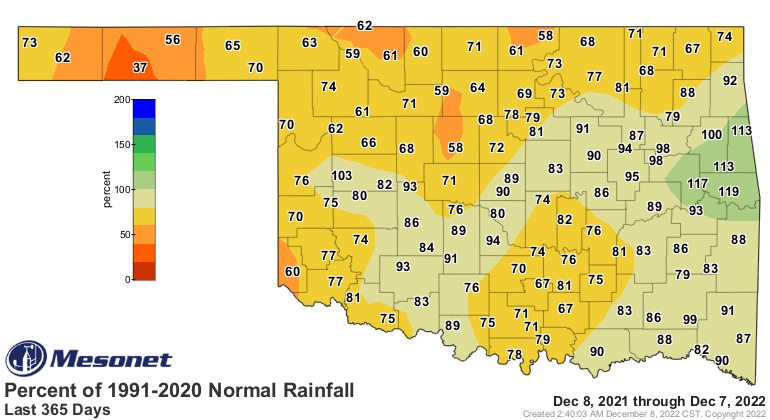
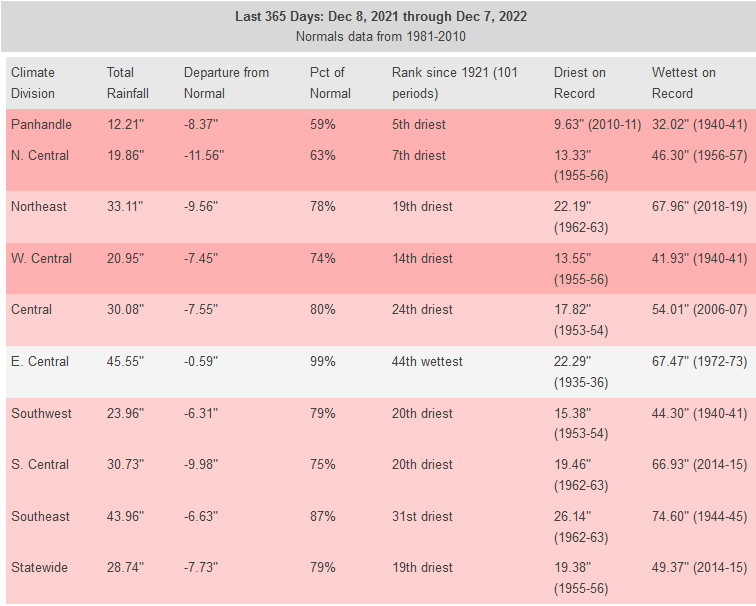
So you tell me: should we or should we not still have a lot of extreme and
exceptional drought in the state after 2 months of near-normal rainfall after
going through the 7th driest last 6 months and 17th driest last 12 months periods
in at least the last 100 years?
Have the topsoils improved? Yes.
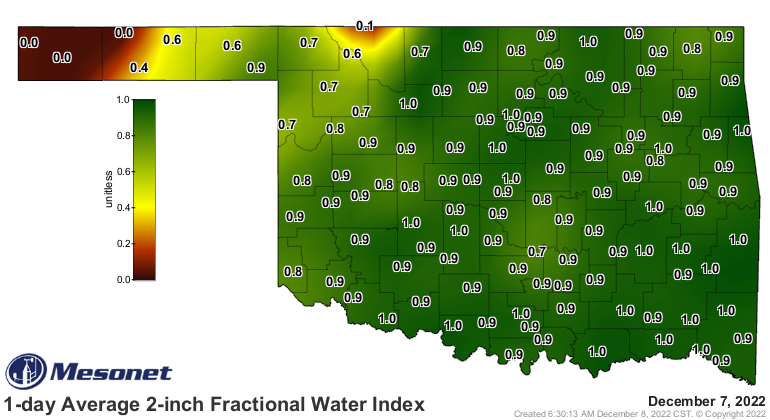
How about those subsoils? No so much.
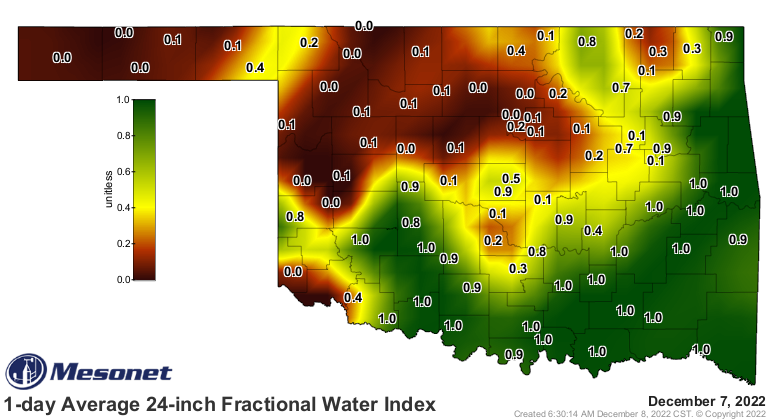
How about your farm ponds across northern and western Oklahoma? What about
Oklahoma's primary reservoirs?
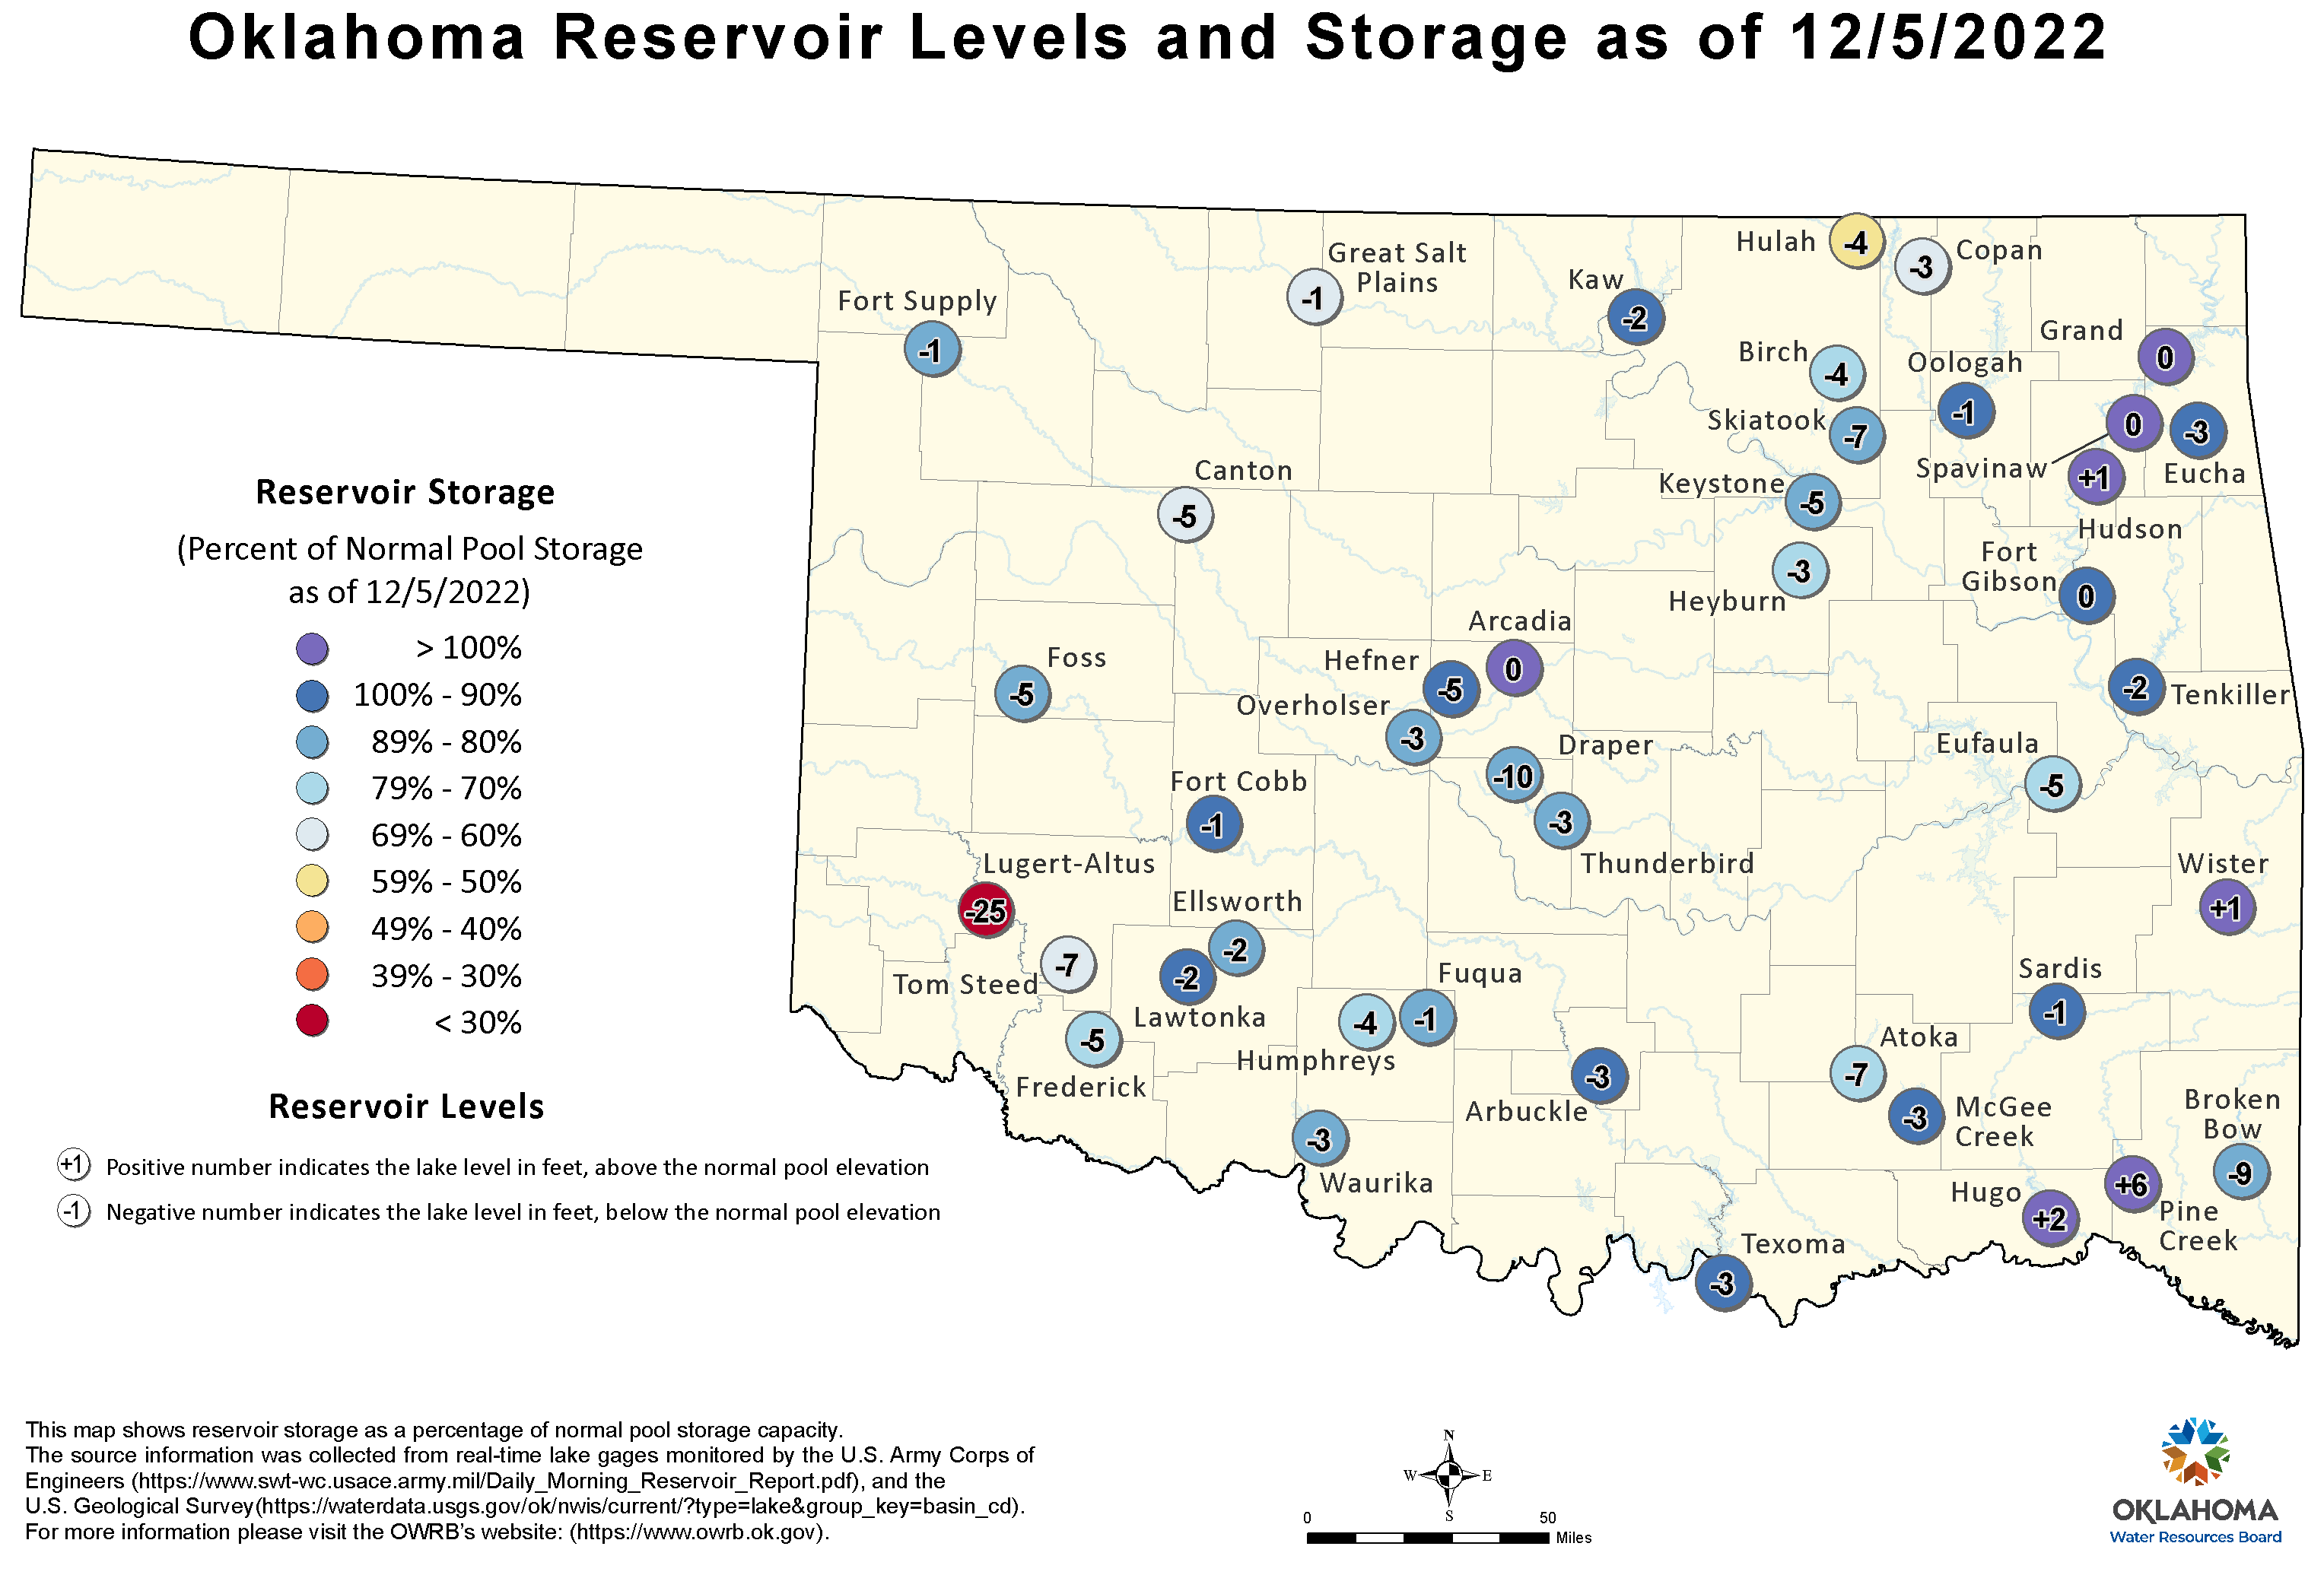
Again, not so much. So while we will see more improvements in the Drought
Monitor next week, not all areas have seen equal relief. The good news is we
have a couple more chances for rain in the next week, this weekend and again
early next week, but the bad news (ain't there always?) is those chances don't
look so great for those that need it the most. Including Goodwell.
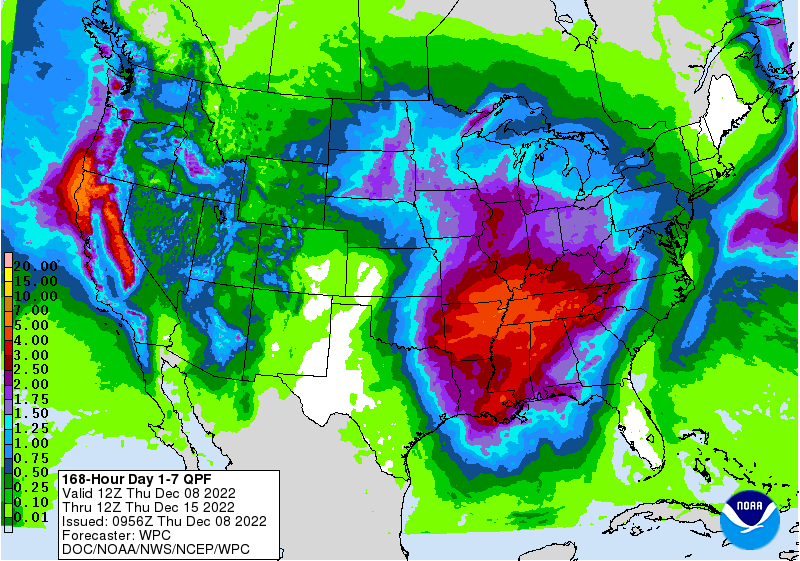
At least the northeast is starting to get painted with some good rain in those
forecasts. As for poor Goodwell (and surrounding areas), their quest to get out
of record territory is still not showing up.
December 8 in Mesonet History
| Record | Value | Station | Year |
|---|---|---|---|
| Maximum Temperature | 80°F | BURN | 2023 |
| Minimum Temperature | -15°F | KENT | 2005 |
| Maximum Rainfall | 2.35″ | MTHE | 1994 |
Mesonet records begin in 1994.
Search by Date
If you're a bit off, don't worry, because just like horseshoes, “almost” counts on the Ticker website!