Ticker for January 20, 2021
MESONET TICKER ... MESONET TICKER ... MESONET TICKER ... MESONET TICKER ...
January 20, 2021 January 20, 2021 January 20, 2021 January 20, 2021
All hail sol!
Wow, a couple of gray days and you're already in the dumps? Oh, it's just me?
Well, there's always hope for a new (sunny) day coming around the bend. The
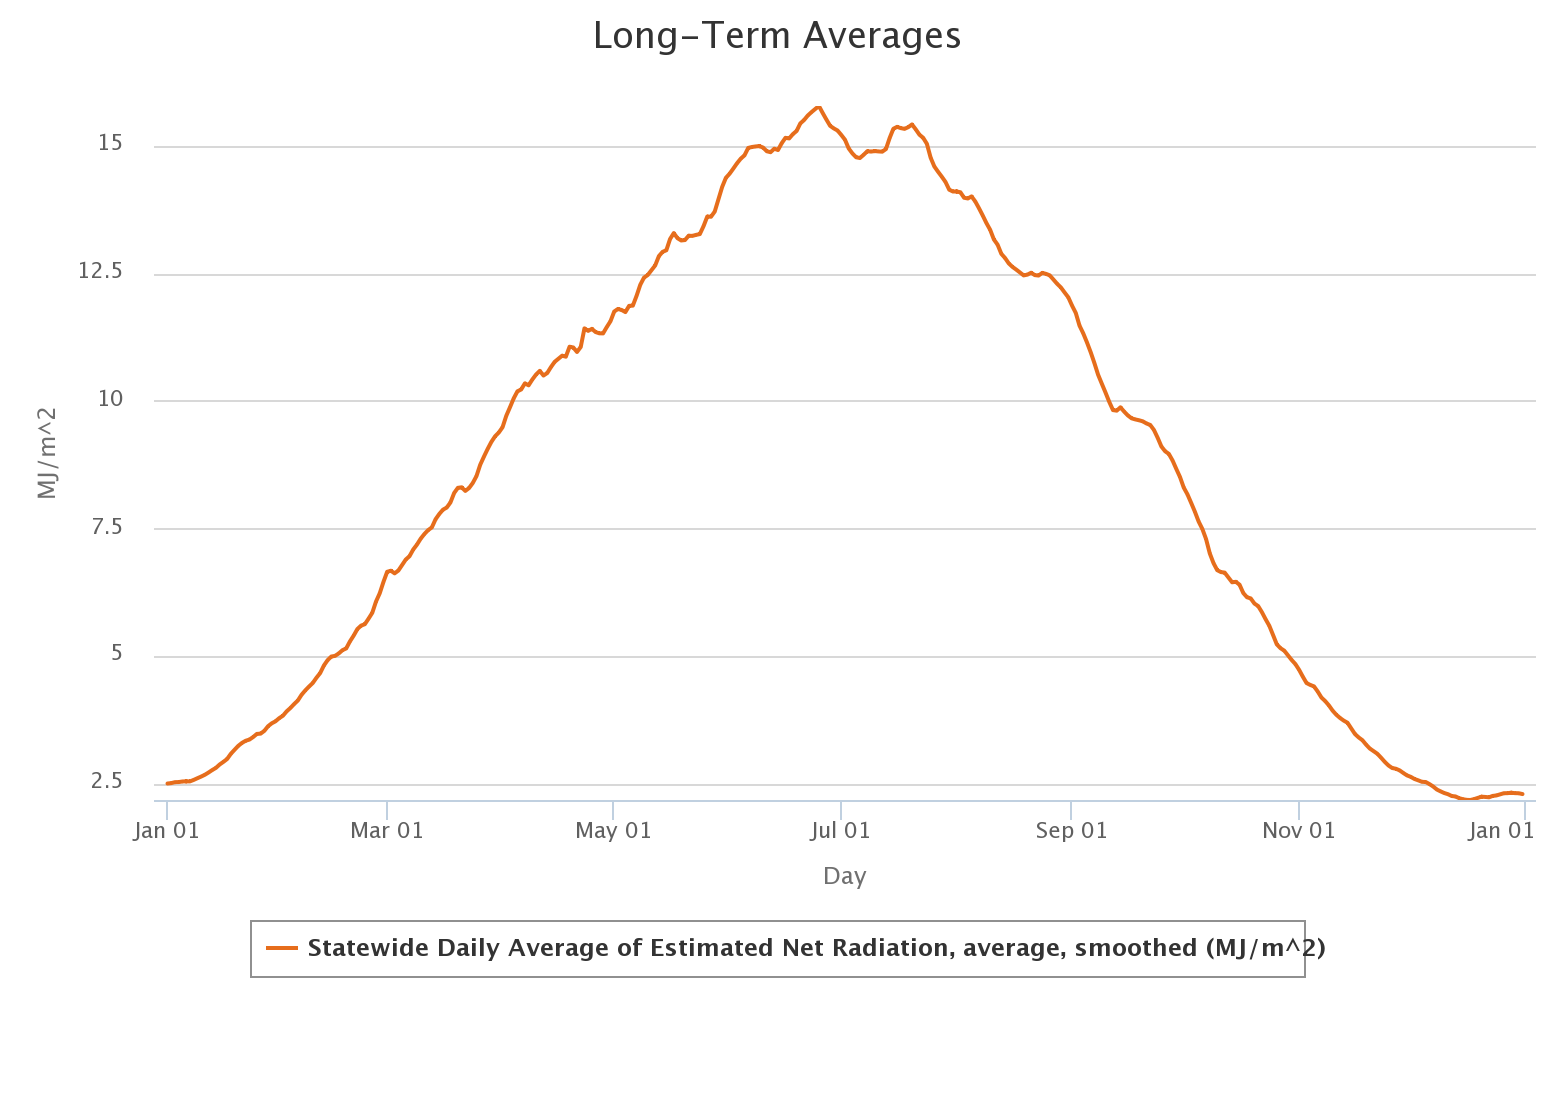
Mesonet's long-term average (2005-2019) solar radiation graph above should give
you a warm and sunburned fuzzy when you see that steady increase into the summer.
Keep in mind that graph doesn't necessarily show how much sunshine you're
getting, but the actual solar radiation. The increase throughout first half of
the year is more of a measure of how much solar radiation we're getting due to
the lengthening of the daytime hours, higher sun angle, etc. ("etc.", the
"Chance" Yahtzee square of writing). But obviously, on average, the
amount of sunlight that strikes the earth increases as we go through the year
until it maximizes in summer. Keep in mind that a cloudy day in summer might
still garner more solar radiation that a clear day in January.
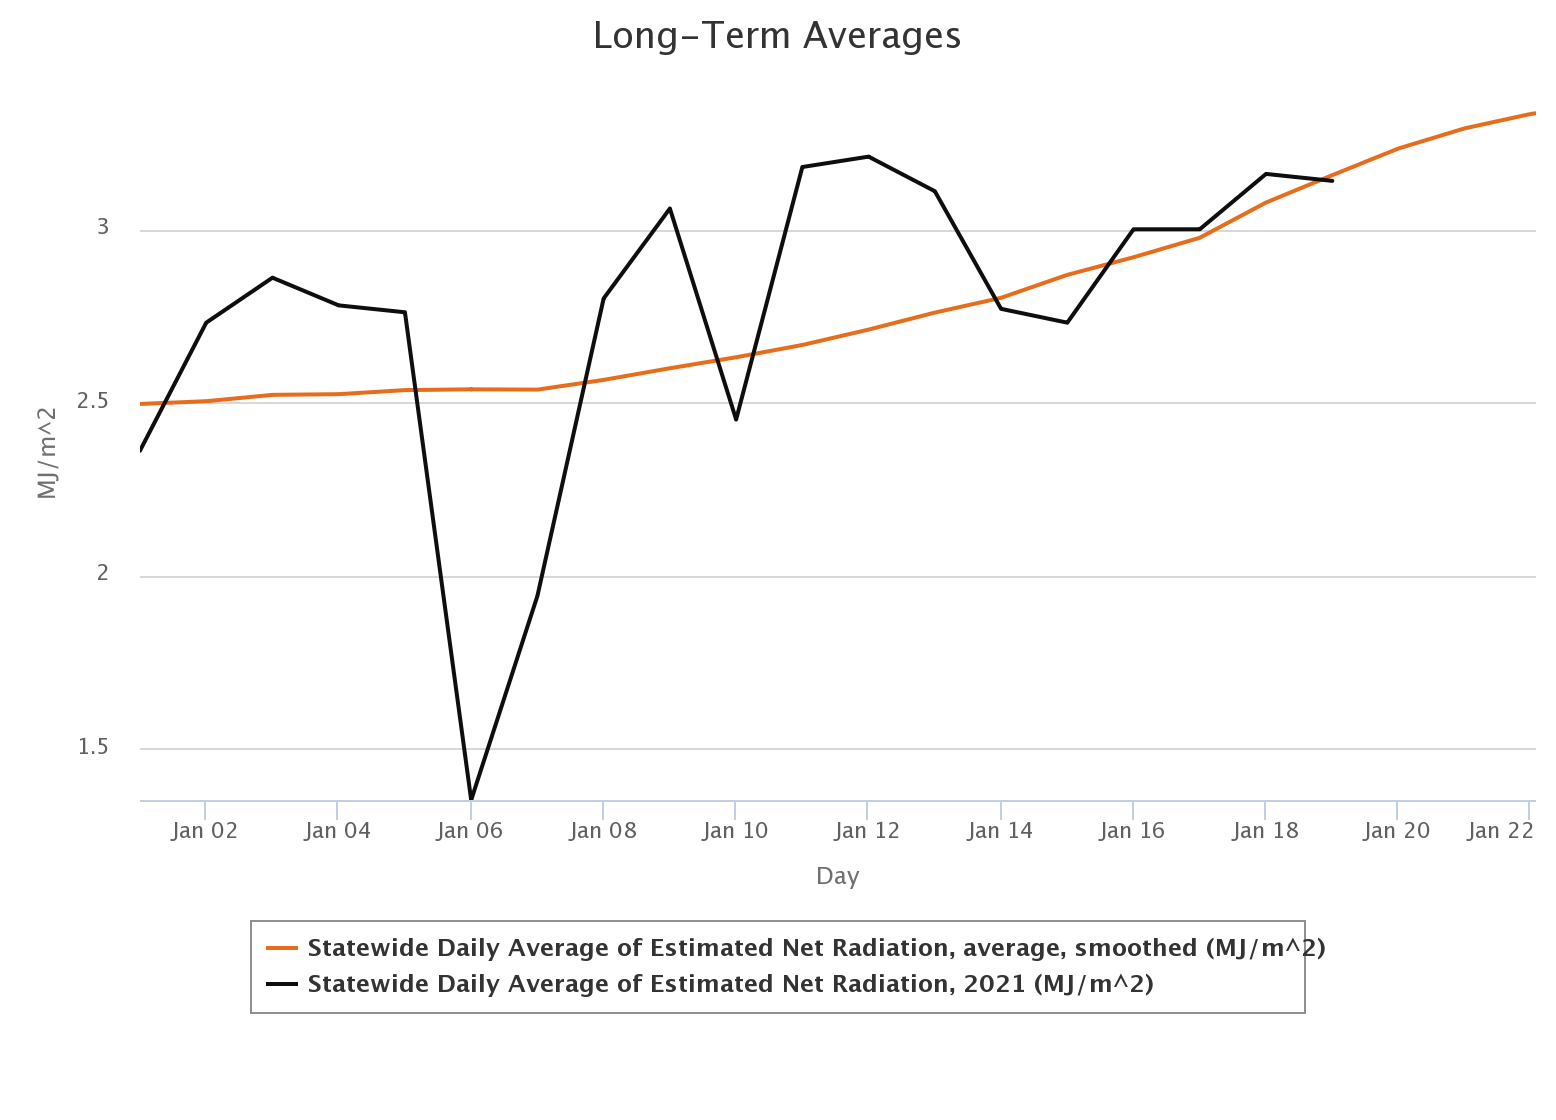
And it hasn't even been that gray lately. Here you can see a departure on Jan. 6-7
but otherwise, at or near the long-term average amount of solar radiation.
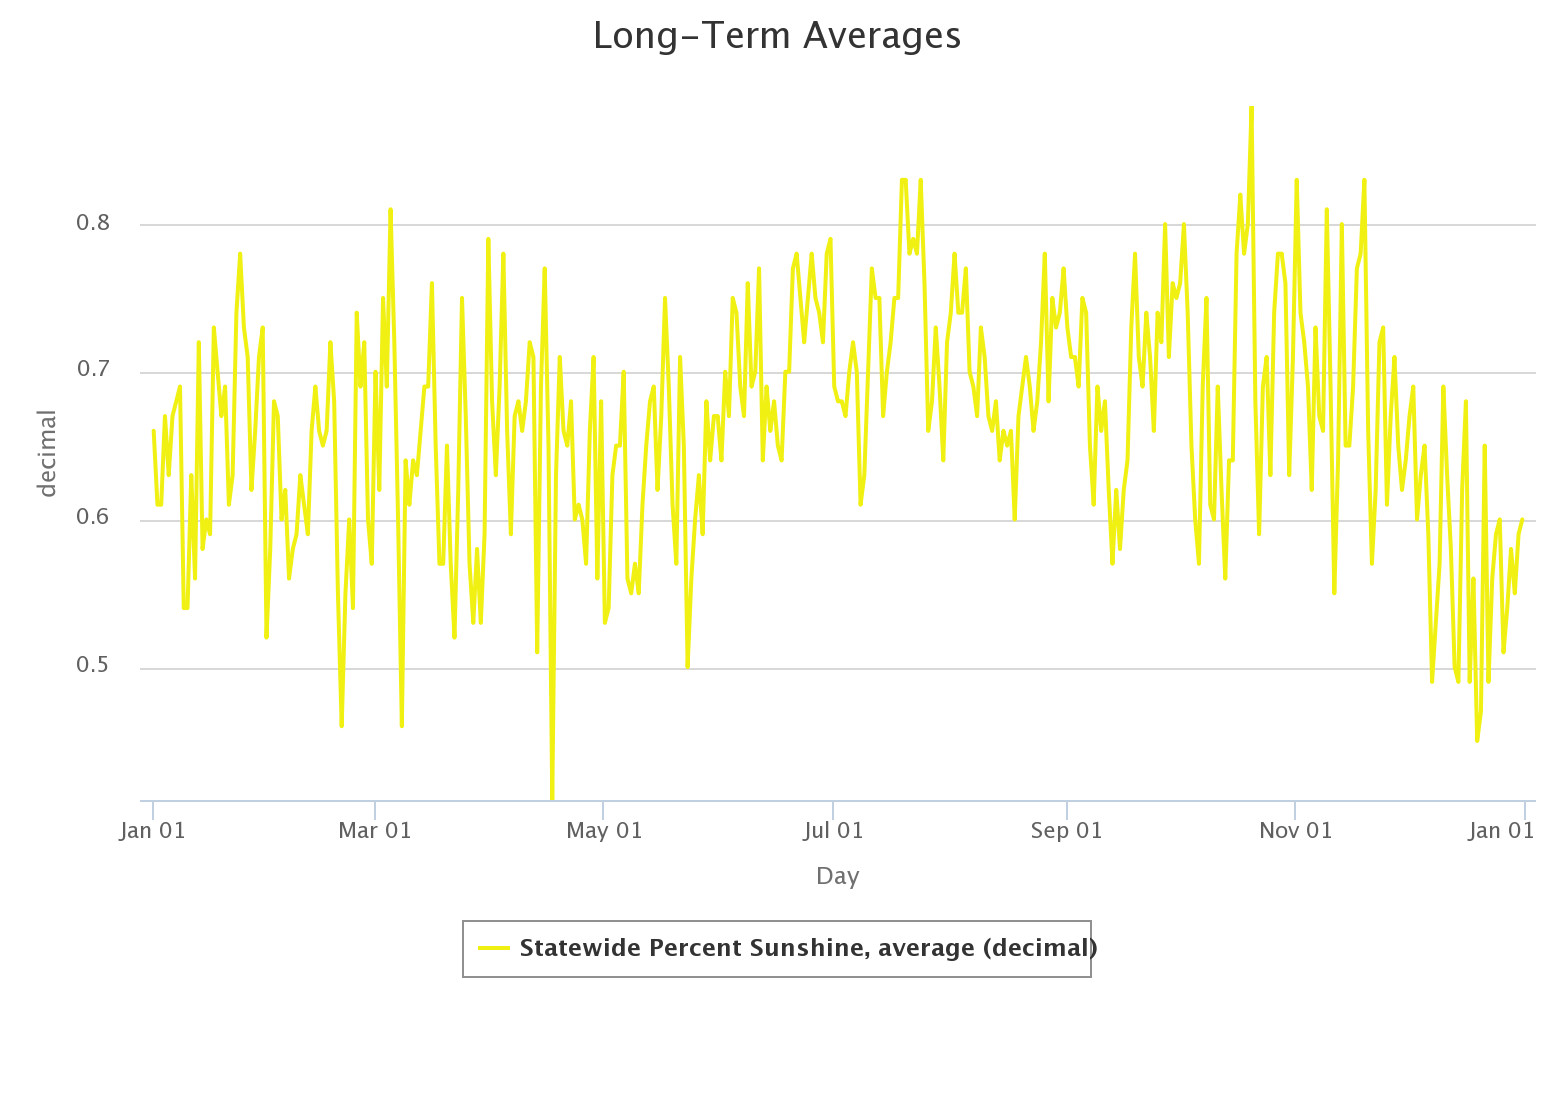
The amount of actual SUNSHINE we get is a different story, and is independent of
the amount of solar radiation as I explained above. I say "explained" in the
vaguest sense of the word, given that I'm probably the only person that can
decipher my scribbling. The long-term average for percent possible sunshine
across the state shows an increase as we go through January, but lots of ups and
downs along the way. Not a shock there, with these large areas of high pressure
following cold fronts, which bring lots of sunshine and boring weather.
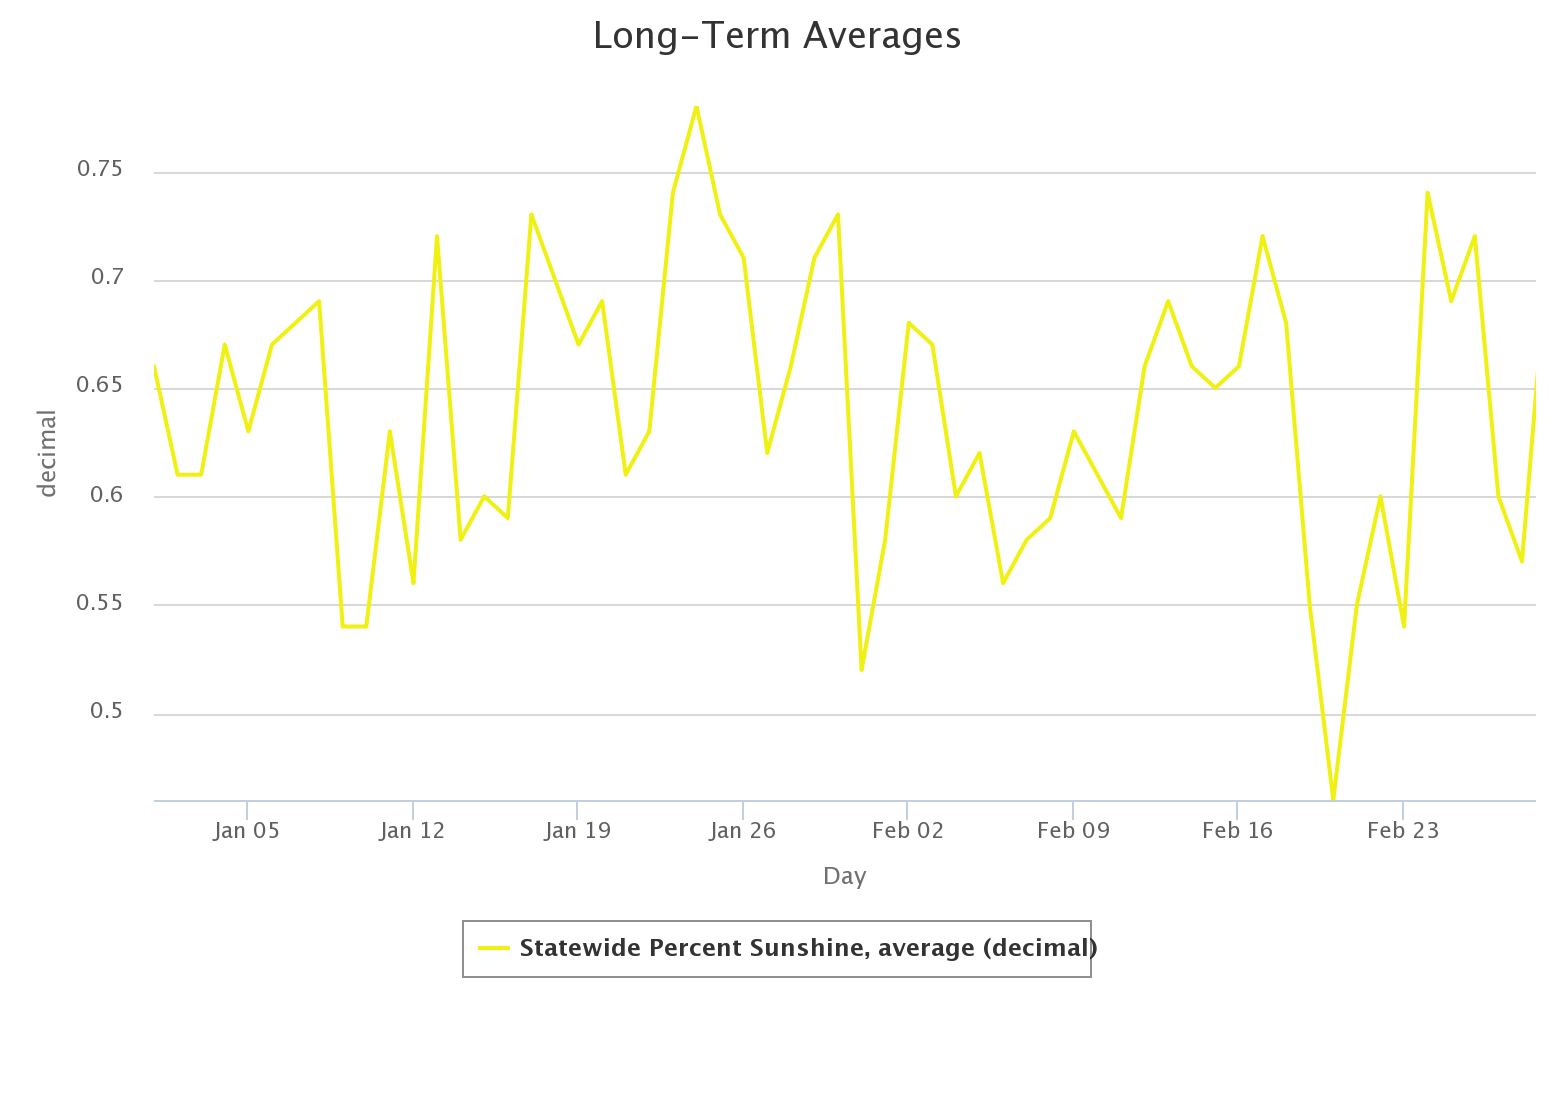
Taking a closer look at just January-February, I guess the message is DON'T go
sunbathing on Feb. 20?
There's a bit of a downward turn as we get into spring, which is not shocking
either. Well, it could be shocking with all the storms we get, but they're also
part of the reason for the loss of possible sunshine. Then it peaks again in
summer, again under the influence of more high pressure. The peak occurs on
Oct. 20 (again, based on the average of the 2005-2019 Mesonet data) for some
reason. I should throw an "etc." in there because I don't know why. The steady
slant downwards into December is a bit jarring, so if you dig gray, November
and December are your day(s).
What's the point, you say? Well how would I know? Do I look like Kierkegaard?
(Check the hair). I guess the point is the amount of actual sunshine we get is
highly variable throughout the year, but at least the amount of energy we get
from that sunshine steadily increases as we go through summer, before slacking
again in the long march to winter.
What's it mean, you say? Well how would I know? Oh right, not Kierkegaard, just
a climatologist. In that respect, it means more warmth, more energy. It means
walking outside into the sun from a cool indoors and being instantly warmed.
It means plants coming to life, the greening of our landscapes. It means fun
at the lake or pool, and lots of other outdoor activities.
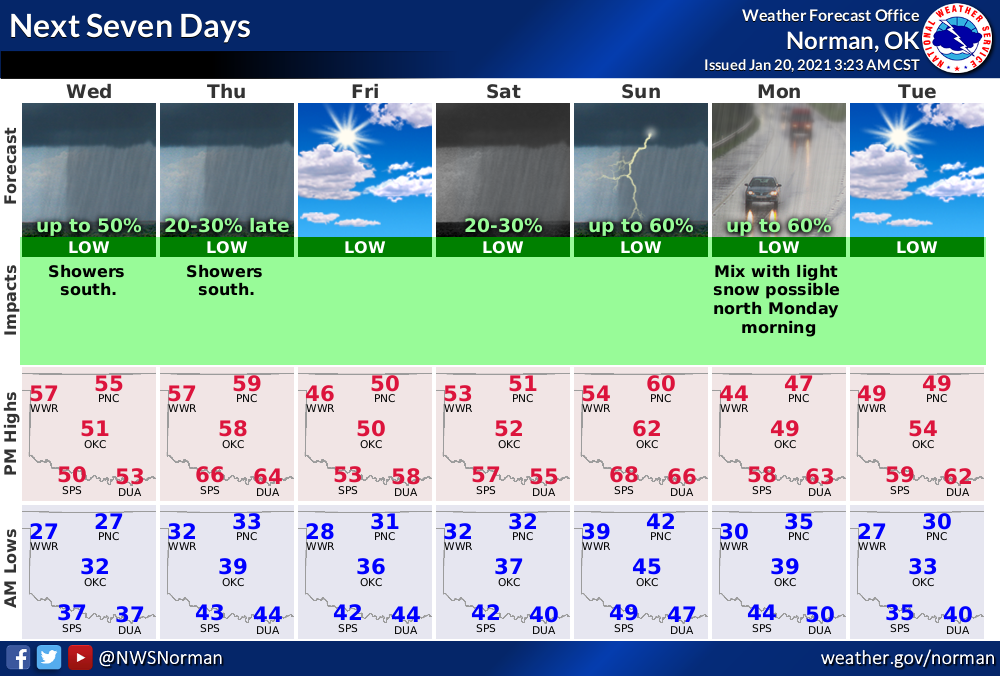
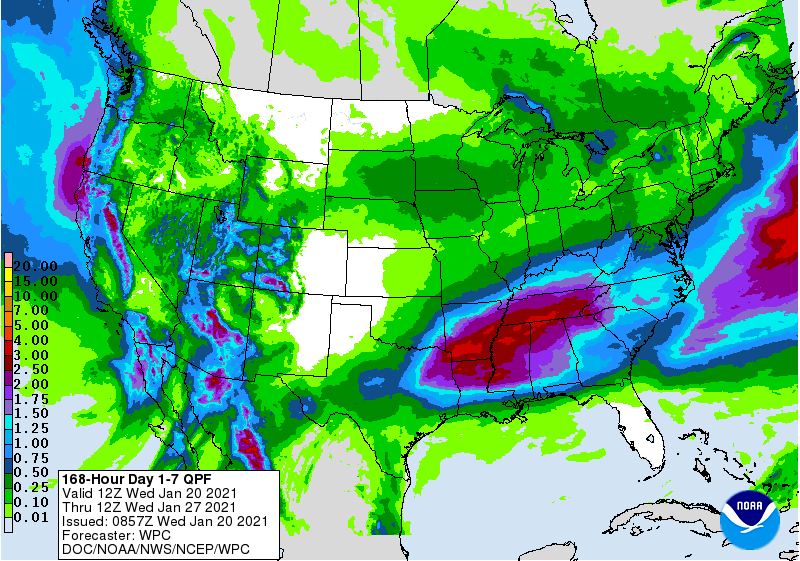
We have a few gray days coming up. Rain is expected to move in over southern and
eastern OK, mostly, on and off over the coming week, in an all too familiar
pattern.
I could dig some sunshine right about now, but what I really want is that WARMTH!
So bring on that higher sun angle, and longer daylight hours. But I'll be inside
on Feb. 20, and maybe outside on Oct. 20.
Gary McManus
State Climatologist
Oklahoma Mesonet
Oklahoma Climatological Survey
(405) 325-2253
gmcmanus@mesonet.org
January 20 in Mesonet History
| Record | Value | Station | Year |
|---|---|---|---|
| Maximum Temperature | 80°F | ALTU | 1999 |
| Minimum Temperature | 2°F | KENT | 2001 |
| Maximum Rainfall | 2.05″ | CLOU | 2010 |
Mesonet records begin in 1994.
Search by Date
If you're a bit off, don't worry, because just like horseshoes, “almost” counts on the Ticker website!