Ticker for January 4, 2018
MESONET TICKER ... MESONET TICKER ... MESONET TICKER ... MESONET TICKER ...
January 4, 2018 January 4, 2018 January 4, 2018 January 4, 2018
120 what?
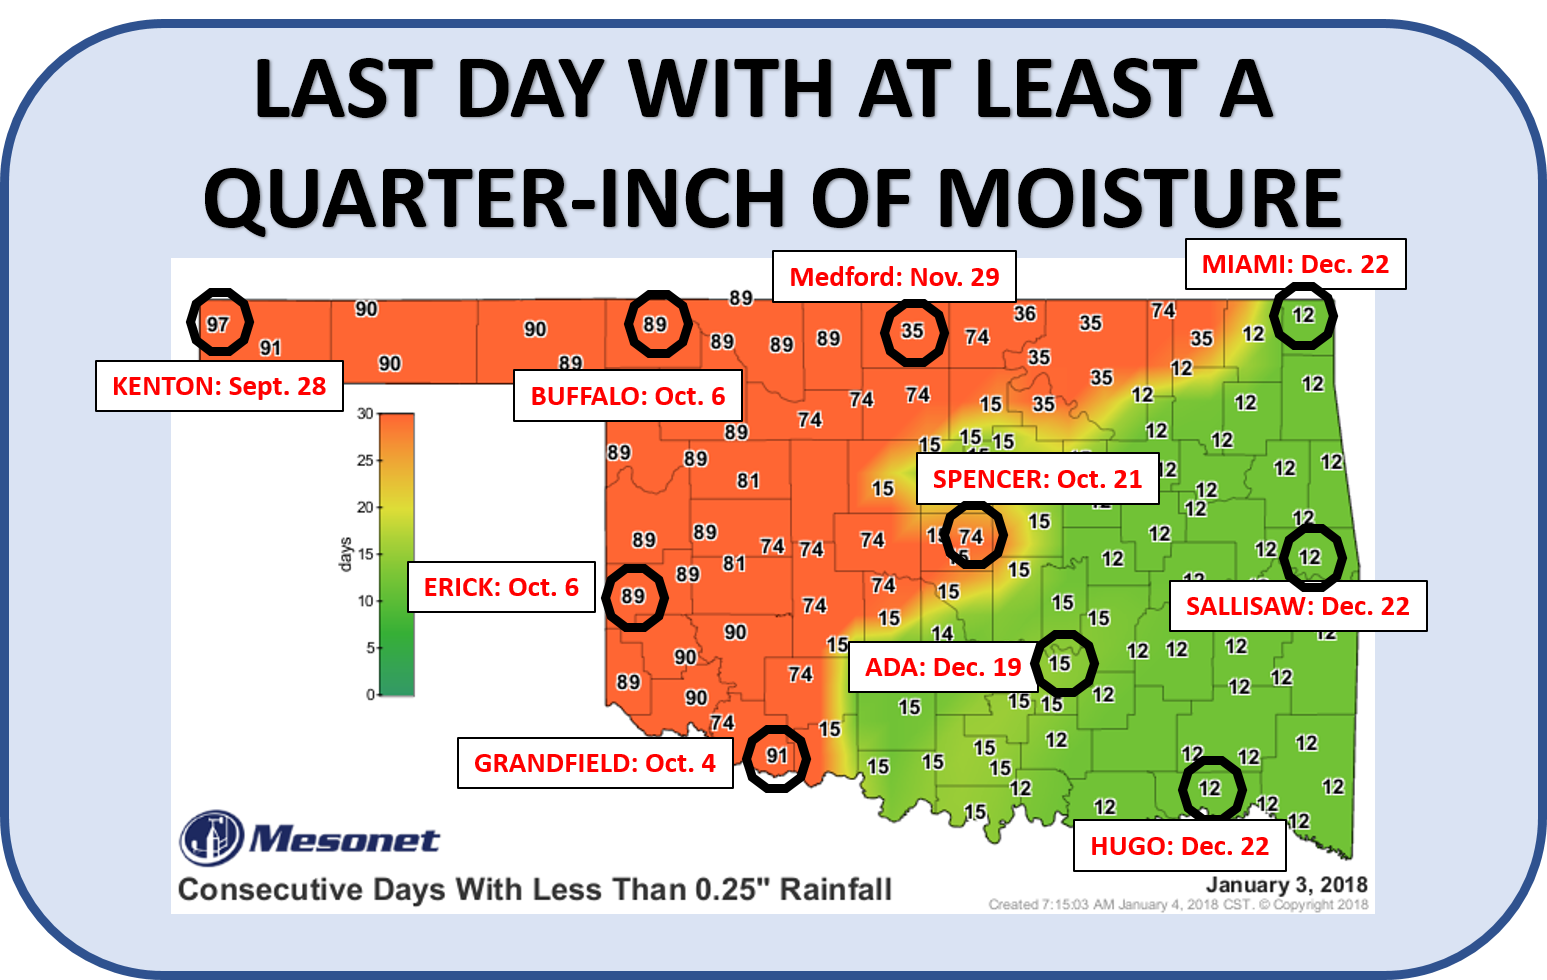
When it comes to drought, folks are somewhat fixated on these artificial time
constraints, constrained by how the data is presented. 30-day, 60-day, 90-day,
120-day, etc. Sometimes we forget that a 3-inch rain on day 90 and nothing
after that will look great on a 90-day rainfall map, but there were 89 days
afterwards with ZILCH! So I have awaited this day with grim anticipation when
our 90-day maps would finally show the actual dryness that is reality in the
fields, forests, ponds and streams across much of Oklahoma, especially those
wheat fields across the west.
Case in point...check out the 120-day rainfall maps.
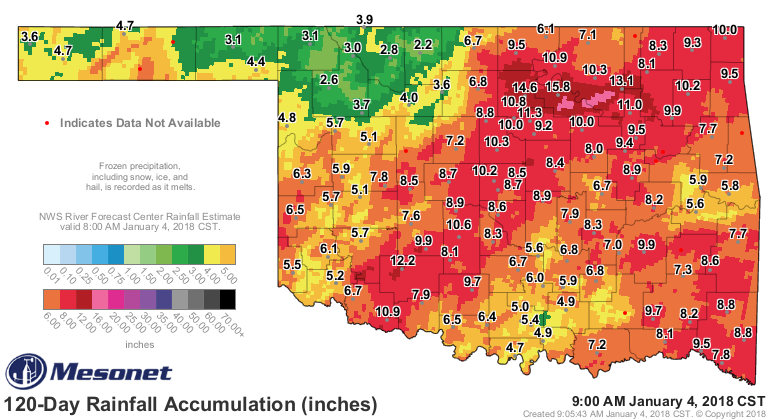
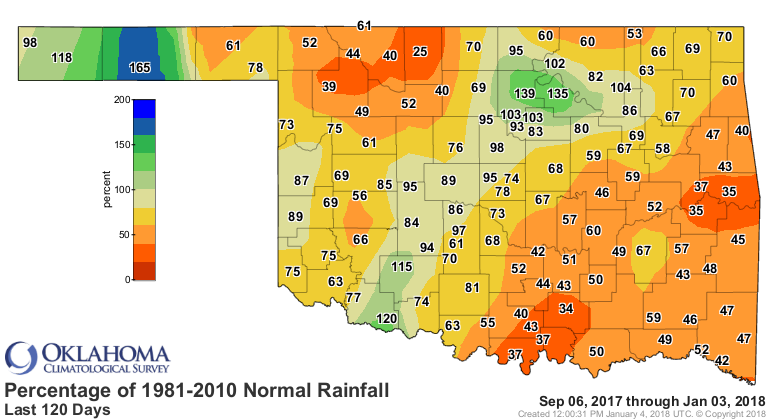
Wow, the Panhandle looks great! As does parts of north central and southwestern
Oklahoma. There can't be drought in those areas. Well, what do the 90-day maps
show?
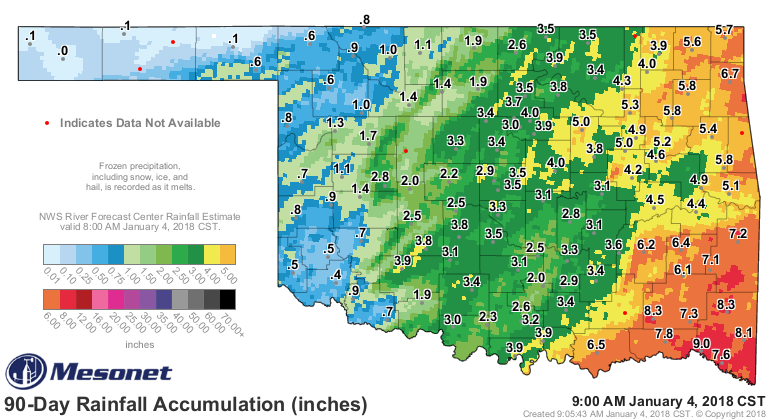
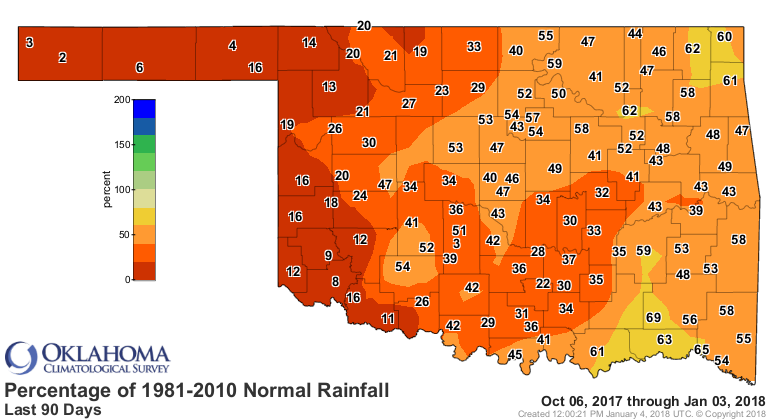
Yikes. While there are lots of pretty colors across far eastern Oklahoma, when
you get to the pct of normal map you see those totals are actually quite
underwhelming. And while these 90-day maps showed that moisture that has now
been pushed to the 120-day maps a few days ago, we then have to go to the 30-day
maps to see if there are any anomalies on the shorter scale.
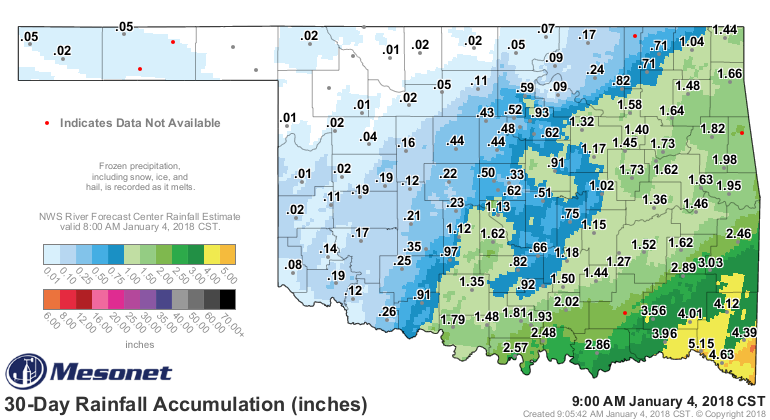
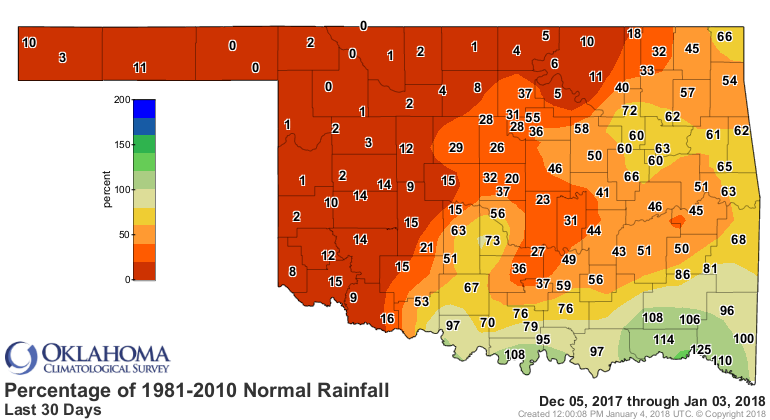
Aha! More pretty colors across far SE Oklahoma, but pretty colors don't mean
much unless you compare them to something. In this case, what would the normal
precipitation totals be for the last 30 days. Aha again! Now we see the dismal
display across the northwestern 7/8ths of the state remain, we see a bit of
relief in the SE on the short term.
So, what changed over the last few days, other than transferring that moisture
from the 90-day maps to the 120-day maps? Nothing, really. It's still just as
dry, the wheat is still just as thirsty, the cattle are still unable to graze
on wheat pasture that ain't there, or drink pond water that ain't there (or
frozen if it is there).
And THAT is why we rely on reports from the field...the county FSA and Extension
offices, the individual farmers, pond owners, lake level reports, soil moisture
data, etc.
So this all culminates in the brand new Drought Monitor map, which shows
worsening conditions across western Oklahoma, with severe drought now painted
in along the far western border with Texas.
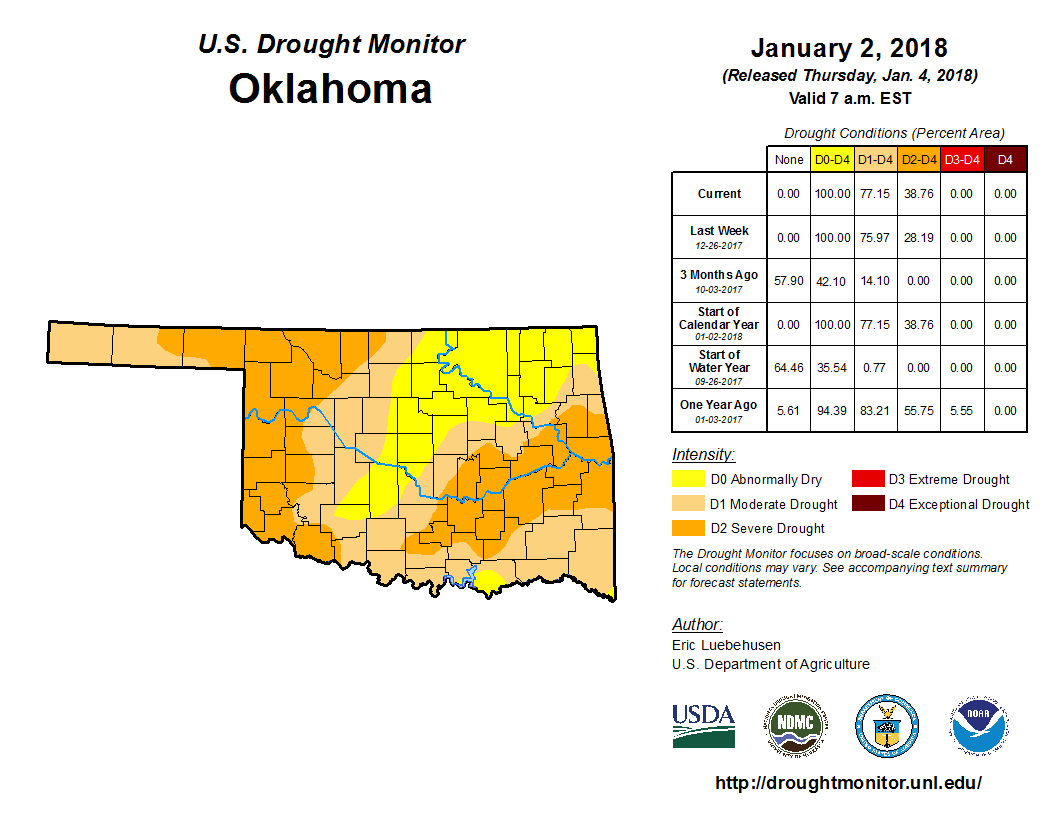
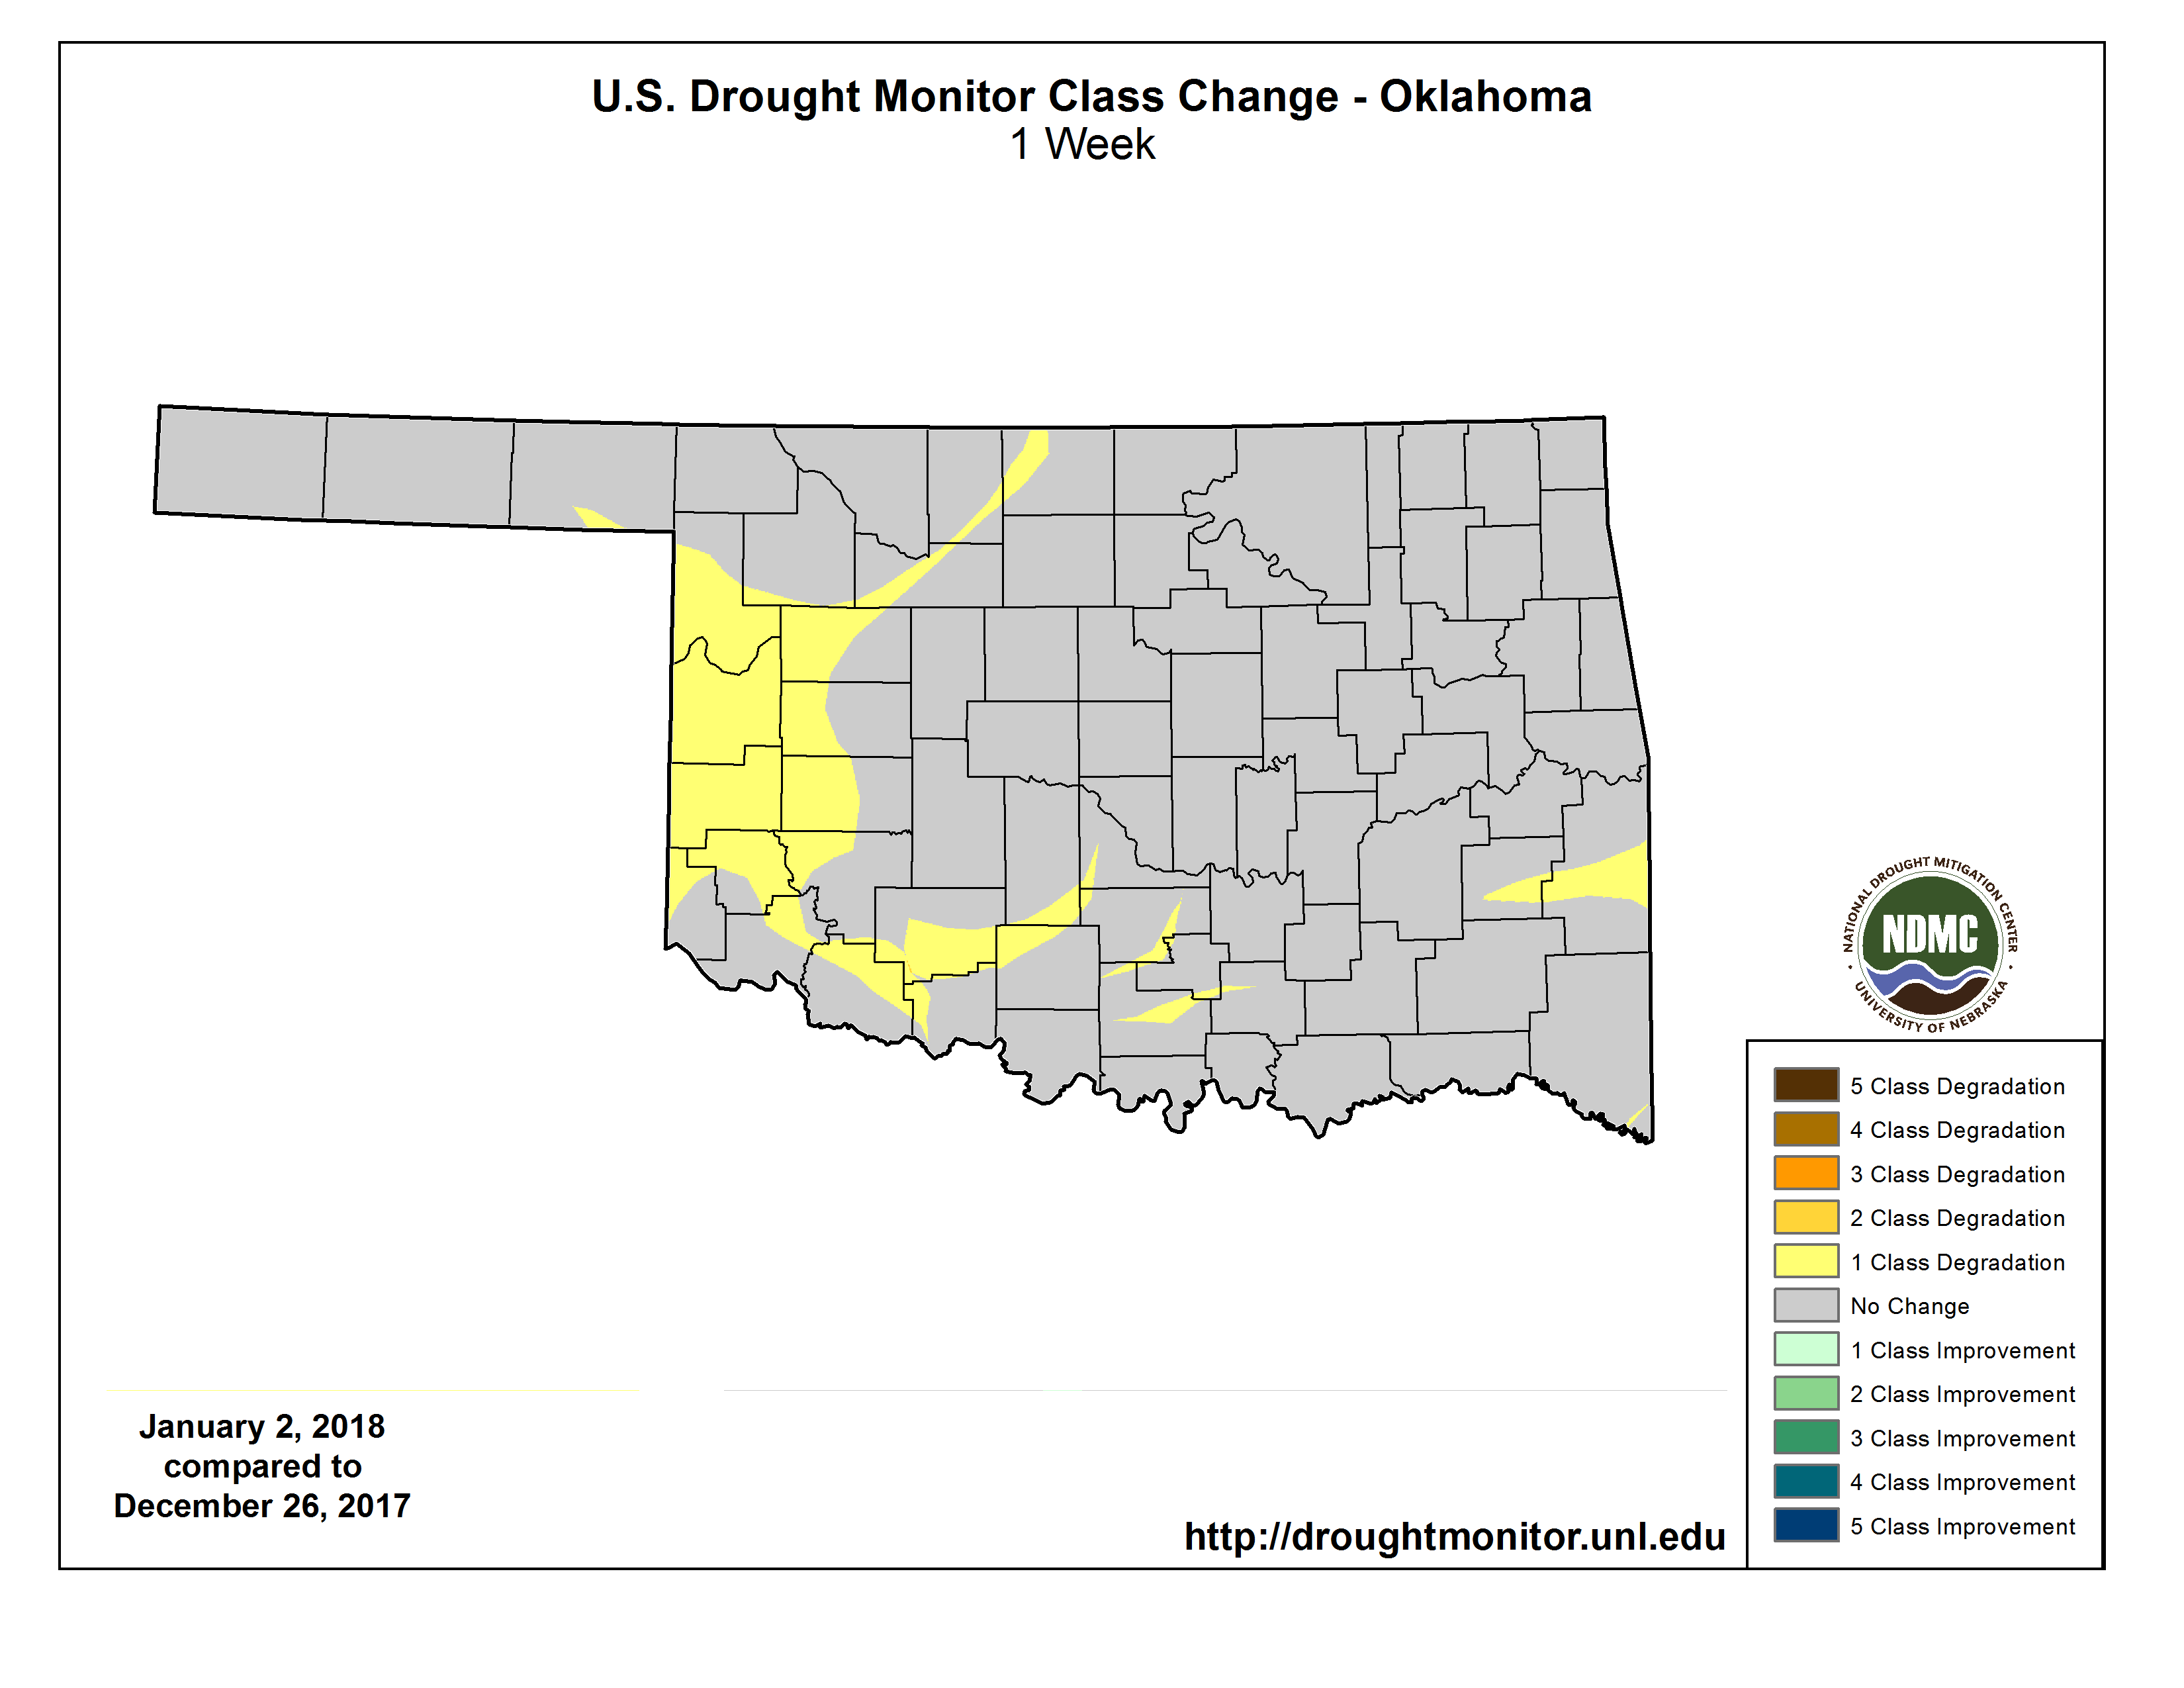
So what changed? Did it get drier over the last week? Sure. Did the drought
impacts worsen? Probably not, since we've been frozen for so long. So why did
things worsen? It's called catch-up, and not the kind you put on your burger or
hot dog. And why did we get that change? I refuse to answer another of my own
questions!
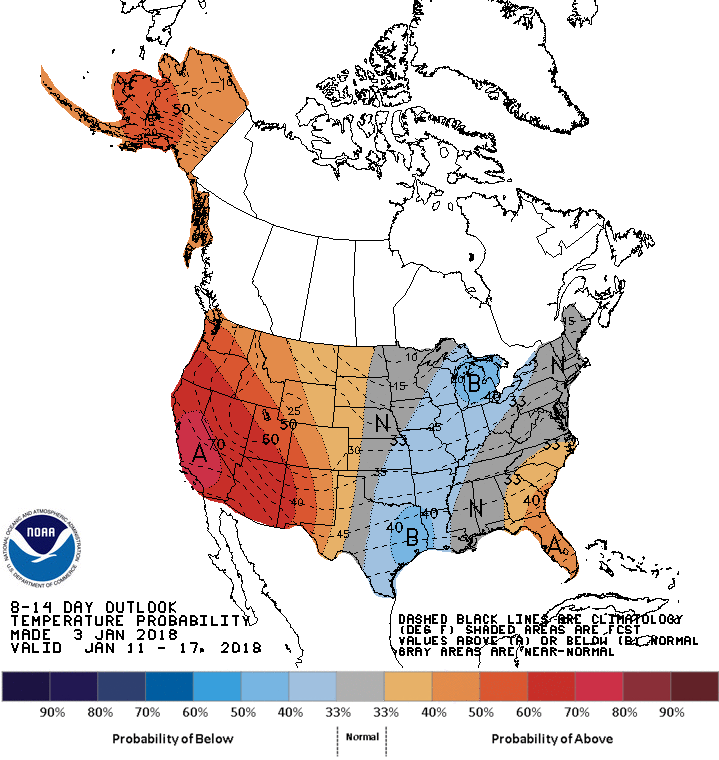
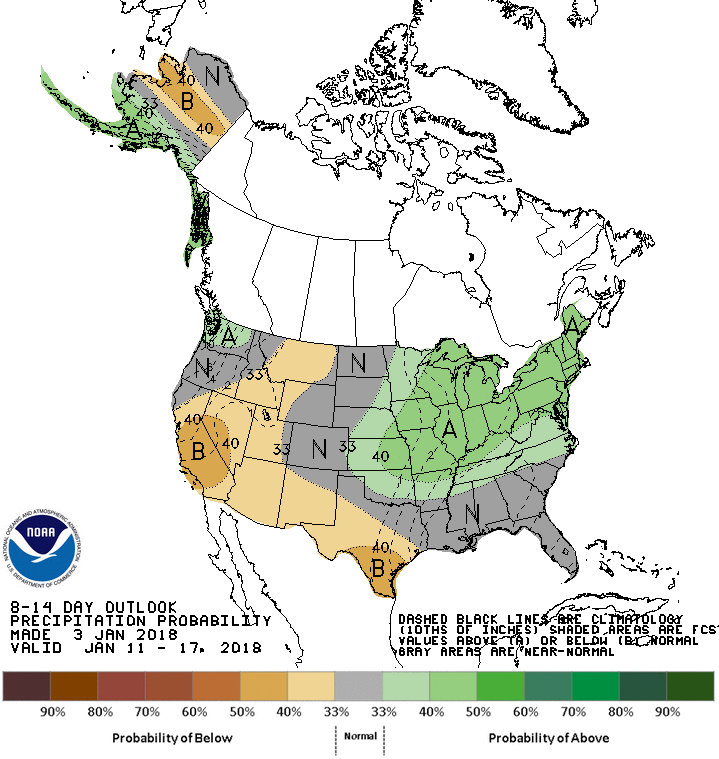
How about prospects for the future, at least through the next couple of weeks?
A bit bleak. CPC does show increased odds for above normal precip in the 8-14
day outlook, but above normal in January is not exactly a bouncy. It CAN be,
but normal for this time of year is not a drought buster, unfortunately.
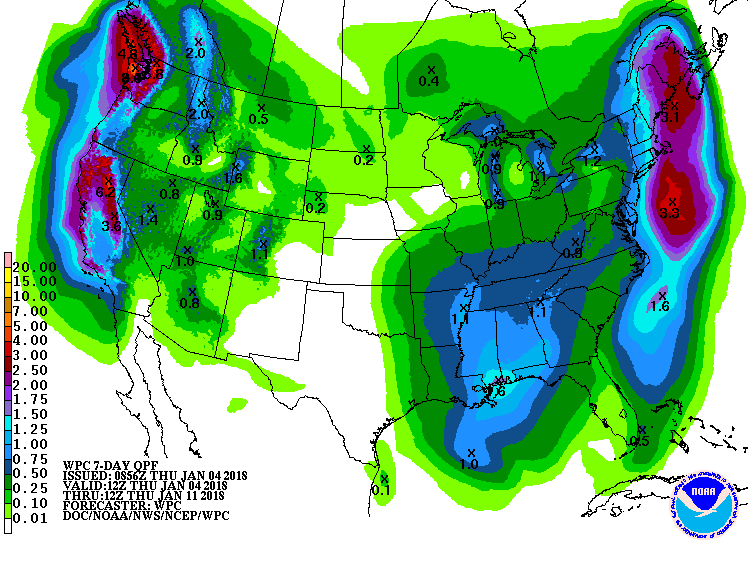
Oh by the way, add a day onto all those dates on that first graphic. It ain't
gonna rain today, I'm afraid.
Gary McManus
State Climatologist
Oklahoma Mesonet
Oklahoma Climatological Survey
(405) 325-2253
gmcmanus@mesonet.org
January 4 in Mesonet History
| Record | Value | Station | Year |
|---|---|---|---|
| Maximum Temperature | 72°F | HOLL | 2022 |
| Minimum Temperature | -6°F | BOIS | 2015 |
| Maximum Rainfall | 5.42″ | COOK | 1998 |
Mesonet records begin in 1994.
Search by Date
If you're a bit off, don't worry, because just like horseshoes, “almost” counts on the Ticker website!