Ticker for August 17, 2017
MESONET TICKER ... MESONET TICKER ... MESONET TICKER ... MESONET TICKER ...
August 17, 2017 August 17, 2017 August 17, 2017 August 17, 2017
Reverse summer
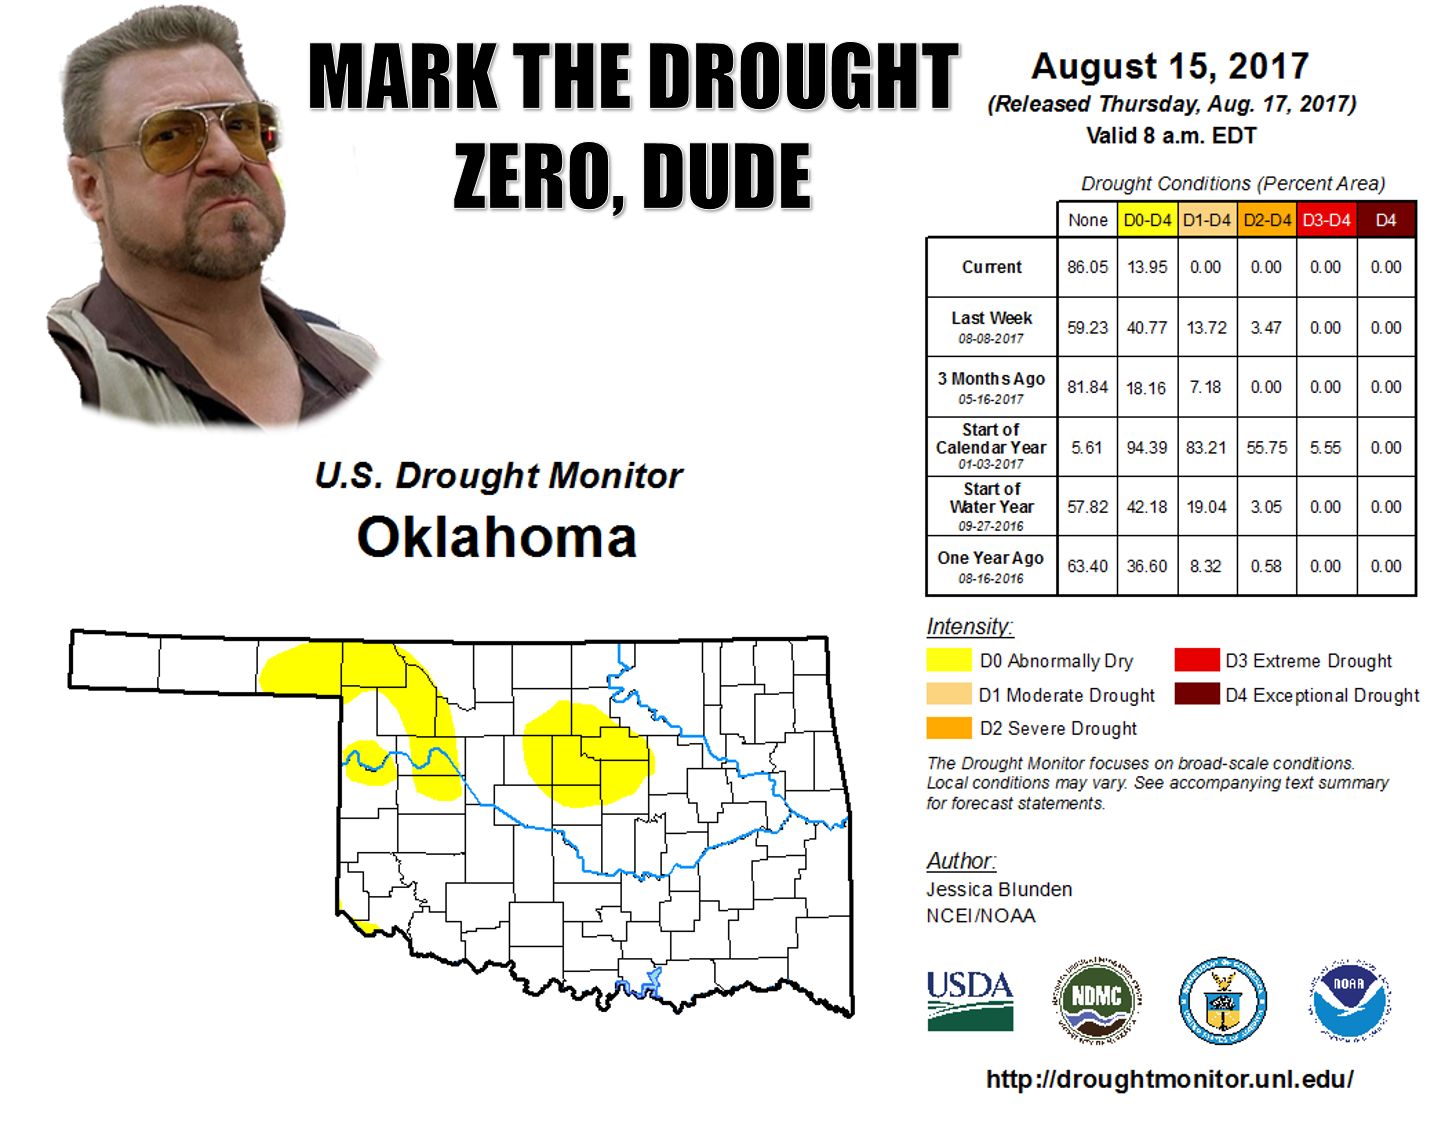
So a title playing on Shakespeare, and a meme playing on "The Big Lebowski?" What
is that, some sort of sick joke (et tu, "Full Metal Jacket??)? Well, all are some
of the best fictional works of art the world has seen, but so has this August in
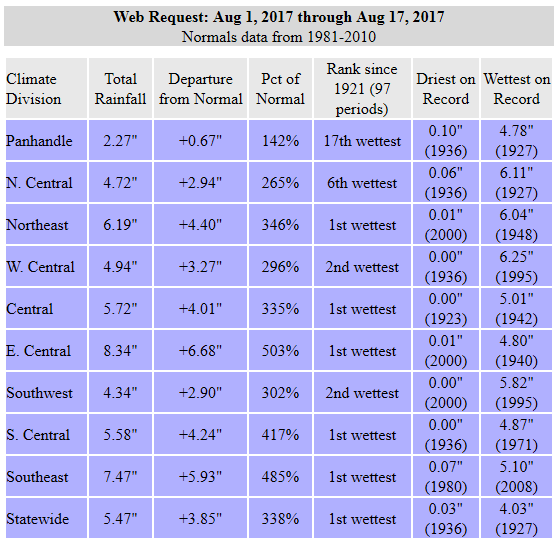
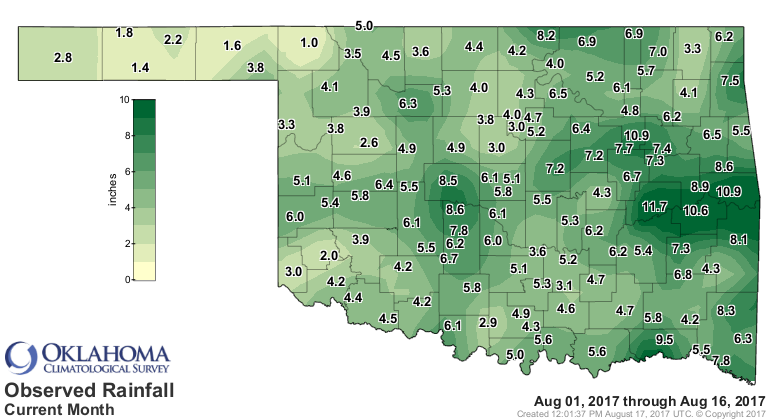
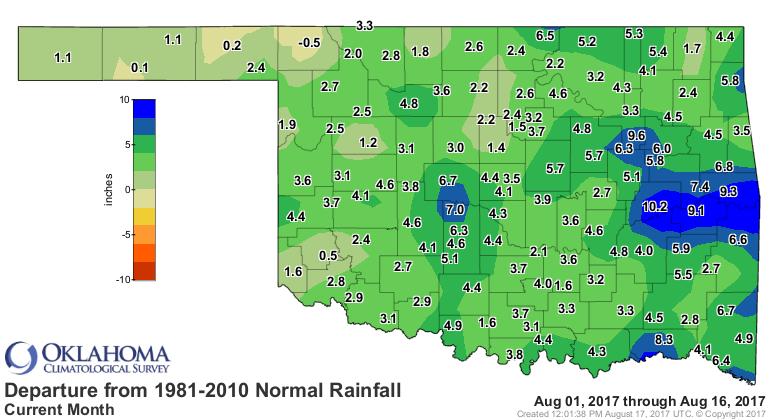
Oklahoma. Except it ain't fiction. After last night's destructive storms, the
statewide average rainfall total now stands at 5.47 inches according to the
Oklahoma Mesonet, good for the seventh wettest August since records began in 1895!
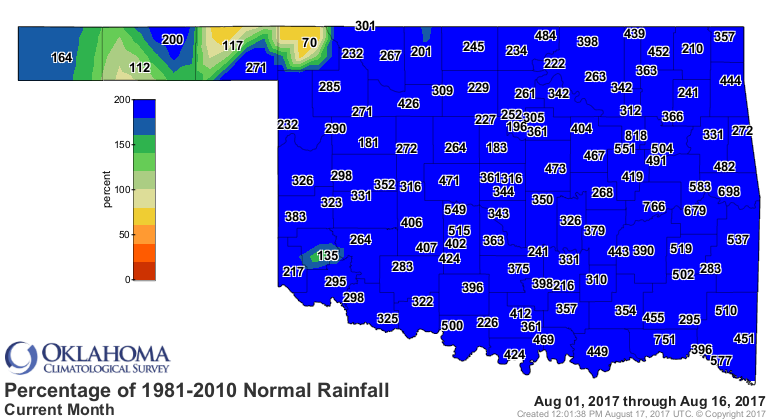
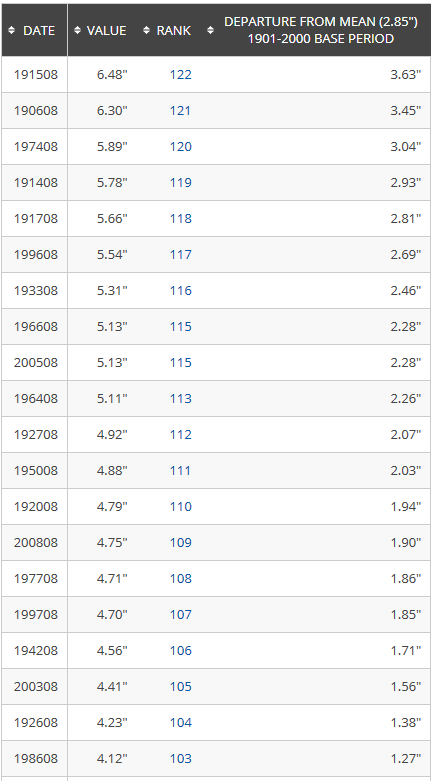
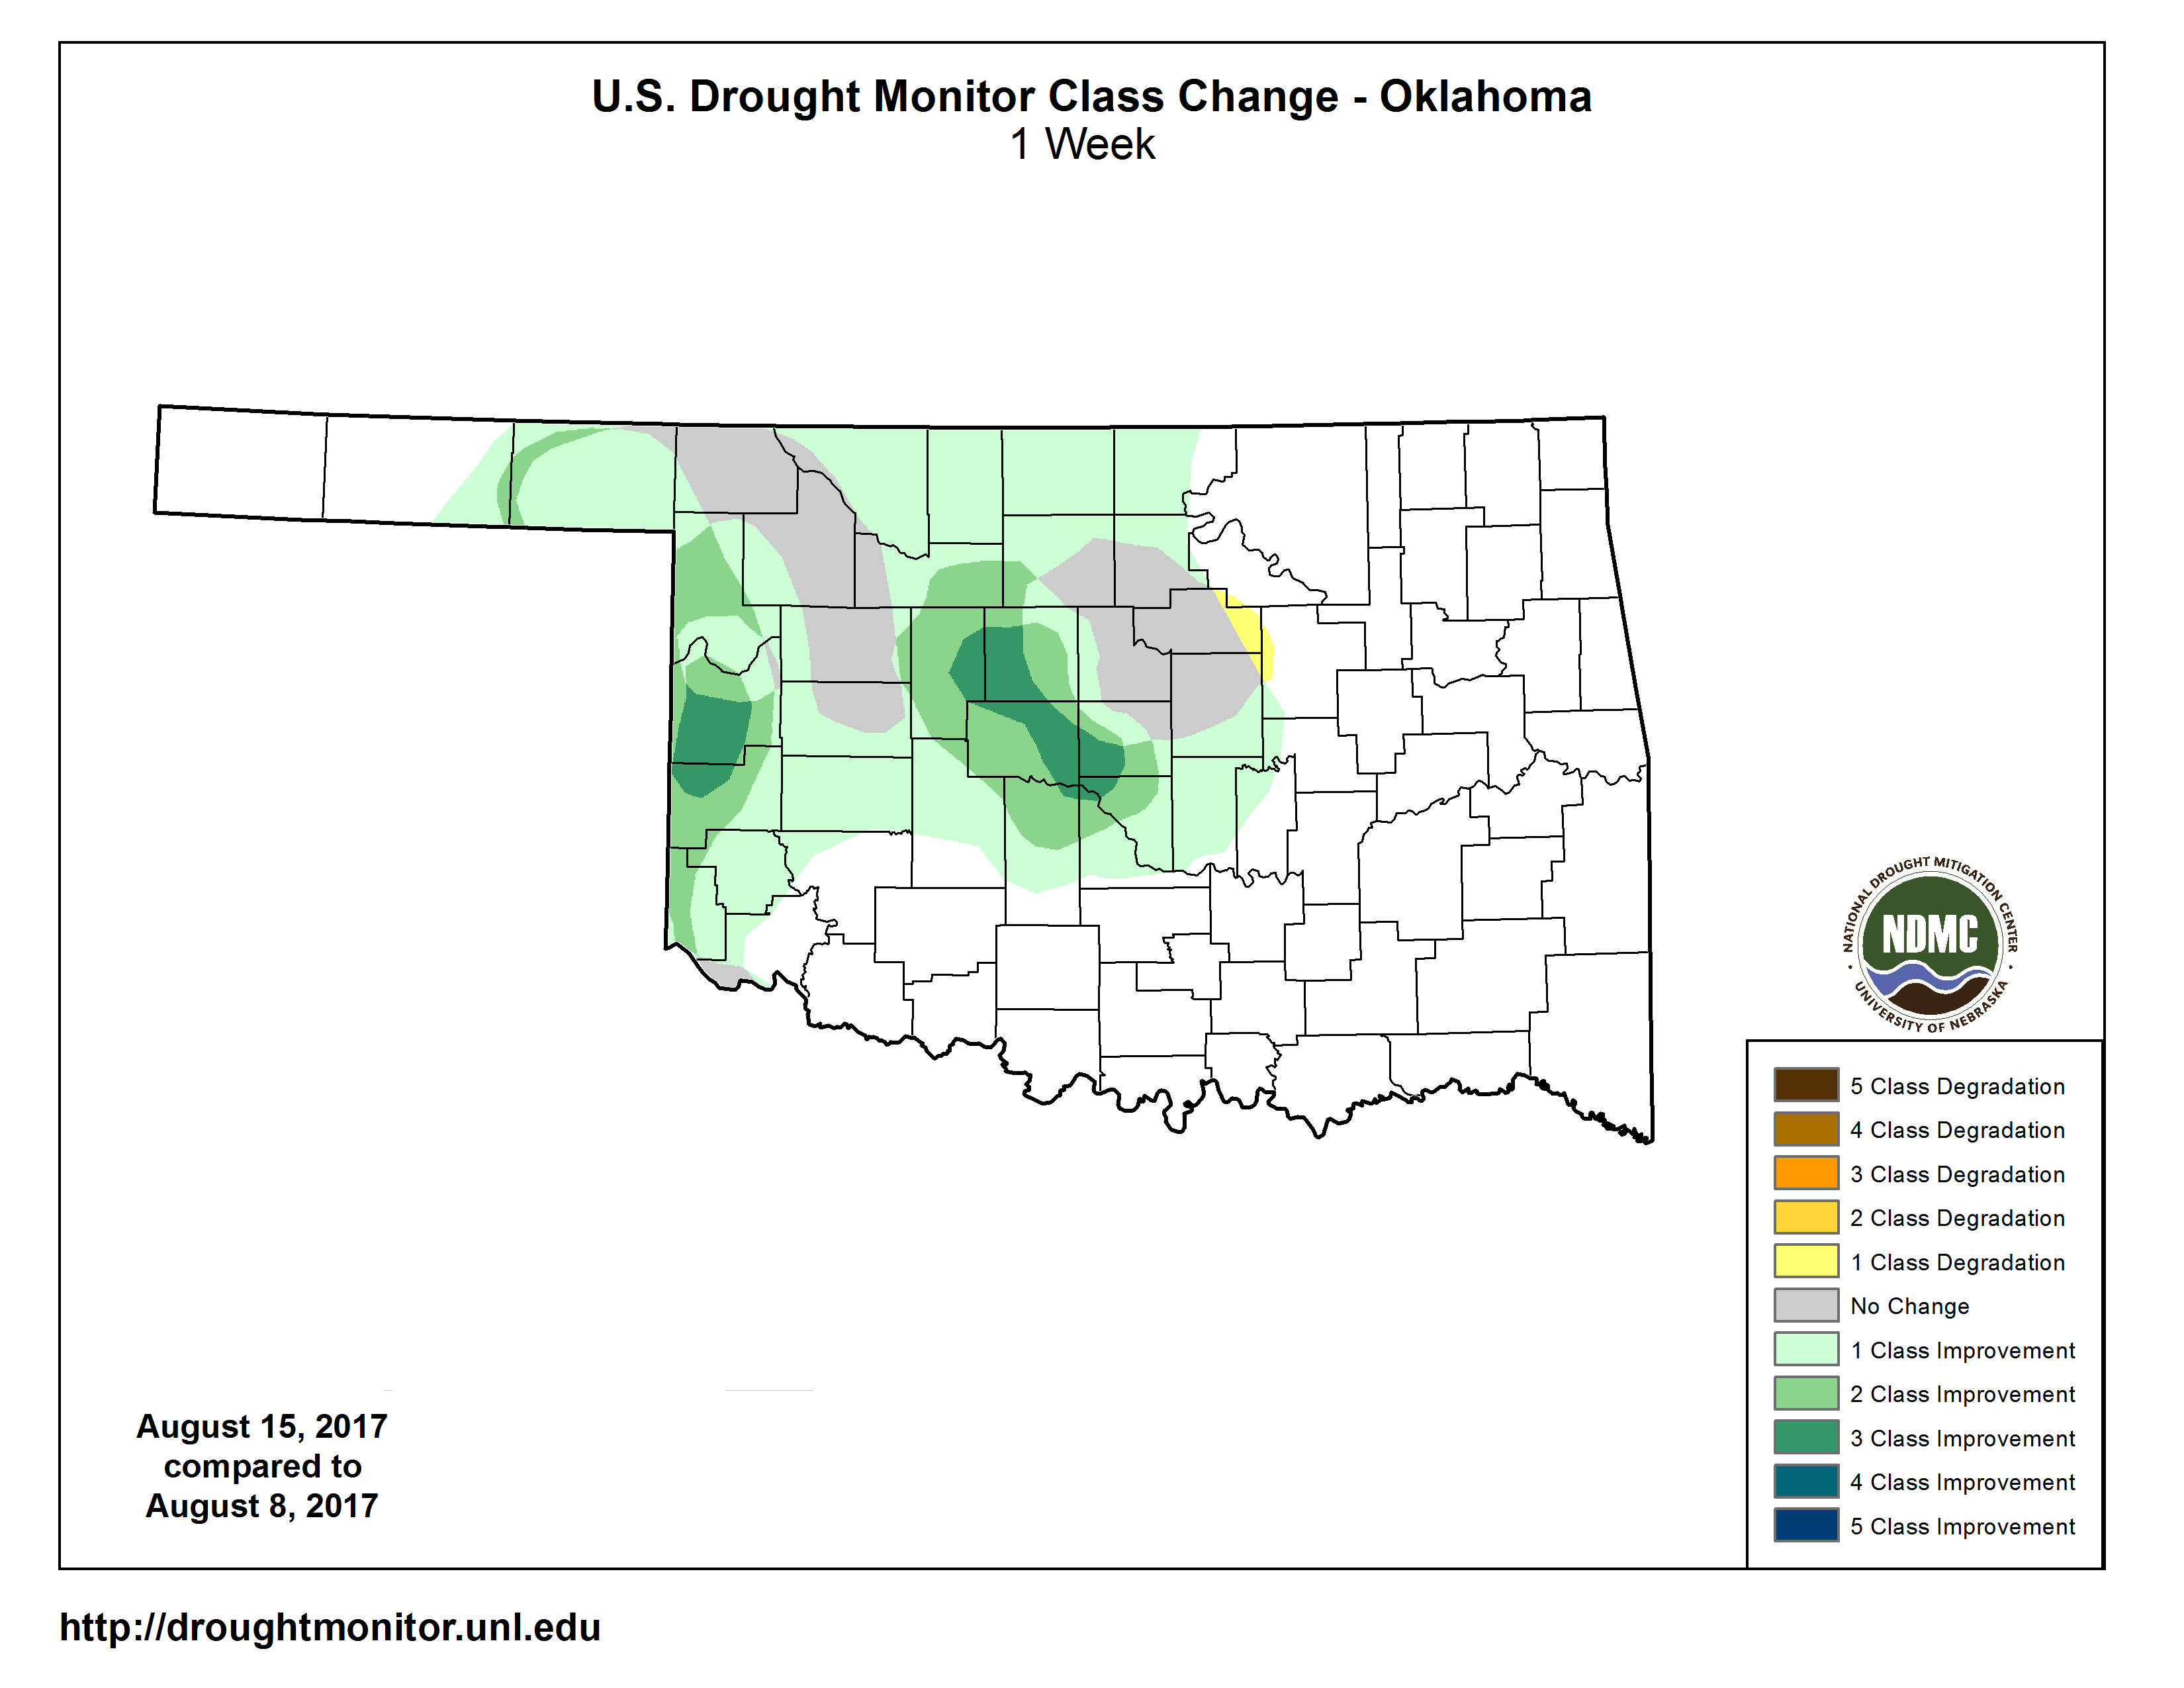
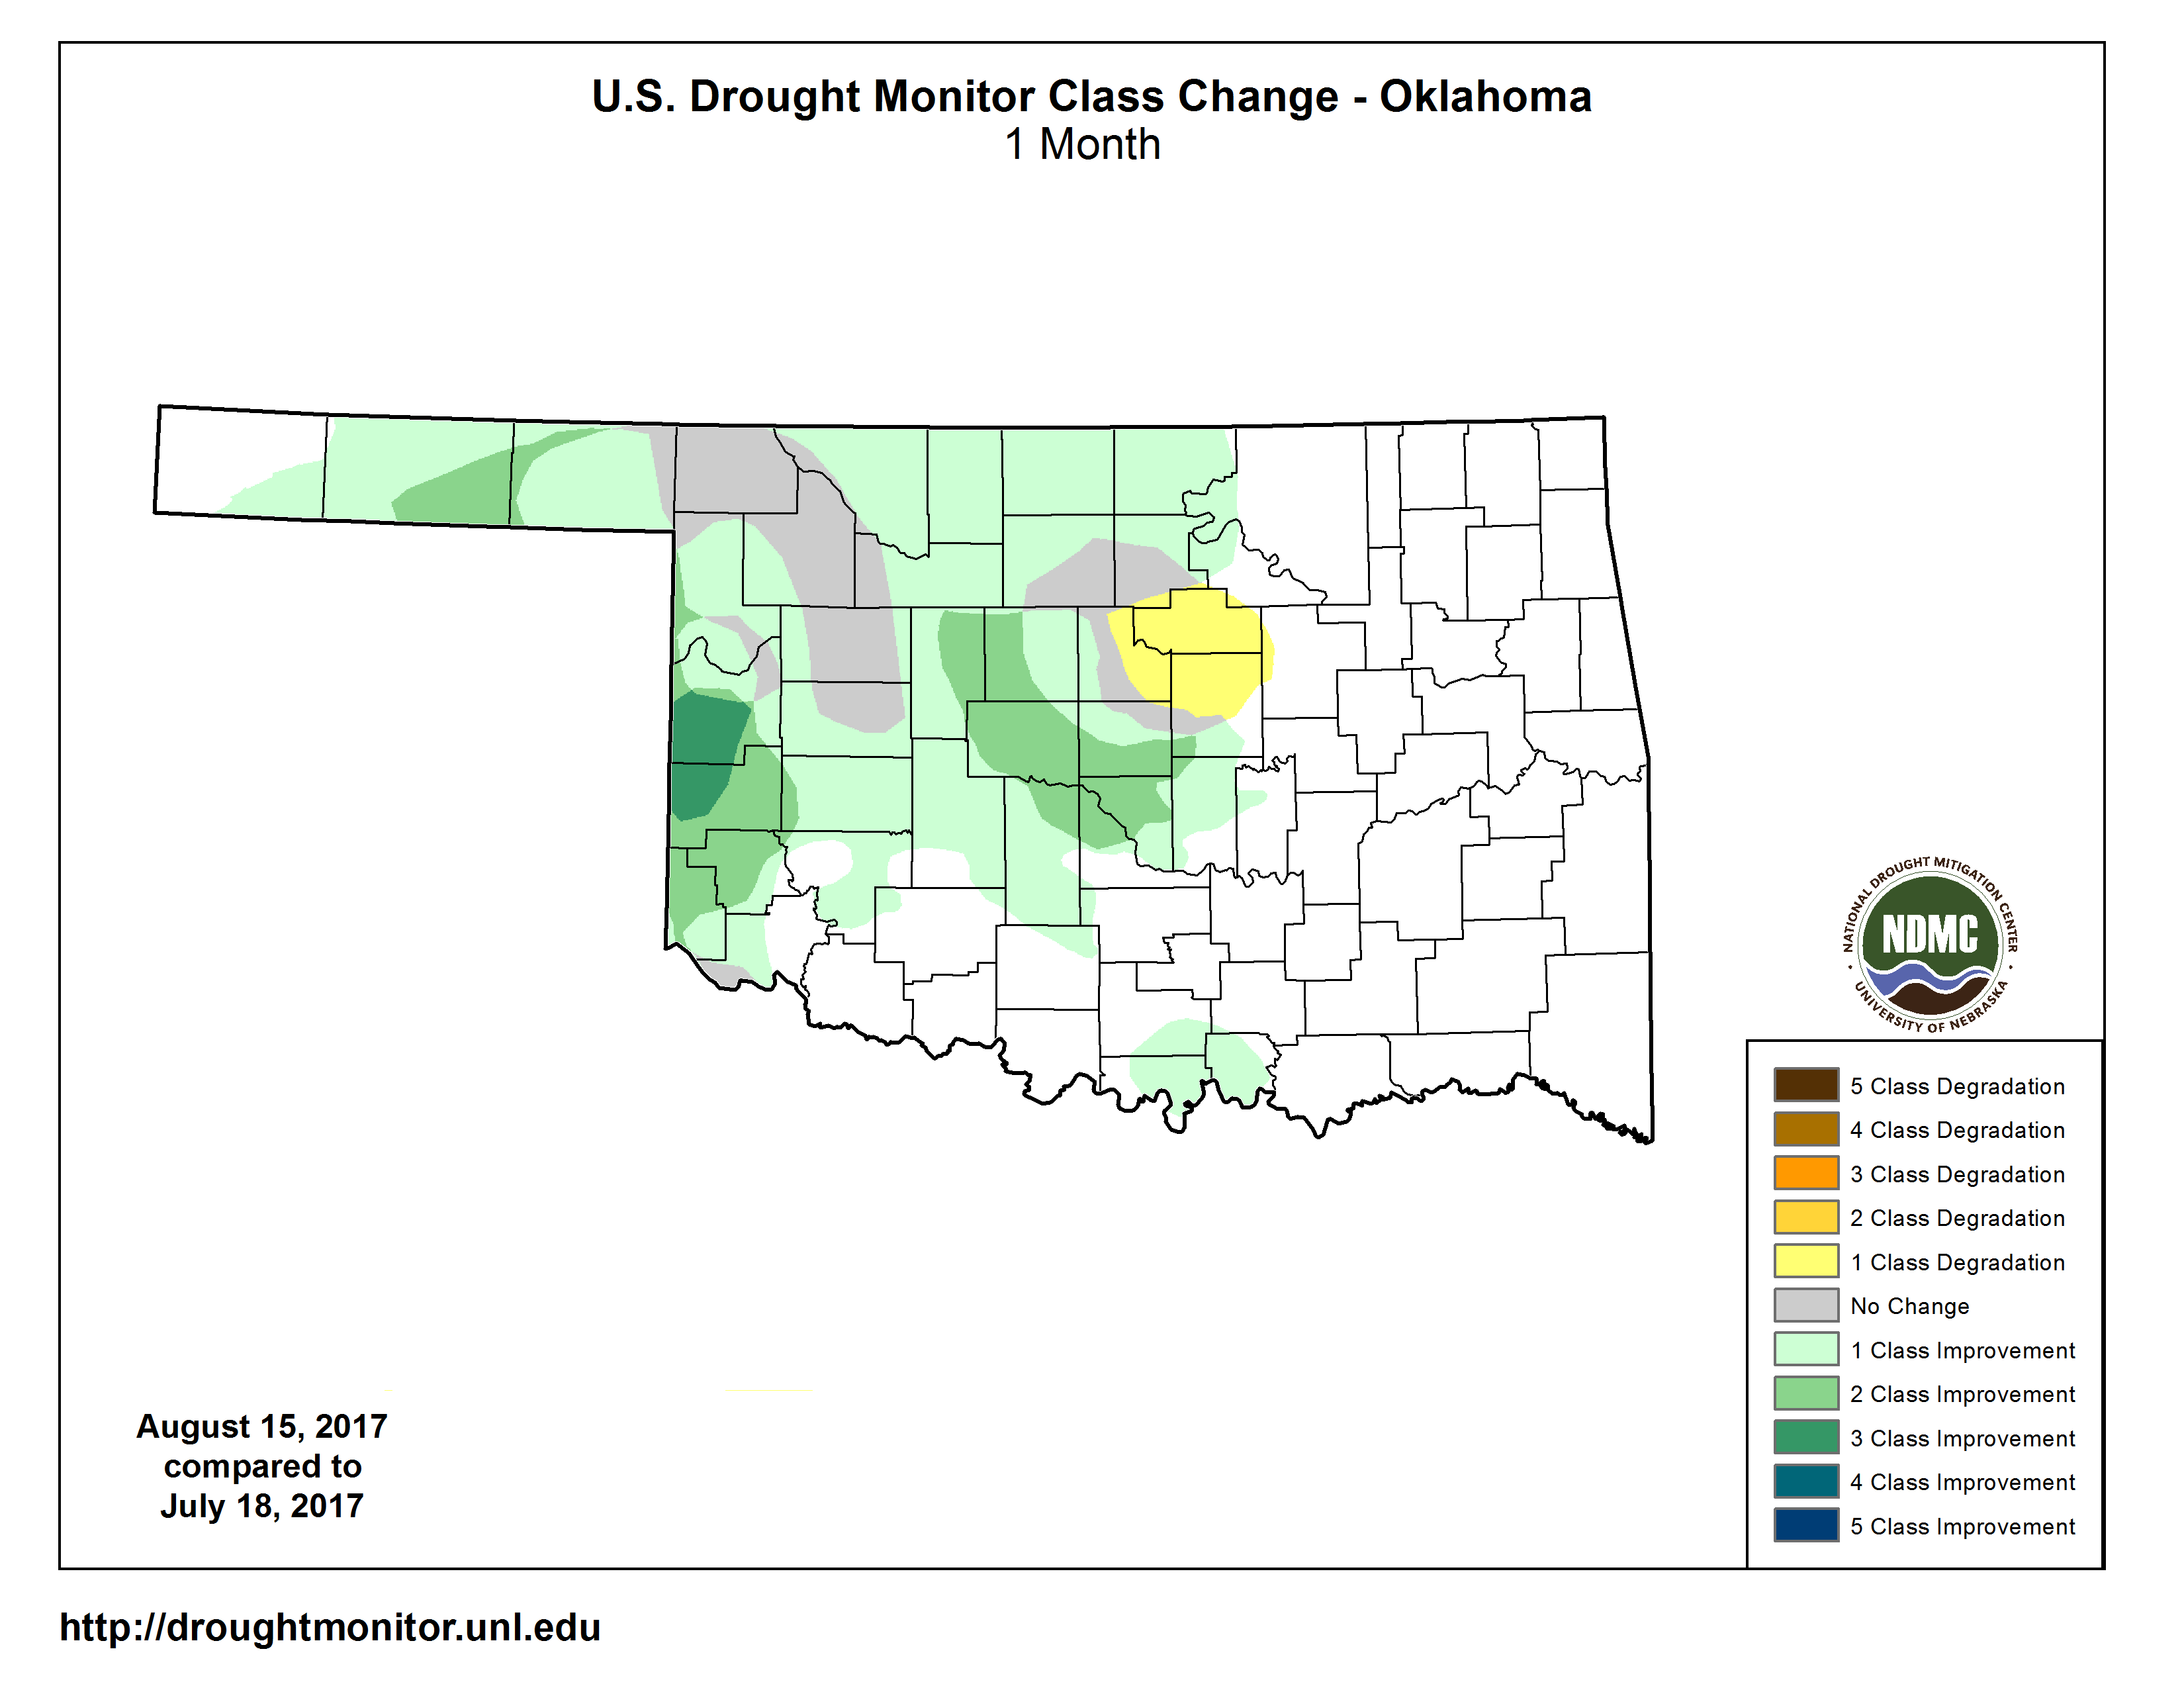
But it has fully eradicated the drought in the state. There are still some areas
that are questionable between D1 (moderate drought) and the non-drought status
of D0 (abnormally dry), but no glaring areas now.
It seems we've had something I'm calling a "reverse summer." Normally we'd see
a good wet period in May and June, then a drying out with blast furnace
temperatures as we travel from July into August. Well, just the opposite this
year, at least somewhat. Dry weather during May/June, heat in June and July, and
then bountiful rainfall in August. So if you started in August and worked
backwards...well, there you go. Reverse summer.
The question is, where are the drought impacts in mid-August if we've seen so
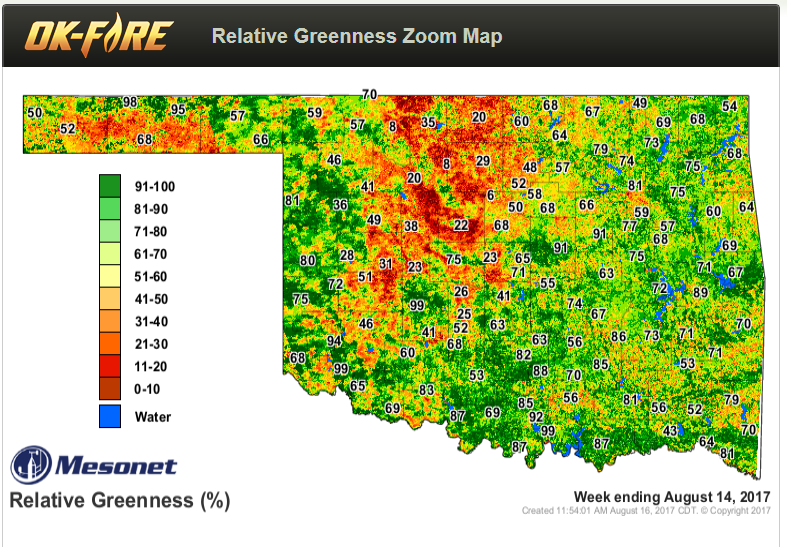
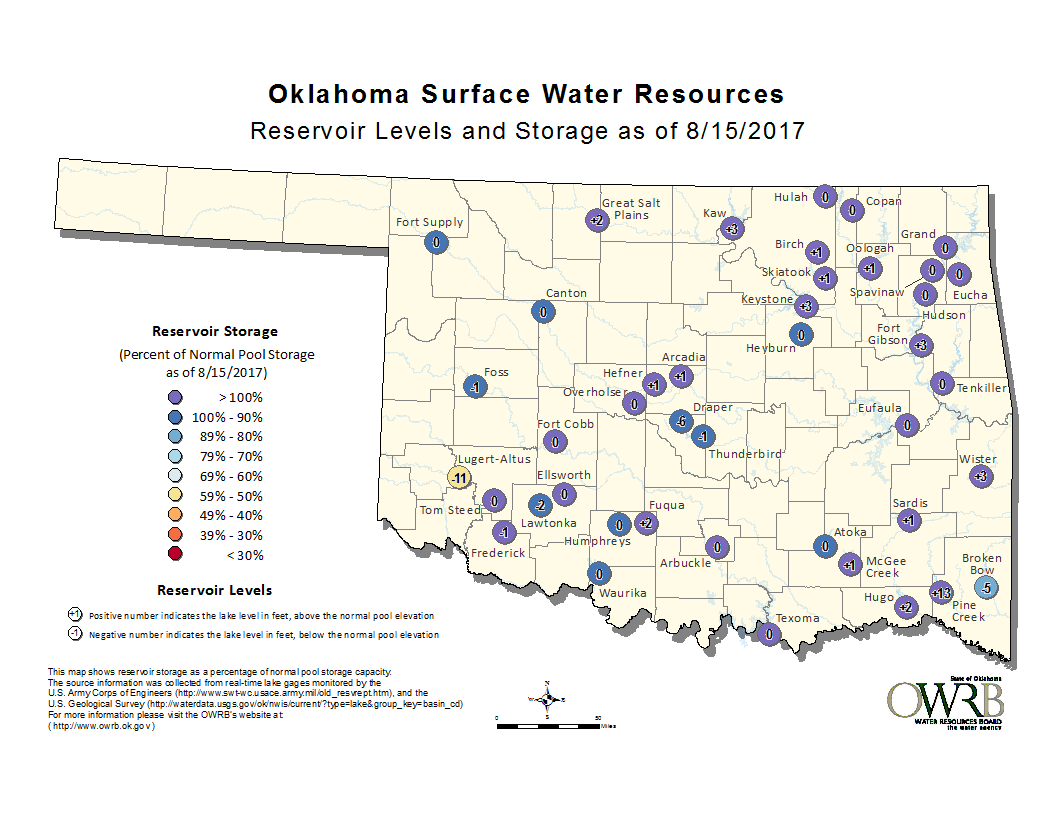
much rainfall? The state is green as it has ever been, the reservoirs are full
and the soil moisture is outstanding (notice the wheat belt across western OK
on the relative greenness map...for the most part, those are plowed or fallow
fields).

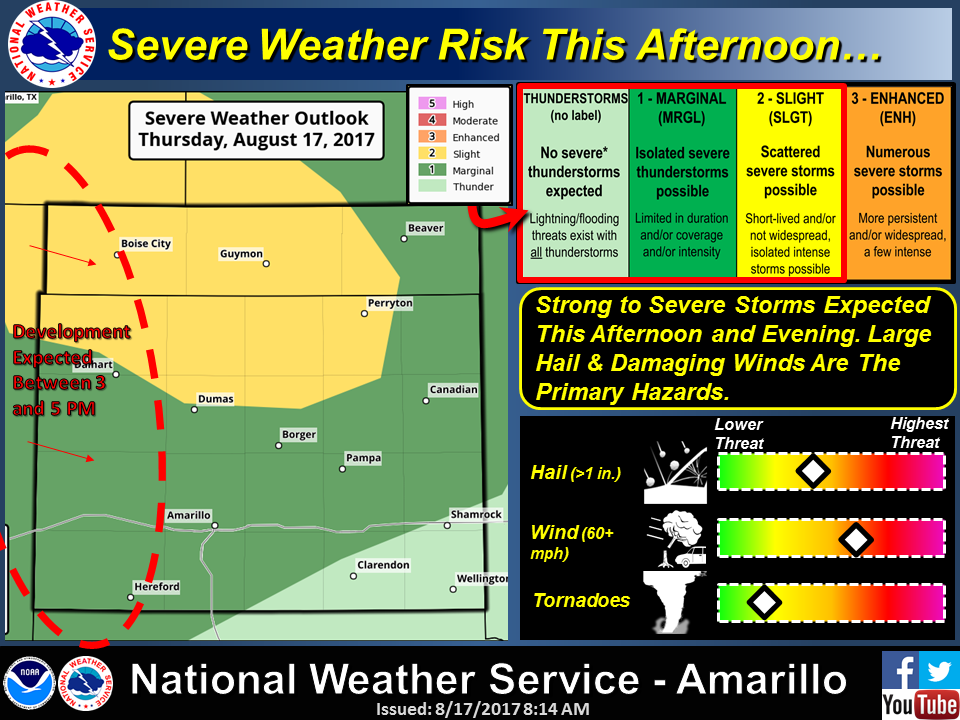
And the rain chances aren't over. We're going to see the threat of severe weather
return with those rain chances as well.
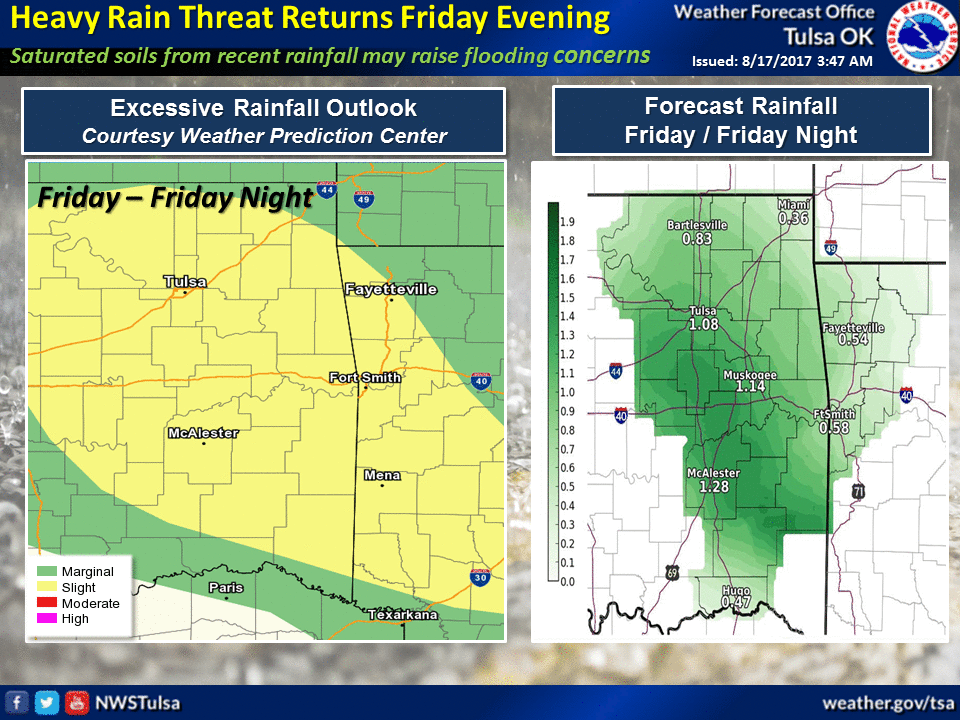

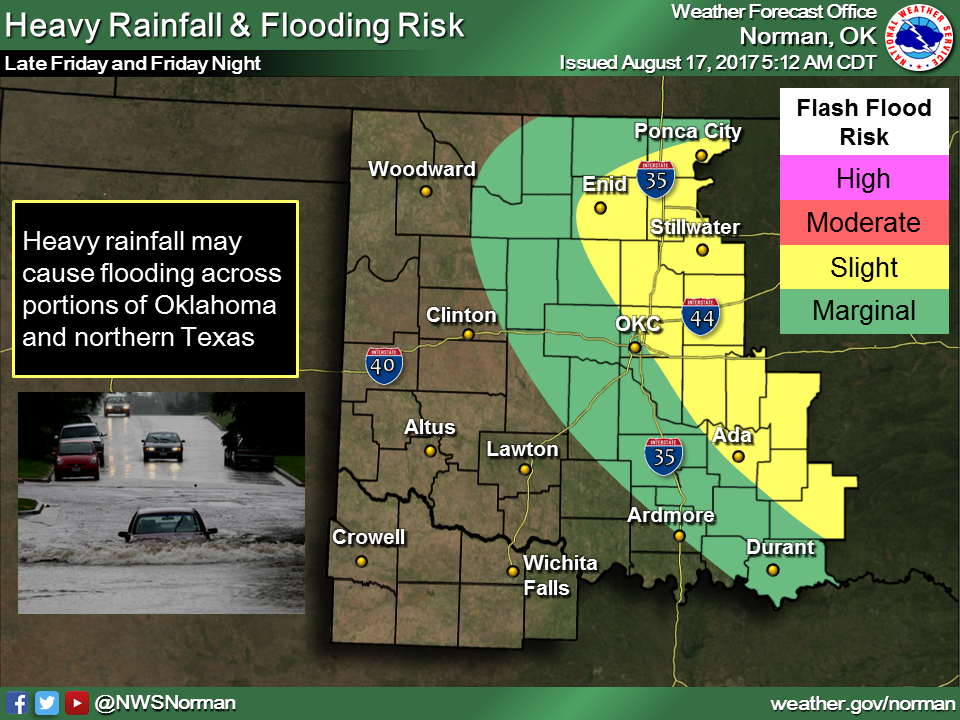
So another 1-2 inches are possible across the state.
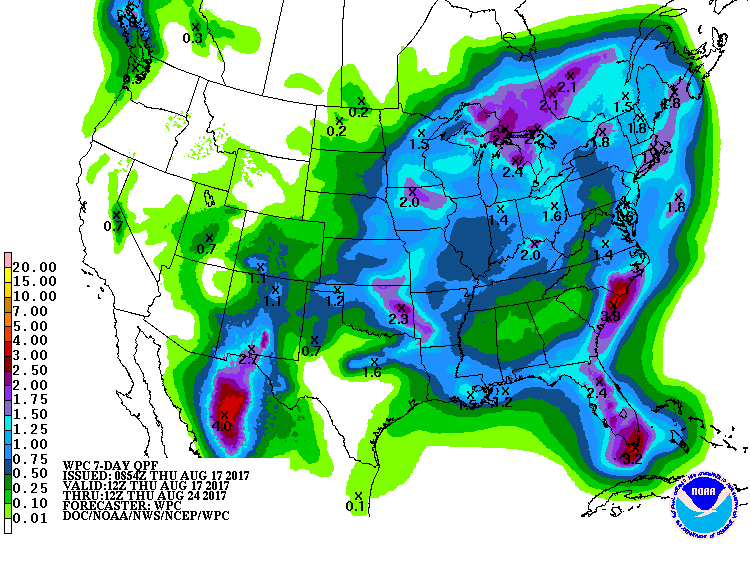
After that, summer returns as the heat dome builds back into our region. And
after all this rain, don't expect heat. Expect miserable, at least for a few
days.
Some have asked how we arrive at these statewide average rainfall totals for
different periods. Well, with the Mesonet data it's pretty simple. We take the
average of all the Mesonet sites within each climate division (there are 9 in
Oklahoma
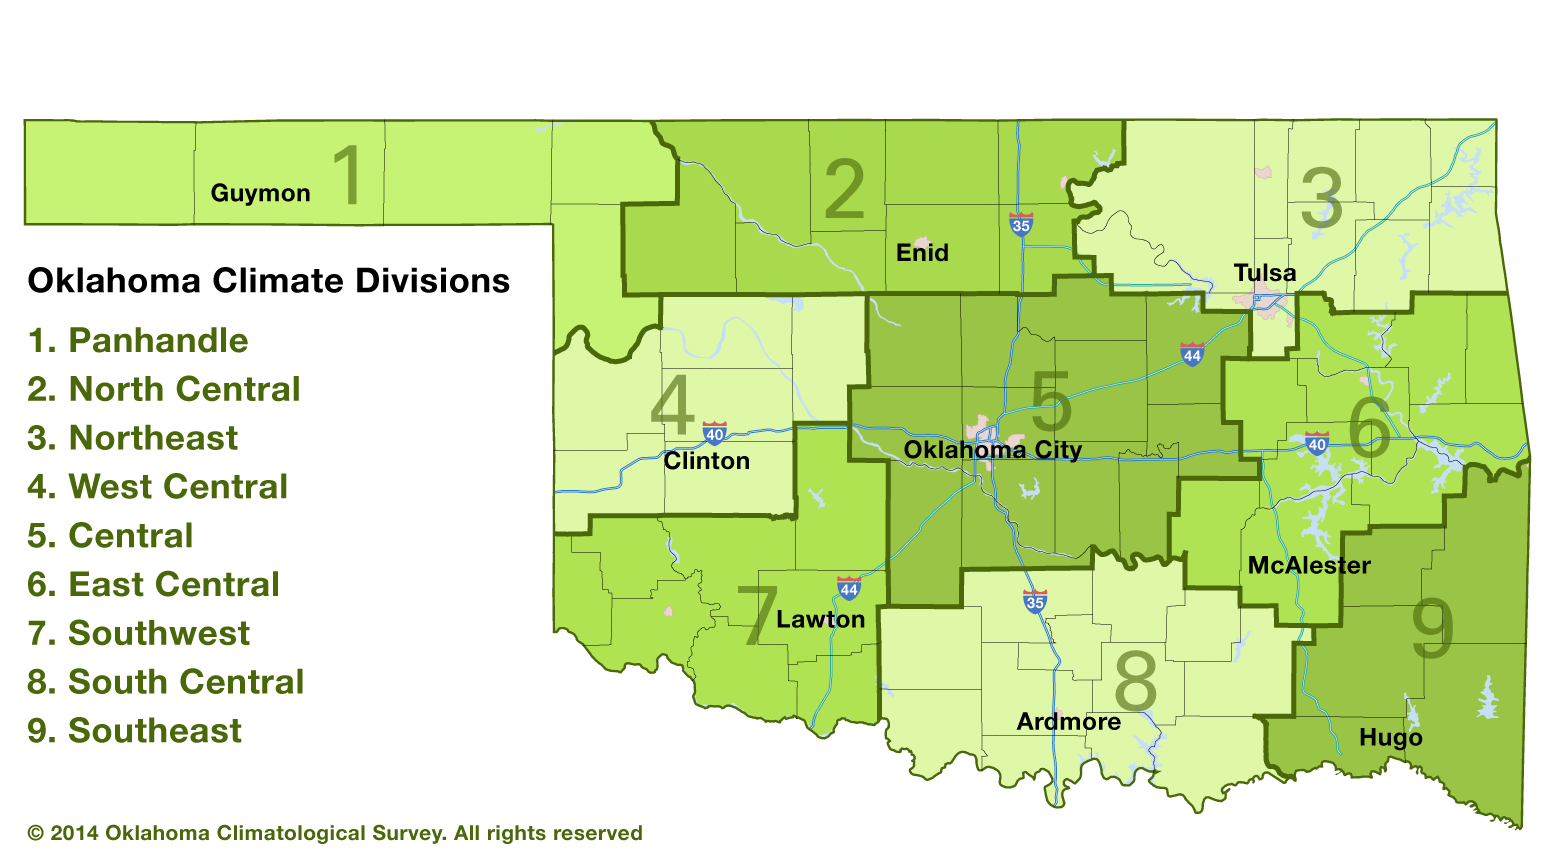
Then we multiply each average within the 9 climate divisions by a specific
weighting factor to account for areal differences, then add those nine together
to get the statewide average. This is done to ensure that a climate division
with more stations, or data points, doesn't have undue influence on the overall
statewide average (although it's obvious that Climate Division 1 should have
greater influence, since it contains the town of Buffalo).
1915 will fall...I'm calling it!
Gary McManus
State Climatologist
Oklahoma Mesonet
Oklahoma Climatological Survey
(405) 325-2253
gmcmanus@mesonet.org
August 17 in Mesonet History
| Record | Value | Station | Year |
|---|---|---|---|
| Maximum Temperature | 114°F | GRA2 | 2023 |
| Minimum Temperature | 53°F | ANTL | 1999 |
| Maximum Rainfall | 5.78″ | MEDF | 2009 |
Mesonet records begin in 1994.
Search by Date
If you're a bit off, don't worry, because just like horseshoes, “almost” counts on the Ticker website!