Ticker for October 27, 2016
MESONET TICKER ... MESONET TICKER ... MESONET TICKER ... MESONET TICKER ...
October 27, 2016 October 27, 2016 October 27, 2016 October 27, 2016
Drought makes a push in the NW
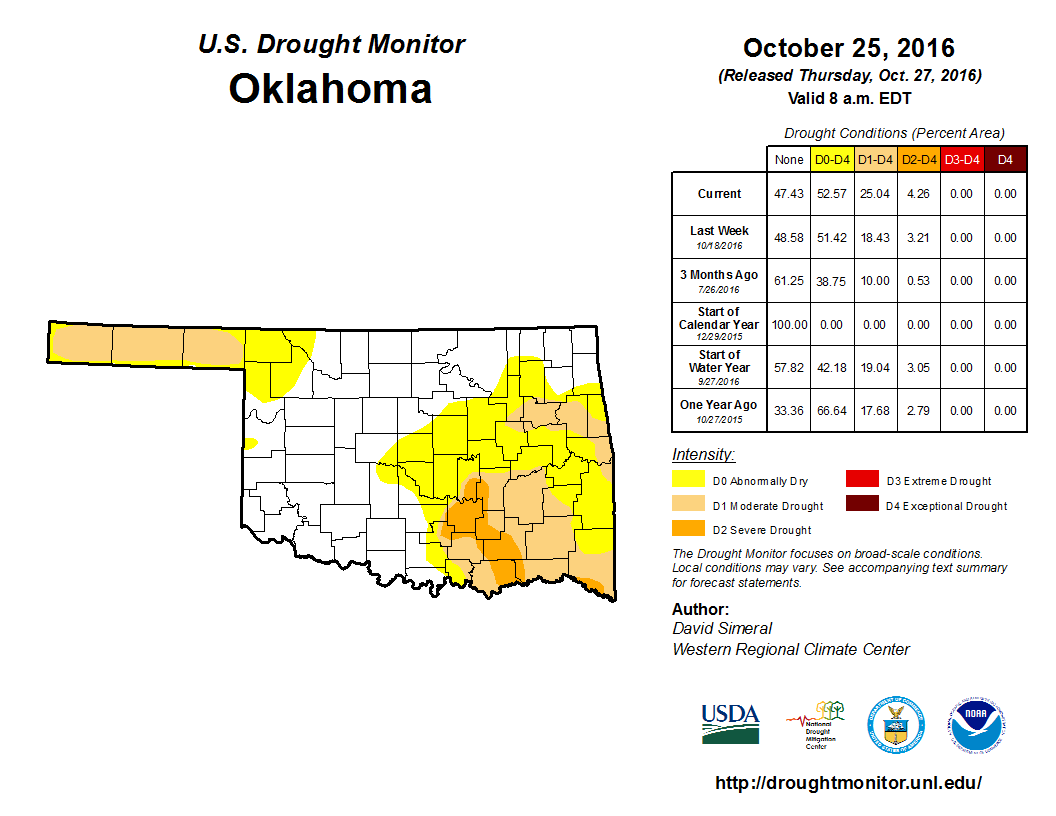
Well, we saw this coming a mile (or 200-500) away. Just a look at the rainfall
maps for the last 30 days, in addition to remembering that area was in the 100s
a week ago, indicated more Drought Monitor colors were to come.
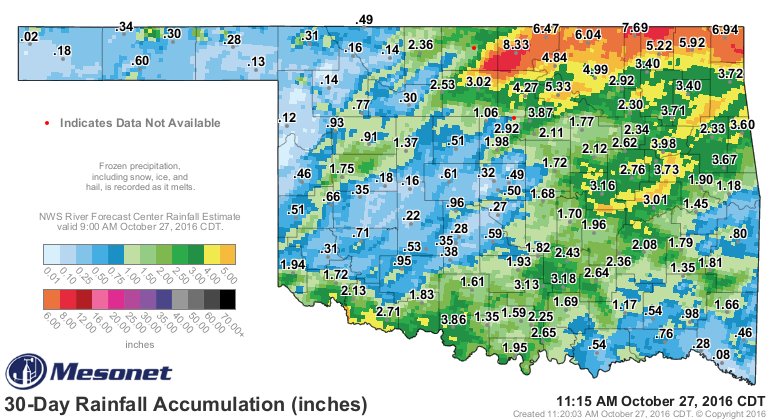
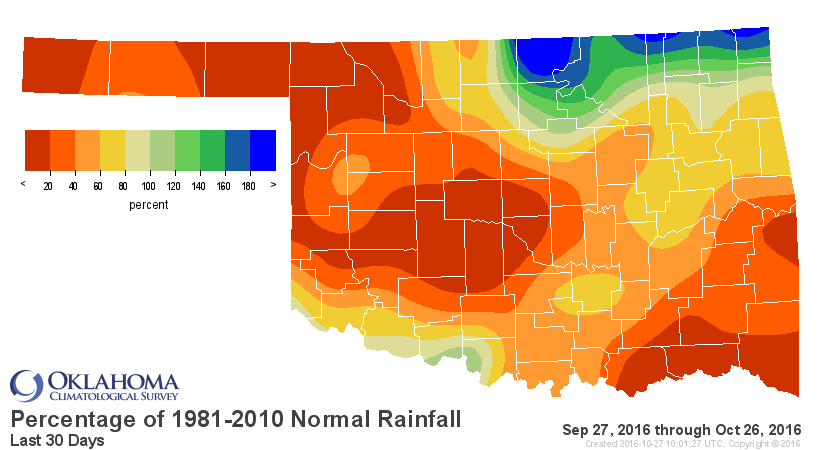
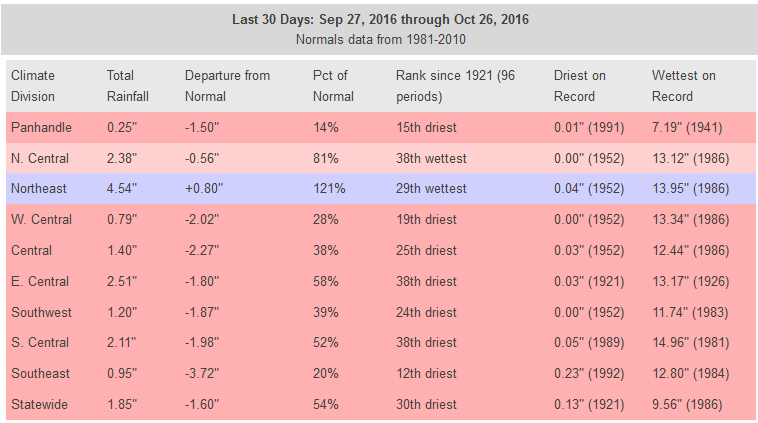
So the 15th driest Sept. 27-Oct. 26 dating back to at least 1921 in the Panhandle,
in addition to those strong, drying winds and heat. And as you can see, the rest
of the state has fared little better. Only a small portion of far N OK has done
well over the last 30 days. And if you go out a bit further, you can see the 60-day
and 90-day rain totals out that way are not too glorious either. And you can also
see the basis for the moderate-severe drought across eastern Oklahoma (as well
as all that "abnormally dry" yellow area).
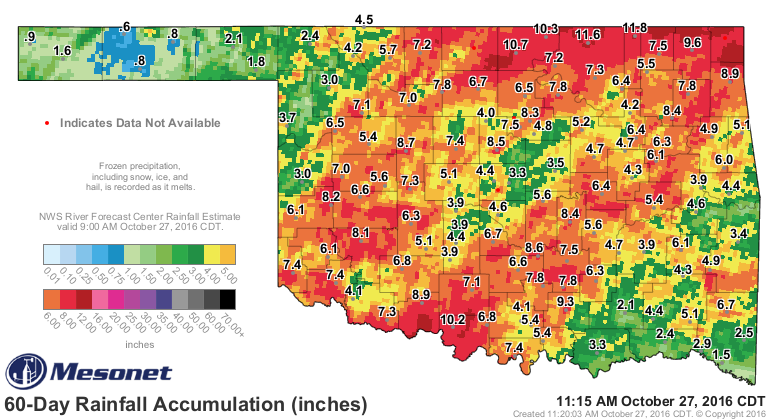
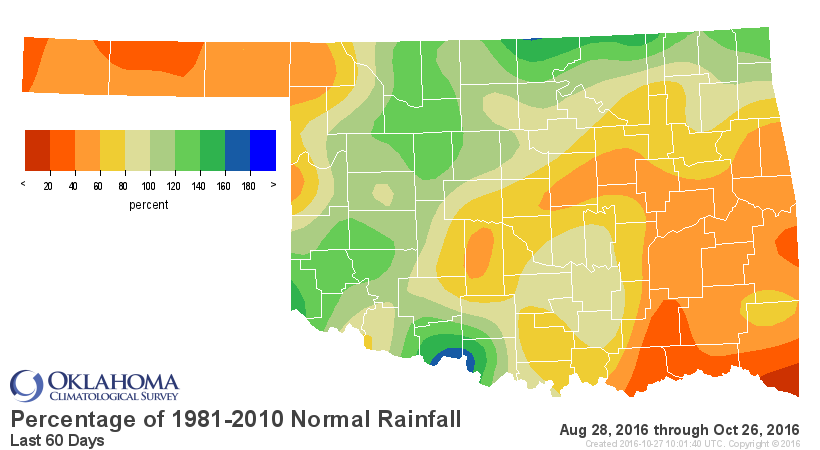

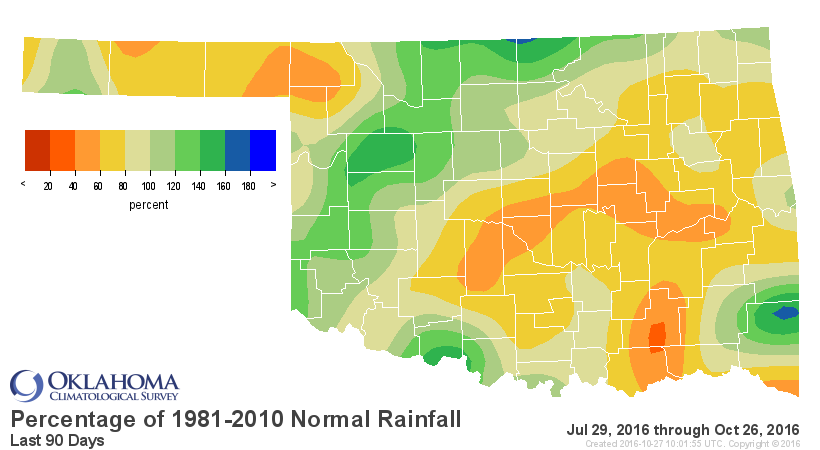
The drying out of NW OK is most evident in the Mesonet soil moisture data as we
look at the daily percent plant available water down through the soil profile
through 32 inches.
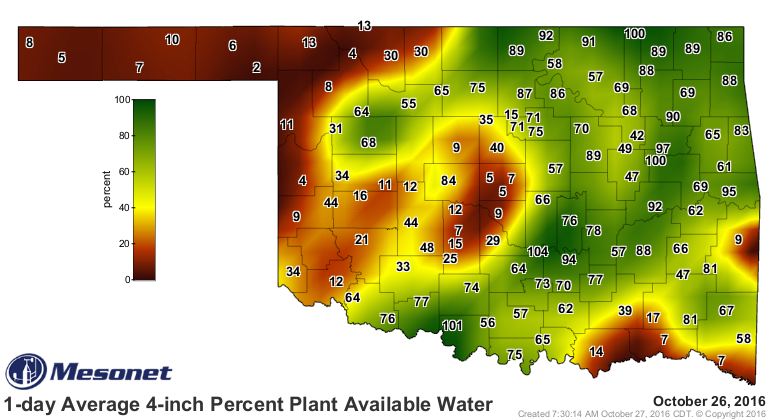
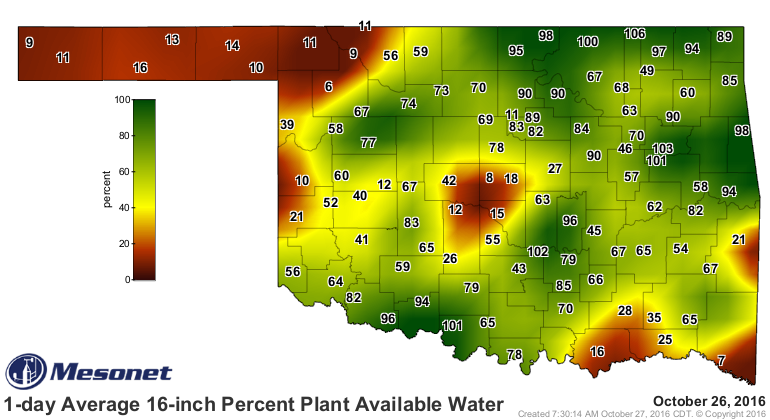
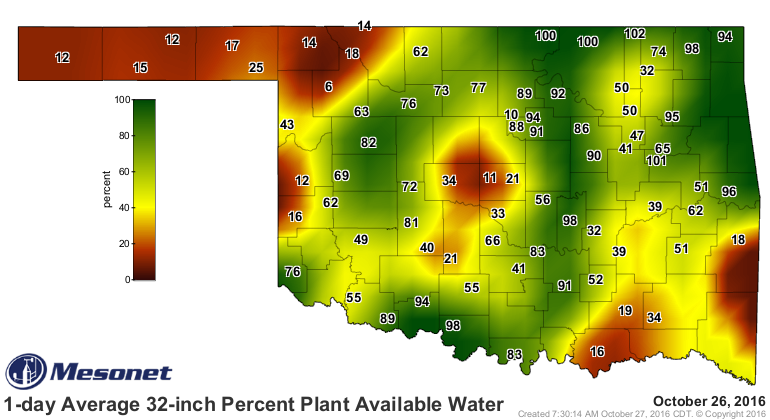
A little bit more about these maps:
"The 1-day Average Percent Plant Available Water map is derived by
dividing the current daily 4-inch Plant Available Water value by
the theoretical maximum 4-inch plant available water amount for
each individual Mesonet site. The percent reported is for the soil
column from the soil surface down to the 4-inch depth. Percents
may go above 100% or below 0% due to variation between individual
sensors and sensor locations. The theoretical maximum plant
available water was calculated from depth specific soil analysis
for each Mesonet site. Plant Available Water values are 24-hour
averages, updated each day after midnight. Most plants experience
water stress when less than 50% of the maximum plant available
water remains in the active root zone."
These and our other soil moisture maps can be found here:
http://www.mesonet.org/index.php/weather/category/soil_moisture
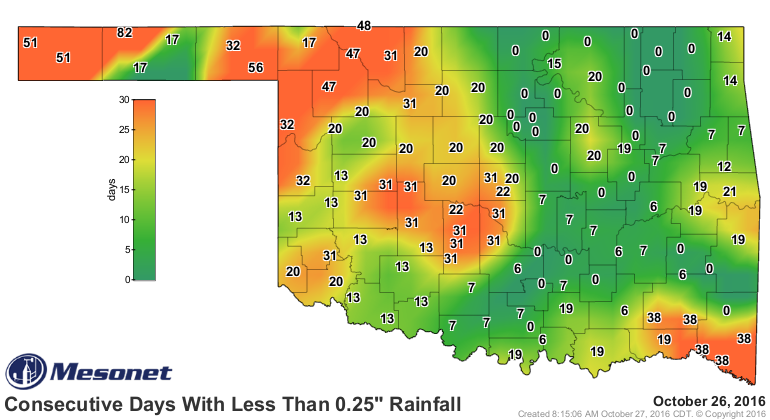
There is still little hope for profound relief, at least through the next 7
days. All that green looks good, but that indicated a quarter-inch or less.

At least that would reset this ugly looking map!
In the meantime, prepare for lots of warm weather and with that vegetation
starting to dry out and go dormant, wildfire danger returns.
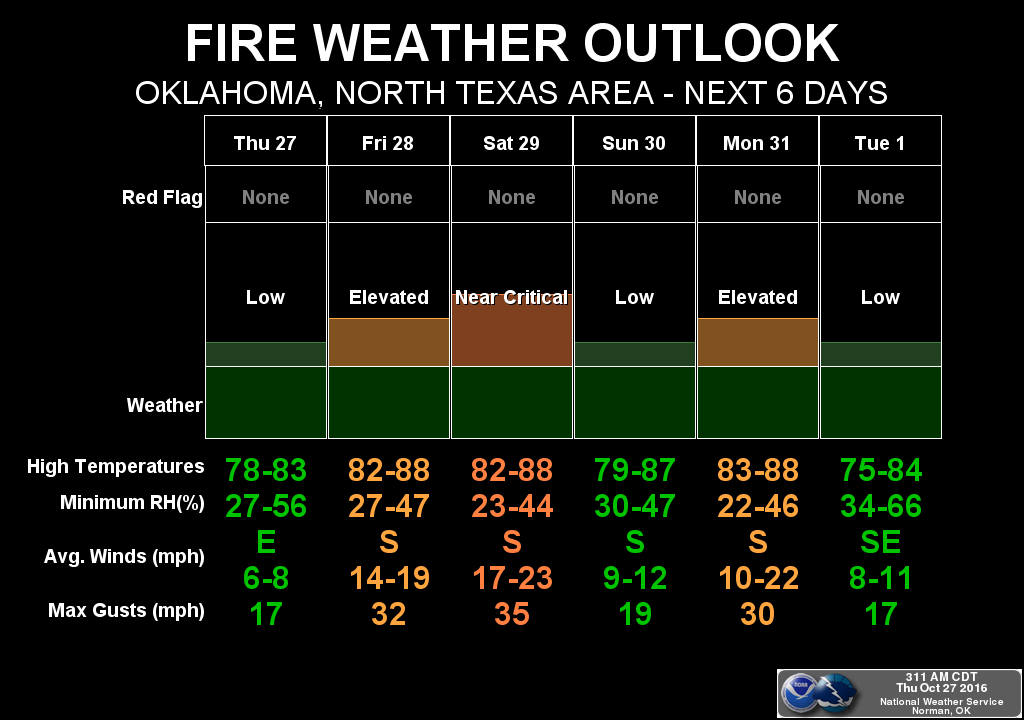
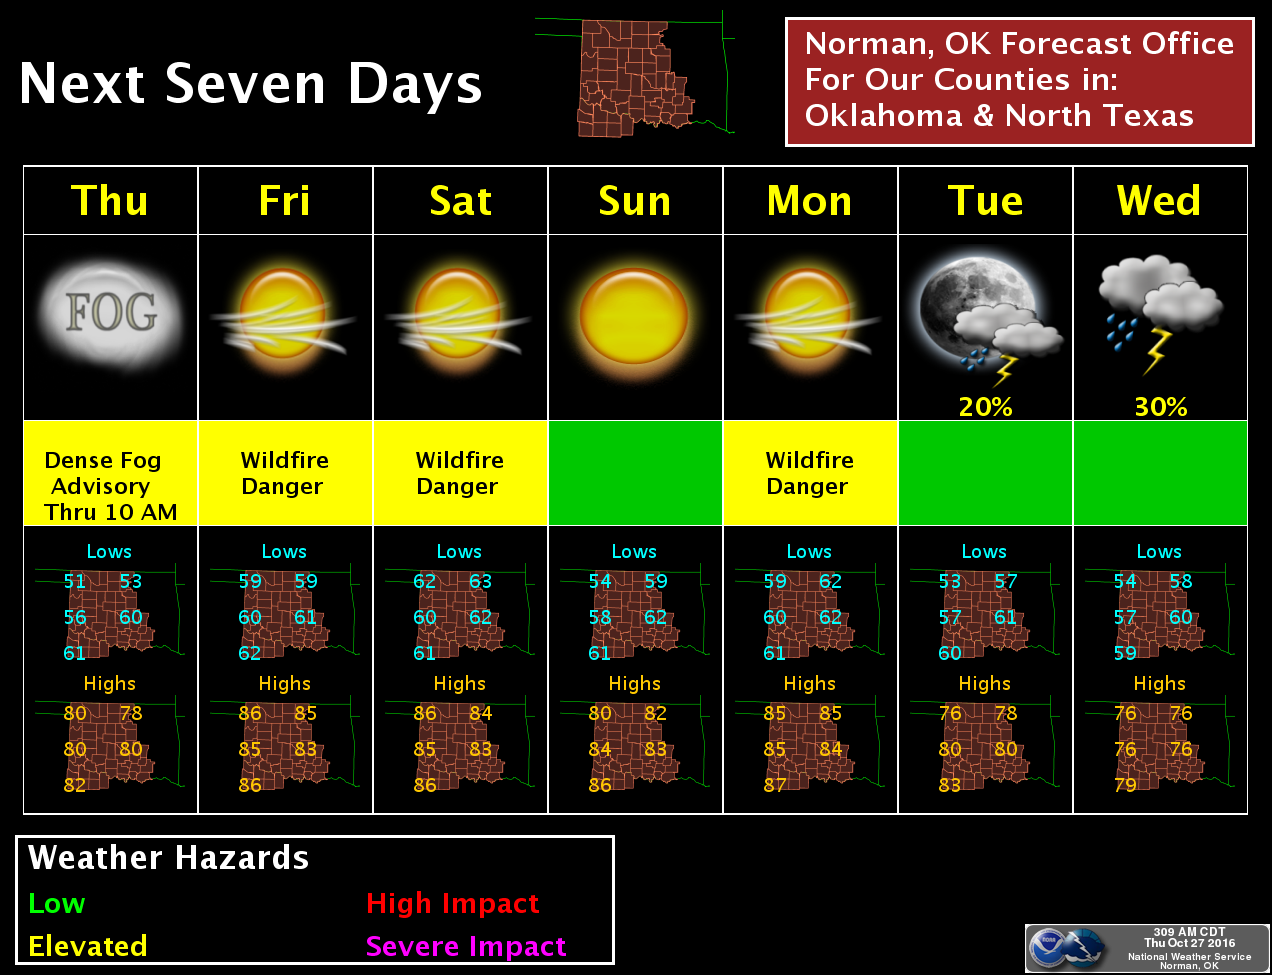
As we noted a couple of days ago, Halloween looks to be blazing. Choose your
costume wisely unless you want to go as BO Man (or woman).
Gary McManus
State Climatologist
Oklahoma Mesonet
Oklahoma Climatological Survey
(405) 325-2253
gmcmanus@mesonet.org
October 27 in Mesonet History
| Record | Value | Station | Year |
|---|---|---|---|
| Maximum Temperature | 91°F | MANG | 2014 |
| Minimum Temperature | 15°F | BOIS | 2020 |
| Maximum Rainfall | 4.03″ | EUFA | 2004 |
Mesonet records begin in 1994.
Search by Date
If you're a bit off, don't worry, because just like horseshoes, “almost” counts on the Ticker website!