Ticker for April 23, 2015
MESONET TICKER ... MESONET TICKER ... MESONET TICKER ... MESONET TICKER ...
April 23, 2015 April 23, 2015 April 23, 2015 April 23, 2015
Drought takes a lickin'
but keeps on Tick(er)in'. See what I did there? Okay, first up, working with the
rains we've had over the last couple of weeks and gauging that against the long-
term nature of the drought, here is your new U.S. Drought Monitor map.
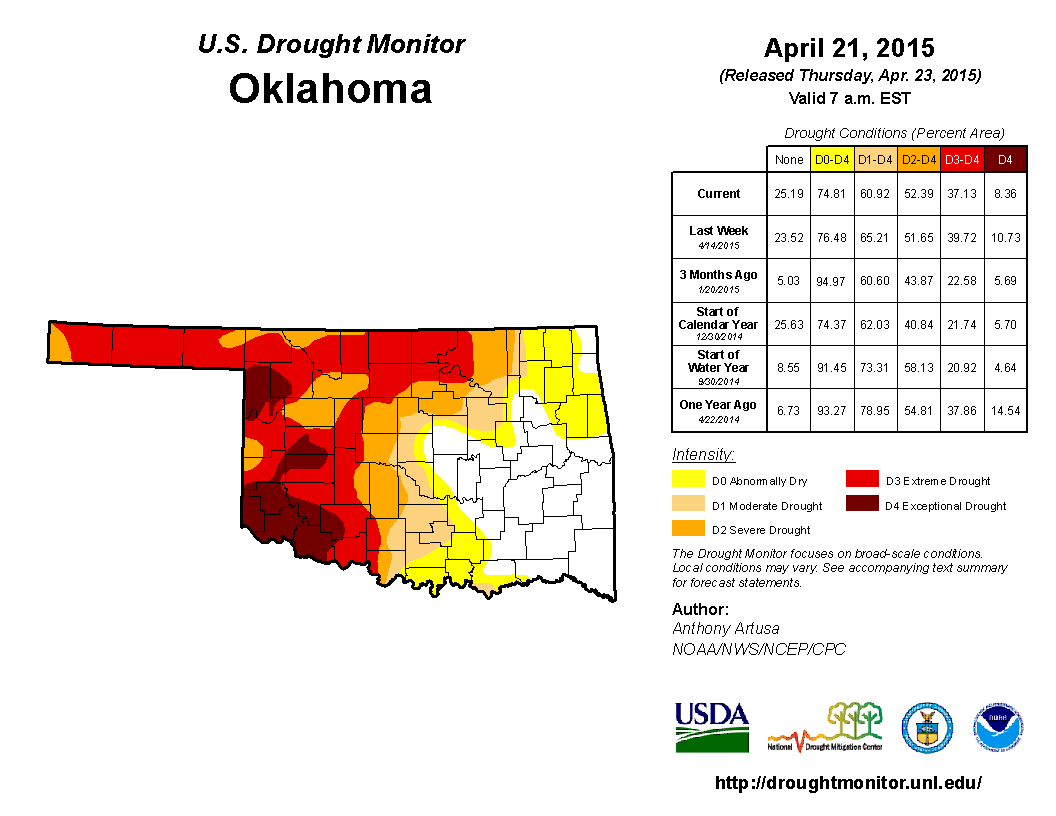
Lots of improvements indeed! We even lost some of that nasty red color (OSU fans
are feeling me right now) across west central and northwestern Oklahoma. The
amount of D3-D4 drought dropped from 39% to 37%, and the amount of drought
itself (D1-D4) dropped from 65% to 61%. I know some folks probably expected more,
but once again, drought relief is a process. Now that we have the soils moistened
up across a good part of Oklahoma, we can really go to work. Here are the soil
moisture maps for Oklahoma showing the improvements in the upper levels.
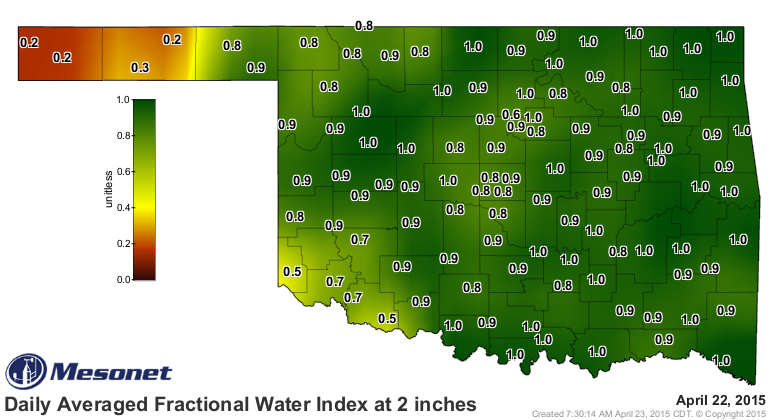
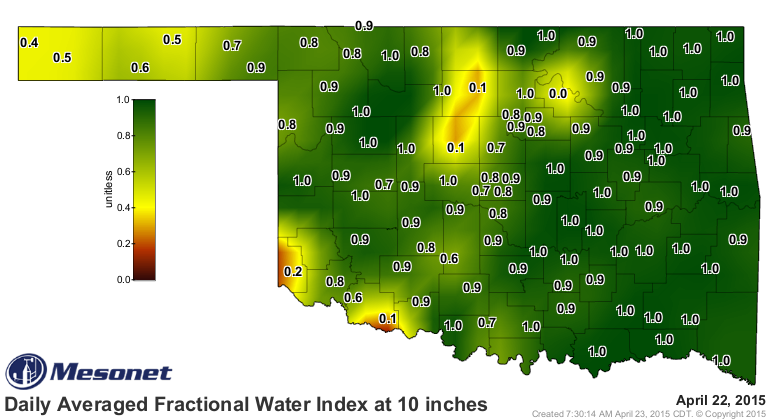
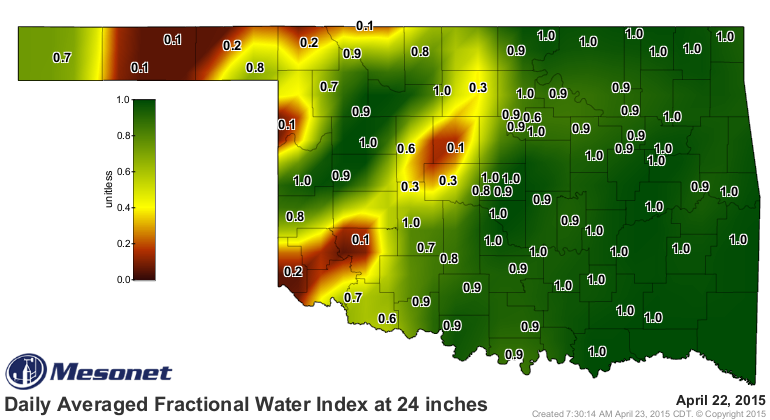
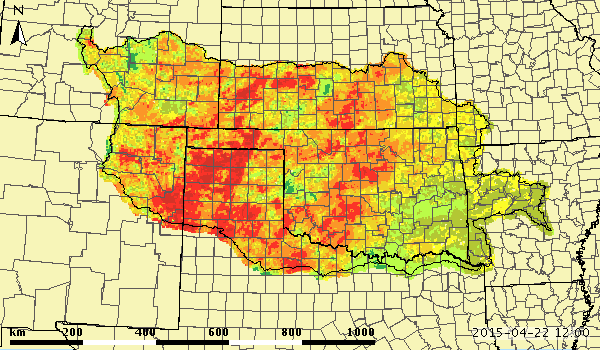
That shows the upper 2 feet. Still some problems with topsoil moisture in the
Panhandle and some other localized areas, and with deeper soil moisture across
the core drought area. This experimental soil moisture product from the Arkansas-
Red Basin River Forecast Center in Tulsa shows the entire column of soil from
the topsoil down to several feet. As you can see, it still shows significant
deficits from SW through C and NC OK, as well as the Panhandle. That's
indicative of the long-term nature of the drought.
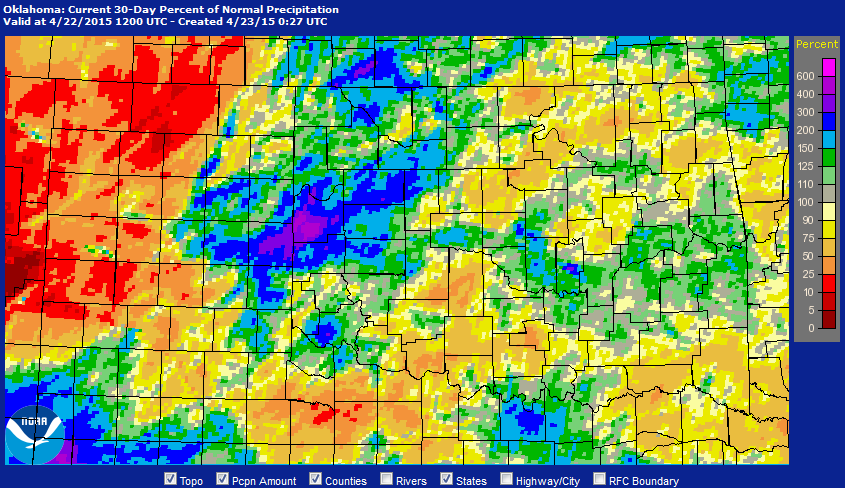
The amount of rain that we have received over the last 30 days is pretty
remarkable, IN SPOTS. Here you can see the 30-day radar-gauge estimated
percent of normal rainfall map and how west central and northwestern Oklahoma
were dominated by above normal rainfall, FINALLY, but other areas of the state
are still in deficit mode...especially across Texas and Cimarron counties in
the Panhandle. In Roger Mills County, they've seen upwards of 600% of normal
rainfall over that period. ZOUNDS!
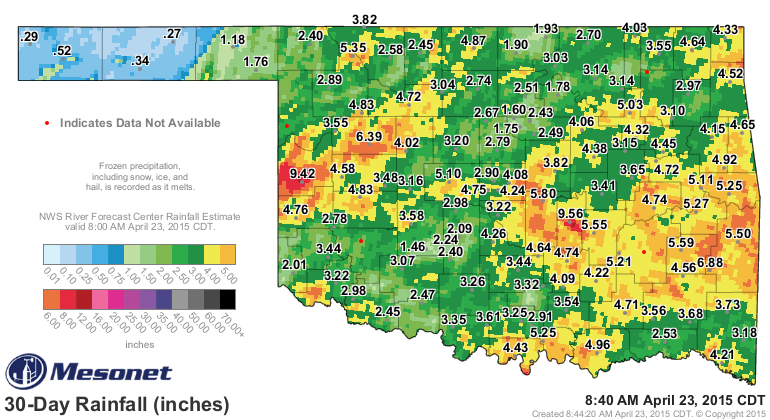
Here are the amounts from the Mesonet with the radar-gauge estimated overlay,
and also the statistics for the last 30 days. Cheyenne and Bowlegs are
battling it out for moisture supremacy at 9.42 inches and 9.56 inches,
respectively.
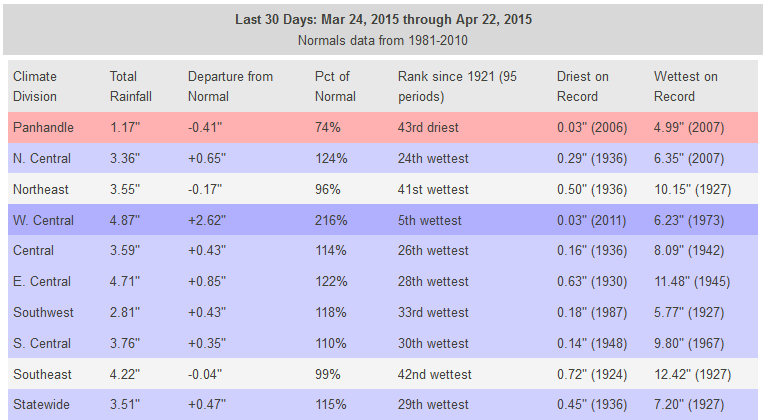
So west central Oklahoma had the 5th wettest March 24-April 22 period on record
since at least 1921 with an average total of 4.87 inches, 2.62 inches above
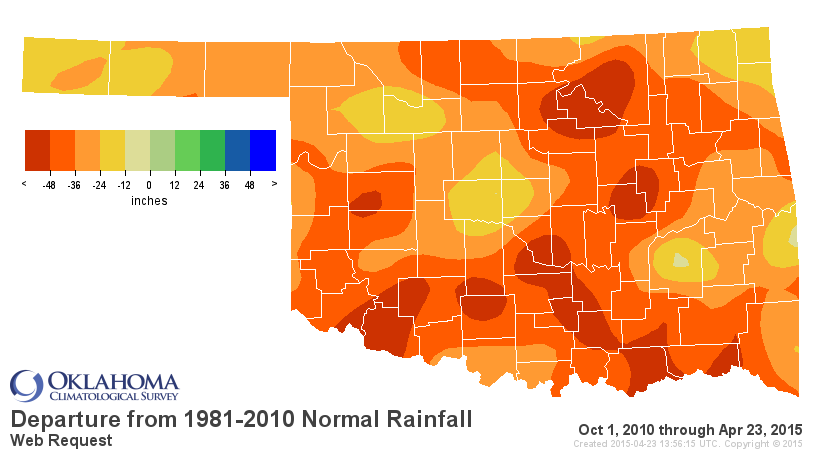
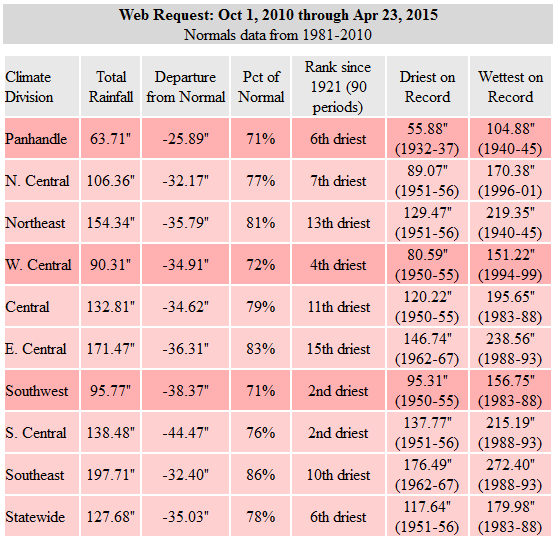
normal. Not too shabby! Unfortunately, a good April can't erase the last 4.5
years in one fell swoop.
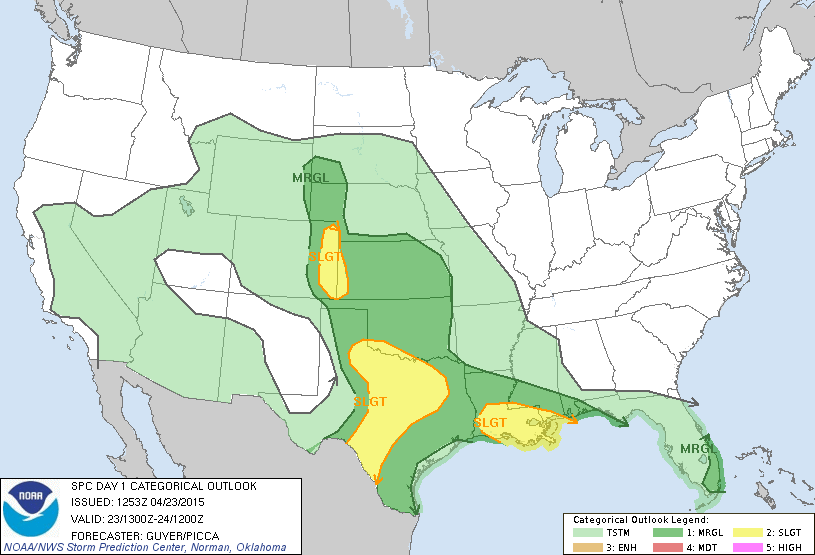
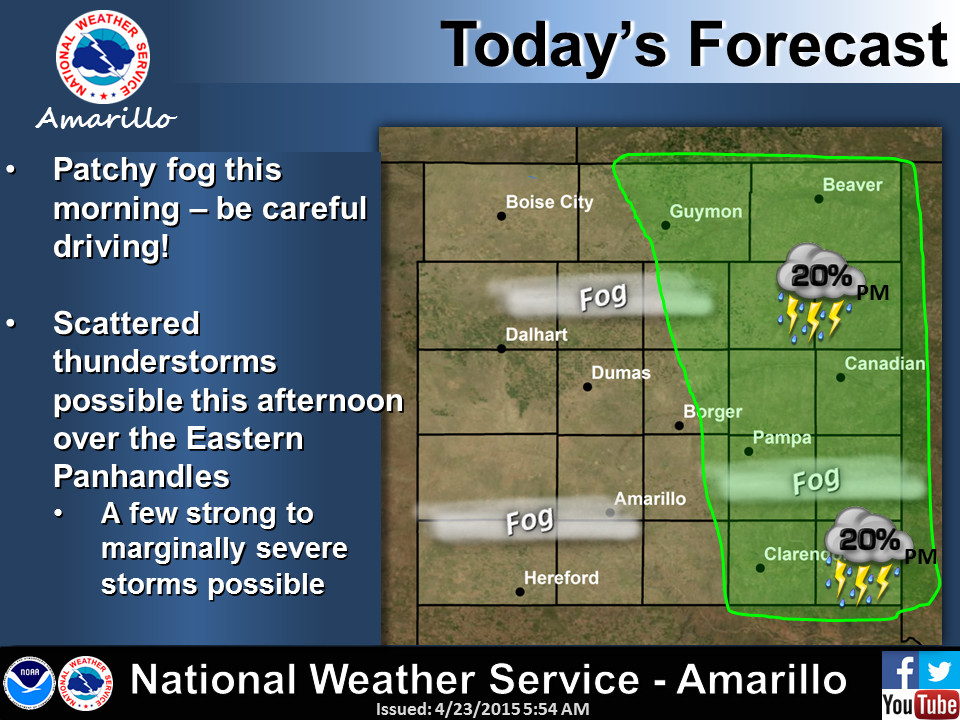
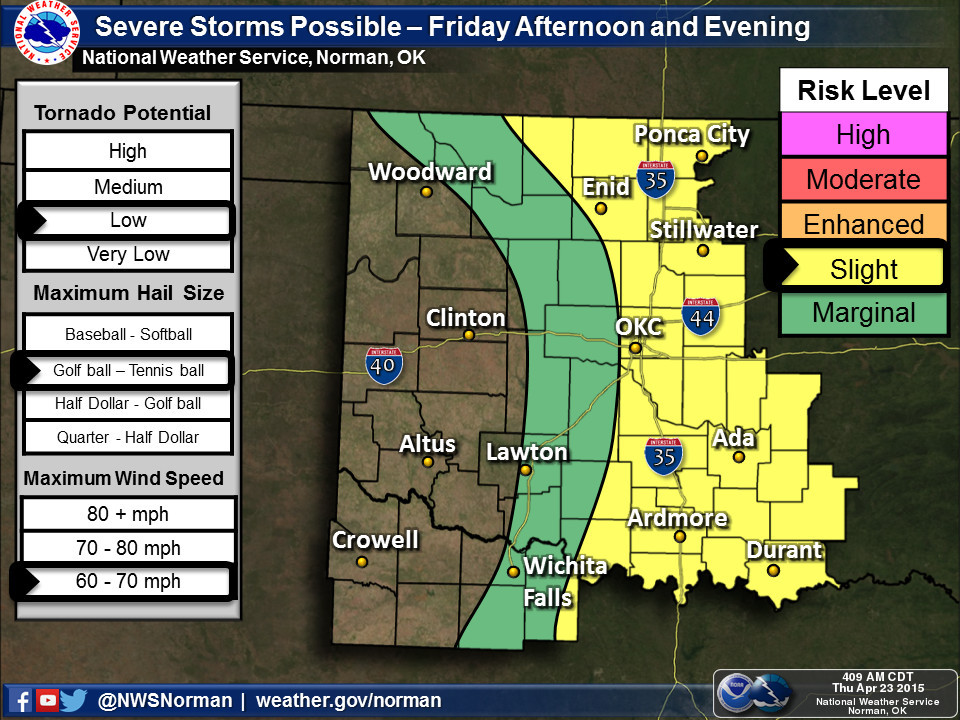
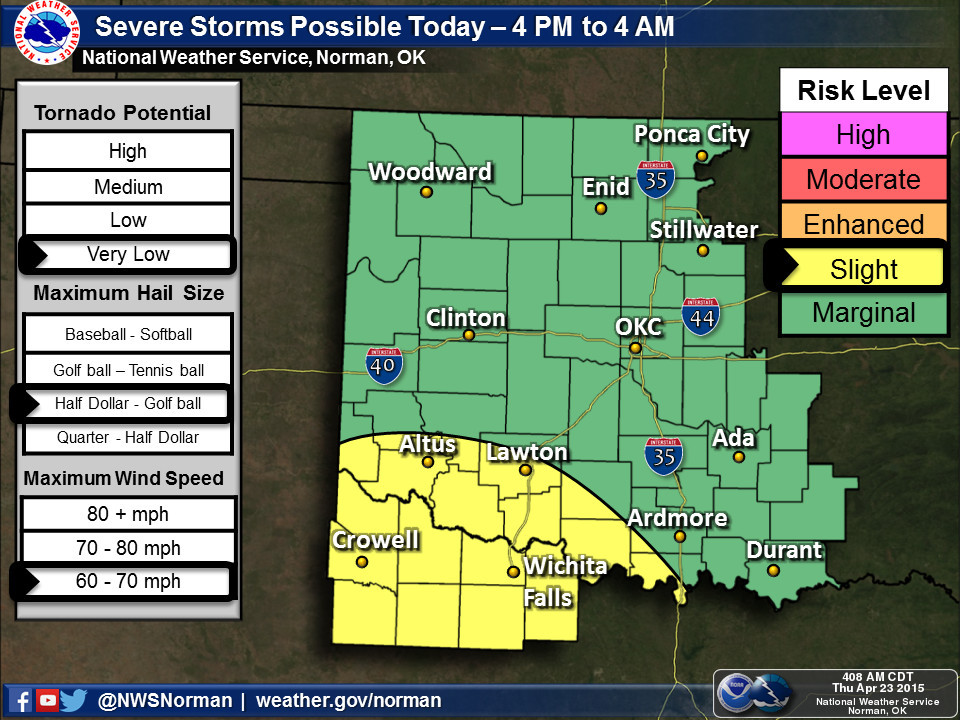
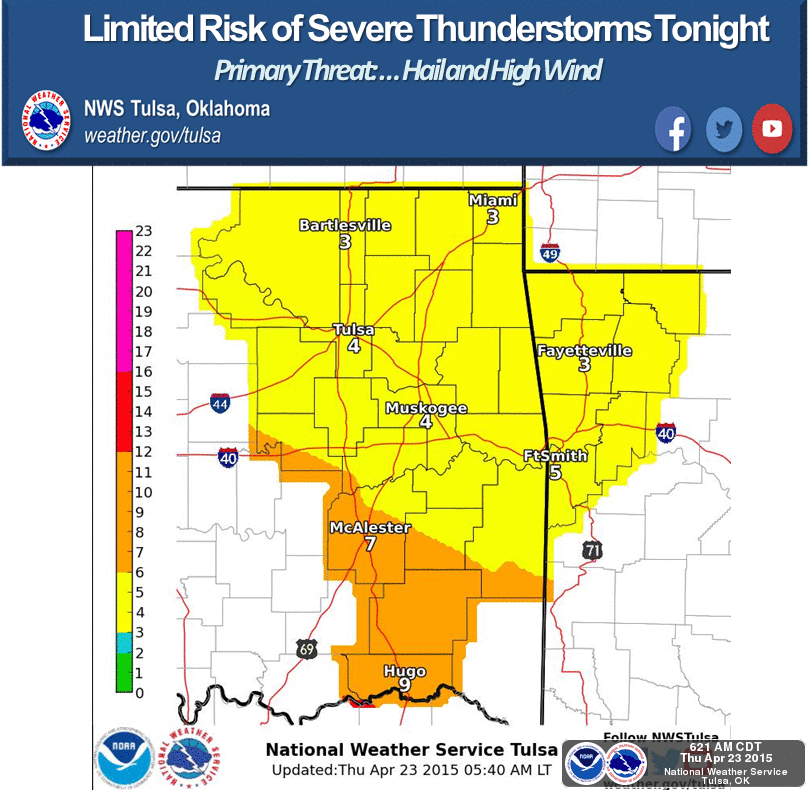
What do we have coming up? Well, another couple of chances for severe weather,
of course. The main area of interest appears to be SW OK today and then it's
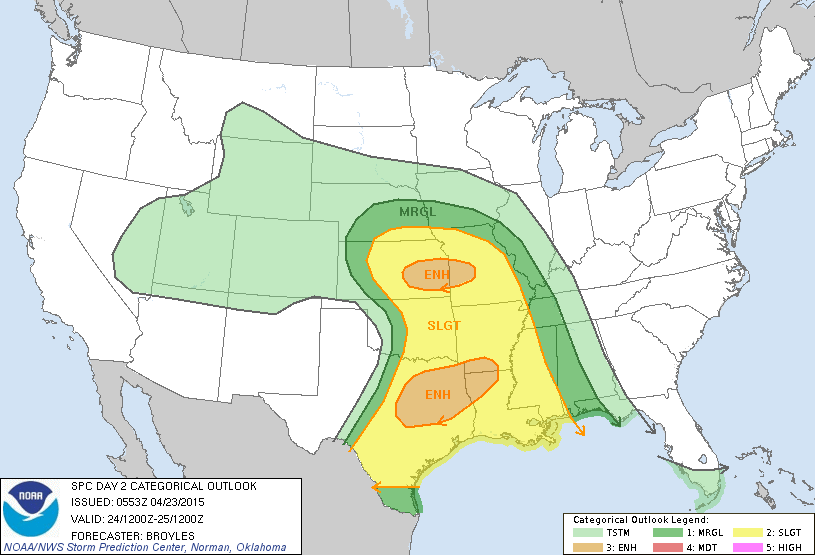
a bit iffy tomorrow. Apparently the forecast gets a bit complicated from there
as all the ingredients come into place. At least as of now, the main show for
tomorrow appears to be to the north and south of Oklahoma. Here are some
graphics from various entities showing us what to expect.
As per usual, the forecast for tomorrow's POSSIBLE severe weather can and will
change right through tomorrow morning into the afternoon, so be sure to keep
up to date with all the latest forecasts from your favorite weather provider.
In other words, stay weather aware.
Gary McManus
State Climatologist
Oklahoma Mesonet
Oklahoma Climatological Survey
(405) 325-2253
gmcmanus@mesonet.org
April 23 in Mesonet History
| Record | Value | Station | Year |
|---|---|---|---|
| Maximum Temperature | 97°F | HOOK | 2006 |
| Minimum Temperature | 17°F | BOIS | 2013 |
| Maximum Rainfall | 3.68″ | HOBA | 2019 |
Mesonet records begin in 1994.
Search by Date
If you're a bit off, don't worry, because just like horseshoes, “almost” counts on the Ticker website!