Ticker for December 12, 2013
MESONET TICKER ... MESONET TICKER ... MESONET TICKER ... MESONET TICKER ...
December 12, 2013 December 12, 2013 December 12, 2013 December 12, 2013
Deja (December 1983) Vu?
Before we get to the December 1983 stuff, remember when when drought was the
big topic?
Ohhhhhh yeahhhhhh. That was back in the fun times when we were talking about the
catastrophic drought across western Oklahoma, instead of the mind-numbing cold
of the past 7 days. Well, drought is still alive and kicking out there, despite
whatever wintry precipitation has fallen. And, to be honest, the lack of moisture
in those key places has sorta crept up on me (and probably you as well). Take a
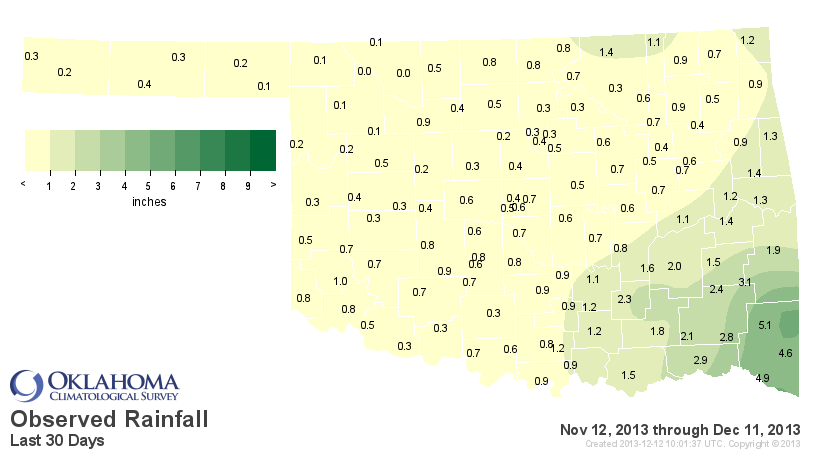
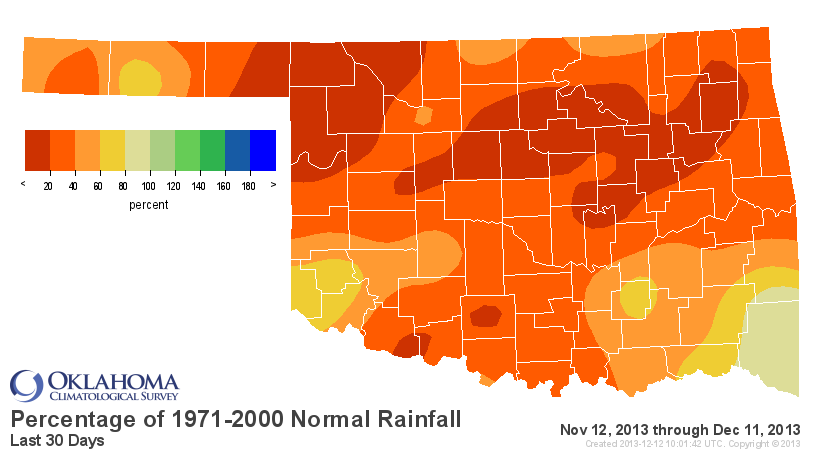
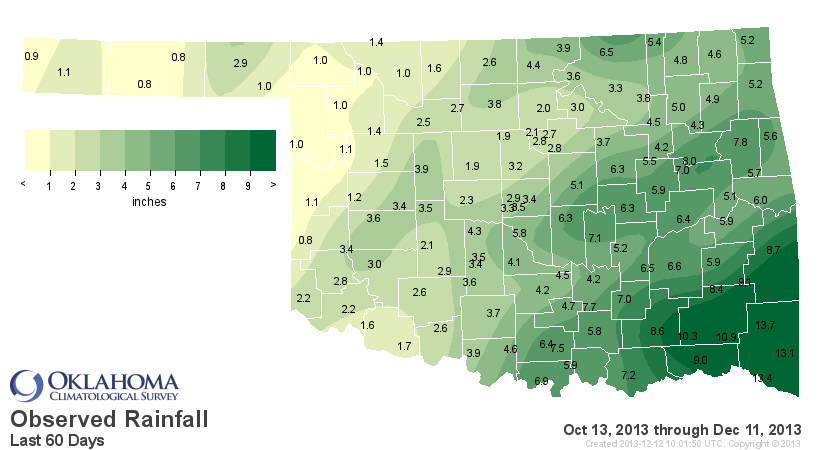
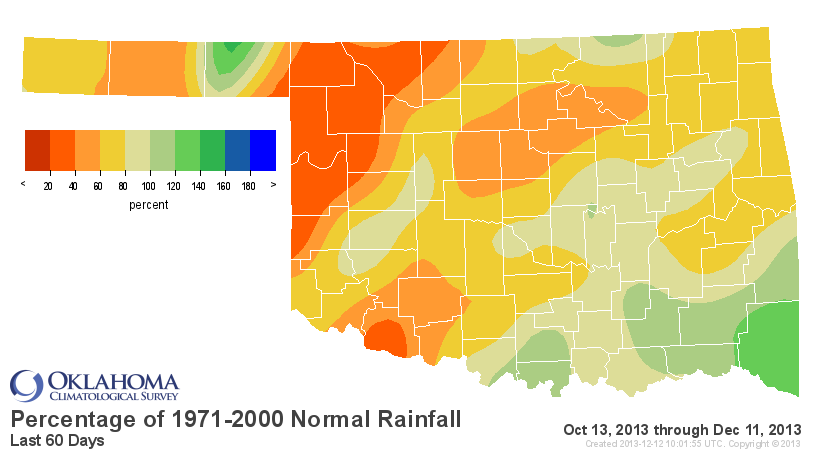
look at the moisture statistics from the Oklahoma Mesonet for the last 30-90 days
and you can see that despite the snow (that then melts to be registered as liquid),
things have gotten downright dry again in places.
Last 30 days (Nov 12-Dec 11)
Last 60 days (Oct 13-Dec 11)
Last 90 days (Sep 13-Dec 11)
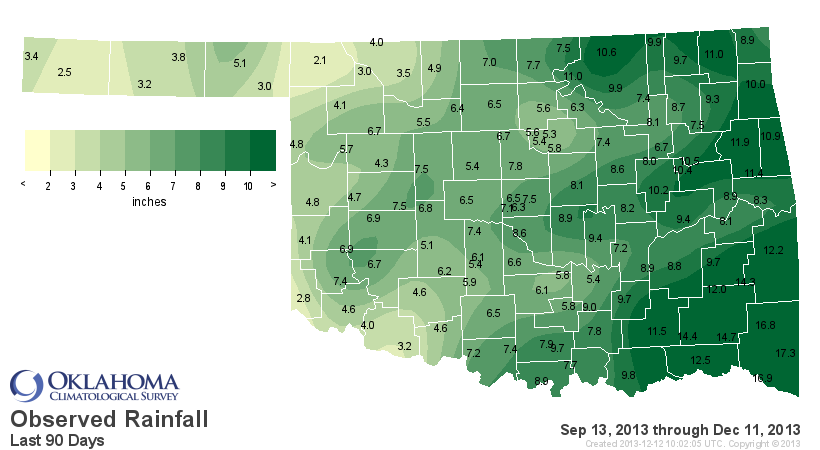
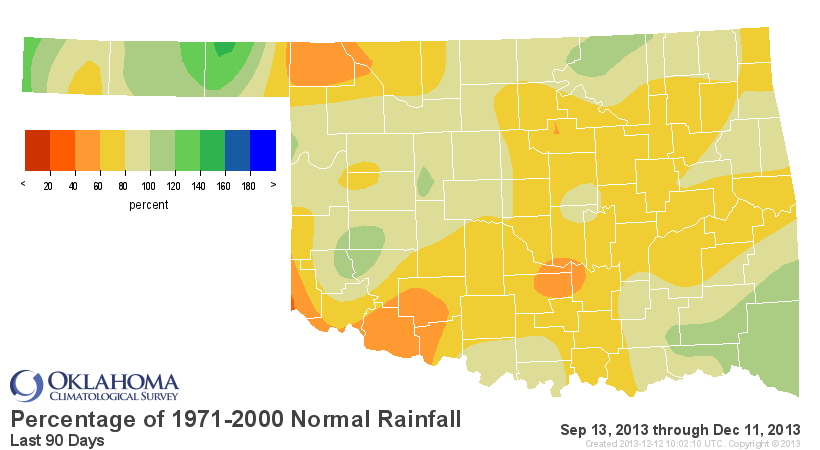
The statistics from all three periods bear out just how dry it has been. Now it
hasn't been Dust Bowl dry, but keep in mind this is on top of more than three
years worth of drought damage (or inter-mingled with it, since the drought traces
its beginnings back to Oct 2010). These are the statewide statistics.
-***-
Period Statewide Avg Pct Normal Dep. from Normal Rank since 1921
30-day 0.88" 35% -1.63 25th Driest
60-day 4.25" 76% -1.36 42nd Driest
90-day 7.39" 80% -1.81 43rd Driest
-****-
So we've definitely been dry in the shorter-term than the long-term, but that
also depends on where you are. Check out the statistics for the same periods
except this time, let's concentrate on the hardest hit area of the state down
there in SW OK.
-***-
Period SW OK Average Pct Normal Dep. from Normal Rank since 1921
30-day 0.67" 42% -0.92 37th Driest
60-day 2.47" 61% -1.58 33rd Driest
90-day 5.10" 71% -2.13 34th Driest
-****-
Normally we don't worry about such deficits as we go through the cool season,
but again, this is on top of three years of drought. We can't make SW OK look
much worse than it already does, being mostly D3-D4 on the Drought Monitor map,
but northwestern Oklahoma has room to grow, so to speak. And that is the main
thrust of this week's Drought Monitor, where we saw northwestern Oklahoma's
D1-Abnormally Dry areas intensify to full-fledged drought (D1-Moderate Drought).
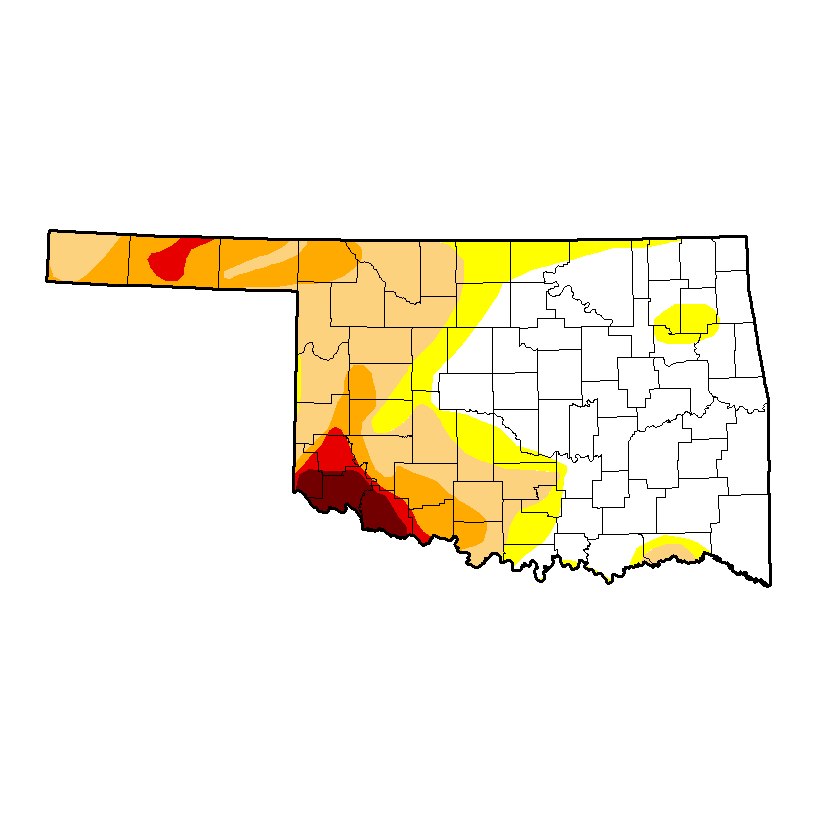
That brings the area with D1-D4 drought to 38.32%, up from 30.9% last week. It's
still an improvement from 3 months ago when 50.45% of the state was in drought,
and definitely a ton better than last year at this time when we saw 100% of the
state in D2-D4 drought. Heck, 95% of the state was in D3-D4 drought back then.
Relief over the next 7 days looks pretty sparse, if not downright depressing for
western Oklahoma (remember, this moisture could come in the frozen variety ...
we're talking liquid equivalents here).
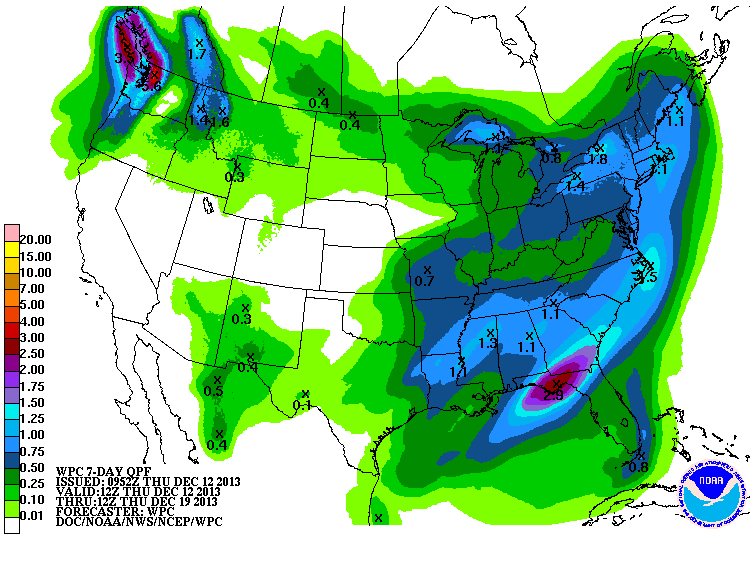
There is a lot of talk about a storm or two about 10 days out (more about that
in a minute), so we'll have to wait awhile for more substantial relief, if any.
-------------------------------------------------------------------------------
Deja (December 1983) Vu??
Lots of folks are comparing this December to that ridiculously cold one of 1983,
but I still see it as more of a December 1989 or 2000 thus far. Let's check out
the statistics for the first 11 days of the month and see how they stack up,
shall we?
-***-
Avg. Max Avg. Min Mean Avg.
Dec. 1-11 41.0F 21.3F 31.2F
Normal 52.4F 29.1F 40.8F
Departure -11.4F -7.8F -9.6F
-****-
Now a statewide average of 31.2 degrees for the first 11 days of December is
pretty impressively cold, especially when the first part of the month is normally
the warmest. But a look at our chart for statewide average December temperatures
again (1895-2012) shows just how darned cold 1983 was, and why it's nearly still
untouchable.
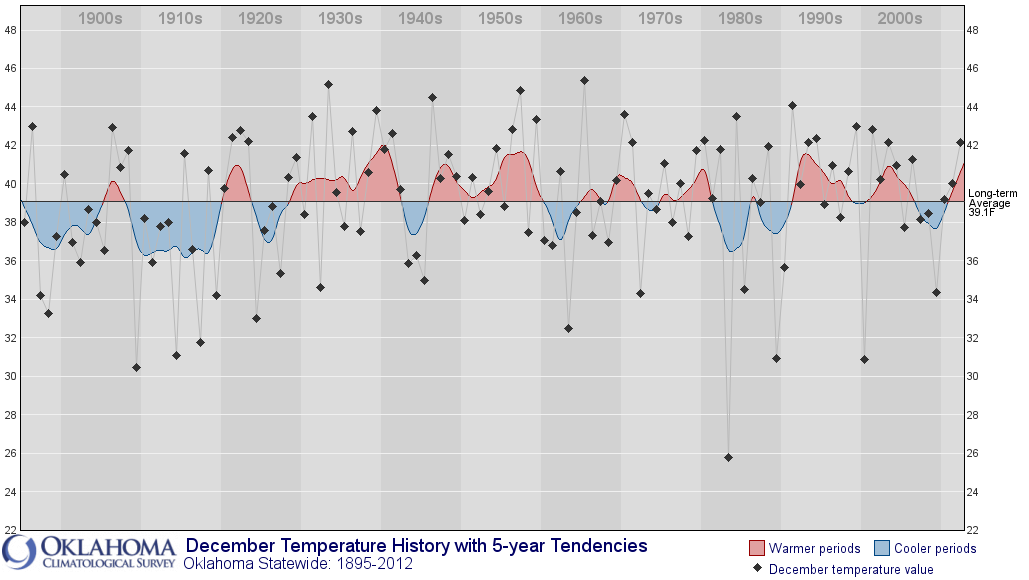
So if December ended today, that would be horrible! I MISSED CHRISTMAS! But our
statewide average temperature of 31.2 degrees would still be 5.4 degrees warmer
than 1983's 25.8 degrees. However, it would compare favorably to December 1989
and 2000. These are the statewide averages for the entire month for the three,
versus December 1-11 of this year.
December 1983: 25.8F (1st Coldest on record)
December 1989: 30.9F (3rd Coldest)
December 2000: 30.9F (tied, 3rd coldest)
Dec. 1-11, 2013: 31.2F (???)
Here's the kicker ... we have a long way to go for this month. We do have a week
of really nice weather coming up next week, so that will bring the averages up,
but apparently we also have another arctic blast coming for next weekend that
could possibly stay awhile. Will next weeks warmth, which could see highs in
the 60s, wash out the following week's chill?
NOW you're seeing what makes climatology so exciting, right? Okay, maybe not.
But I don't think you're going to see the depths of cold air we saw in December
1983. We've just had a really REALLY cold 7 days, right? Well, if you look at
the statewide average temperatures of all the 7-day periods in state history,
the 7-day period ending on December 11, 2013, was the 141st coldest week on
record at 21.9 degrees. The coldest top 5 weeks on record? Yep, you guessed it
... all from 1983. In fact, 8 of the top 10 coldest 7-day periods (lots of
overlap, obviously) on record came during that December 1983 (coldest was Dec.
17-25, 1983, at 6.8 degrees).
I've lived through December 1983. December 1983 was (not) a friend of mine. You,
December 2013, are no December 1983.
So by saying that all of that, I've just guaranteed that Oklahoma will break
it's all-time record for the coldest December. Happy???
Gary McManus
Associate State Climatologist
Oklahoma Climatological Survey
(405) 325-2253
gmcmanus@mesonet.org
December 12 in Mesonet History
| Record | Value | Station | Year |
|---|---|---|---|
| Maximum Temperature | 77°F | KENT | 2021 |
| Minimum Temperature | 2°F | BEAV | 2000 |
| Maximum Rainfall | 2.84″ | MTHE | 2015 |
Mesonet records begin in 1994.
Search by Date
If you're a bit off, don't worry, because just like horseshoes, “almost” counts on the Ticker website!