Ticker for March 11, 2013
MESONET TICKER ... MESONET TICKER ... MESONET TICKER ... MESONET TICKER ...
March 11, 2013 March 11, 2013 March 11, 2013 March 11, 2013
Weekend Wrap-up
You had your Friday, which was nice. That led to Saturday, culminating with
Sunday. There's your weekend in a nutshell. Oh wait, there was rain too, and
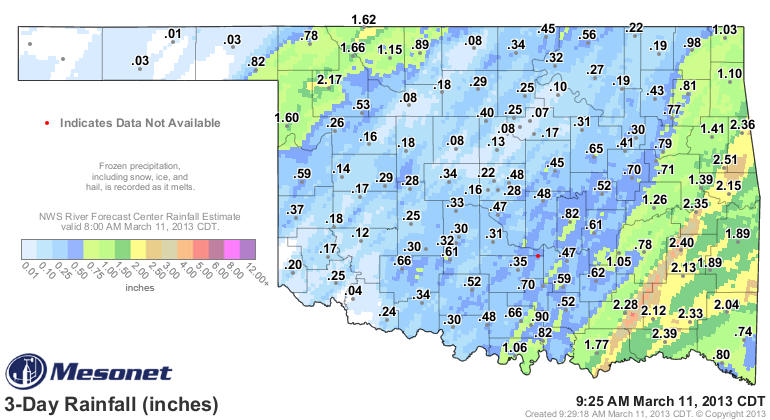
some folks got a bunch. You can see on this here Mesonet map that a small strip
of land across the far northwest got from an inch to more than 2 inches, then very
little in the main body of the state, then the eastern one-third got another
1-3 inches.
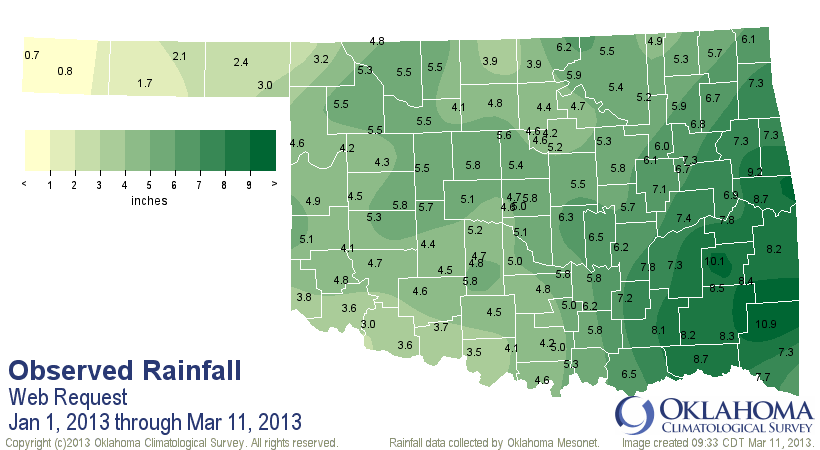
The weekend's rain added to totals since the first of the year that have led to
significant drought relief for much of the state, especially northwestern
Oklahoma. The Mesonet rainfall maps since Jan. 1 tell the story.
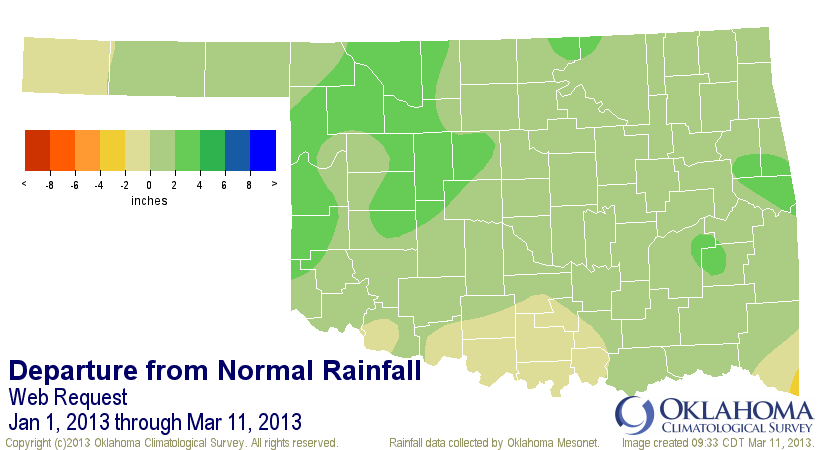
For that two-plus month period, northwestern Oklahoma is from 2-4 inches above
normal, while the rest of the state sees itself from near normal to about 2 inches
above. Cimarron County in the far western Panhandle still remains below normal,
as does southern Oklahoma.
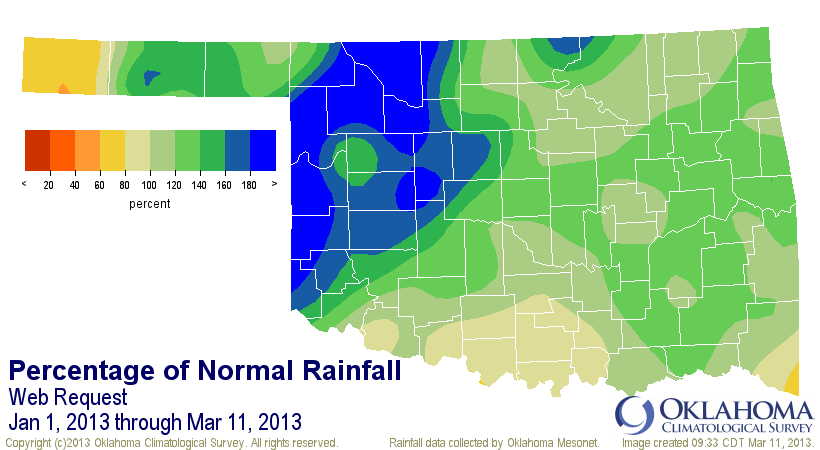
While it's a bit weighted towards the northwest, all that rain still amounts
to the 14th wettest Jan. 1-March 11 since 1921. Here are the climate division
rainfall statistics for Jan. 1-March 11 from the Oklahoma Mesonet.
-***-
Climate Div. Avg. Total Dep. Pct. Rank since 1921
OK-1: Panhandle 2.30" +0.59" 135% 18th wettest
OK-2: N. Central 4.99" +1.82" 158% 8th wettest
OK-3: Northeast 5.91" +0.80" 116% 18th wettest
OK-4: W. Central 4.86" +1.98" 169% 6th wettest
OK-5: Central 5.27" +0.95" 122% 17th wettest
OK-6: E. Central 7.37" +1.22" 120% 19th wettest
OK-7: Southwest 4.22" +0.93" 128% 19th wettest
OK-8: S. Central 5.40" +0.16" 103% 32nd wettest
OK-9: Southeast 8.64" +1.12" 115% 27th wettest
Oklahoma Statewide 5.37" +1.03" 124% 14th wettest
-****-
That rain has led to a marked improvement in Oklahoma lake levels, giving parts
of the state a pretty decent cushion as we enter spring.
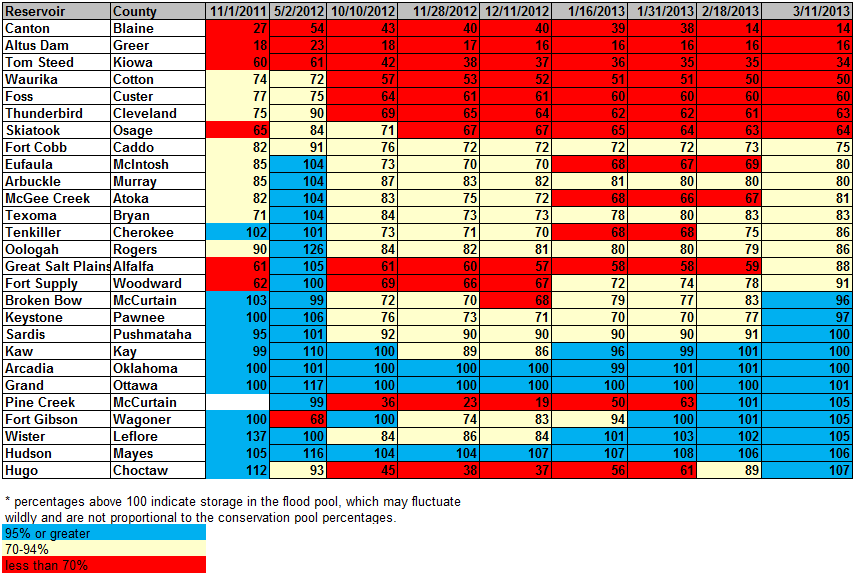
We are now in the best shape level-wise since last spring right around this
time, and then through April with a bit more rainfall. However, western Oklahoma
is still in very poor shape, but also including Lake Thunderbird in central
Oklahoma. Canton Lake and Lake Altus-Lugert still lag way behind at 14% and
16%, respectively. However, most lakes are now at least out of the "red" at more
than 70% capacity.
This seems very reminiscent of last year, but there are differences. First, it
has definitely not been as warm as last year (nor as cold, which is important).
Last year's statewide average temperature from Jan. 1-March 10 was 44.5 degrees,
4.1 degrees above normal. This year over that same span, the statewide average
has been 41.2 degrees.
-***-
Statewide average temperatures, Jan. 1-March 10
Max T Min T Avg T
Normal 52.7 28.1 40.4
2012 56.8 32.2 44.5
2013 53.2 29.2 41.2
2012-2013: 3.6 3.0 3.3
-****-
We were also on our way to our warmest March, warmest spring, AND warmest year
on record. I don't see that trajectory occurring again this year. Our vegetation
was in overdrive in March as well. It had been such a wet and warm winter and
early spring that the plant life thought we were already well into April.
Check out the differences between the relative greenness maps from the Oklahoma
Mesonet's Fire Danger model from this year and last year. Basically, relative
greenness for each spot on the map, or each pixel, is compared to historical
data for that pixel, from 1989-2004.
2012 relative greenness
2013 relative greenness
Notice how much greener it is out across Oklahoma's wheat belt? Last year's
crop benefited from a much early start to the moisture with rains starting
in October 2011. This year's crop faced the driest May-December on record, by
contrast. Additionally, last year's crop was well ahead in its growing season
thanks to the warmth. The rest of the state doesn't look green, nor should it.
That green-up occurs later in the spring. Then the wheat crop will start to
mature and turn it's lovely golden color and the rest of the state will look
green by comparison (check out this relative greenness map from last May, for
instance).
What's this mean? Heck, I forgot. No, wait! The point was we haven't seen quite
the water stress on our available storage like last year at this time. We
haven't been as warm, so we haven't had as much evaporation. Winds has been
about the same. The lack of exuberant plant growth also means less being taken
from the soils. So at least in those respects, we are a bit better off than
last year.
Make no mistake, however ... what happens over the next three months will be
crucial for this drought. The warm season is upon us. Plants will be taking
off with moisture back in the soils once again. Evaporation will be increasing as
it gets warmer. We have a decent cushion as we go through spring compared to
what it was looking like a couple of months ago. We can't go back to the rain-
every-three-weeks schedule, however. We need that weekly shot to keep up with
demand. And we still have a lot of sub-soil moisture reserves to fill across
western Oklahoma.
We were in for several more weeks of rain last year at this time before Mother
Nature shut the spigot off. We don't need a repeat.
Gary McManus
Associate State Climatologist
Oklahoma Climatological Survey
(405) 325-2253
gmcmanus@mesonet.org
March 11 in Mesonet History
| Record | Value | Station | Year |
|---|---|---|---|
| Maximum Temperature | 90°F | MANG | 2023 |
| Minimum Temperature | 9°F | SLAP | 1998 |
| Maximum Rainfall | 2.62 inches | IDAB | 2012 |
Mesonet records begin in 1994.
Search by Date
If you're a bit off, don't worry, because just like horseshoes, “almost” counts on the Ticker website!