Ticker for February 21, 2013
MESONET TICKER ... MESONET TICKER ... MESONET TICKER ... MESONET TICKER ...
February 21, 2013 February 21, 2013 February 21, 2013 February 21, 2013
Another Anti-Climactic Drought Monitor Map
Pack a lunch. This one's a doozy!
Kids across the northern half of the state are awakening to the news of no school
thanks to another round of snow, sleet and freezing rain. This is probably the
largest round of weather-related school closings since February 2011, so enjoy
it whilst you can, kids! More importantly, the storm system giving some a break
from reading, 'riting and 'rithmetic is also giving much of the state a nice
drought-denting round of moisture.
As we look at these Mesonet rainfall maps, remember that the network's rain gauges
are non-heated, so when frozen precip collects in them, it won't be registered
until temps start to rise above freezing. But, we can also check out the radar-
estimated overlay from the River Forecast Center in Tulsa. This latest round
has given the state a good quarter-to-half inch or so according to the latest
totals map (remember, moisture is still falling down as the storm moves to the
east).
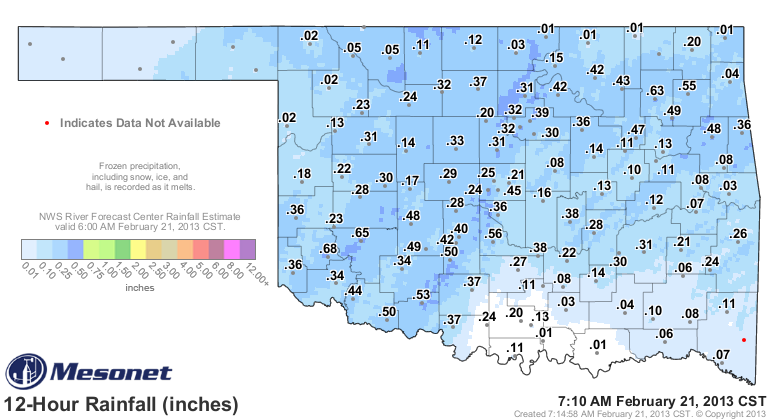
You can see those little pockets of enhanced precip in the larger general area
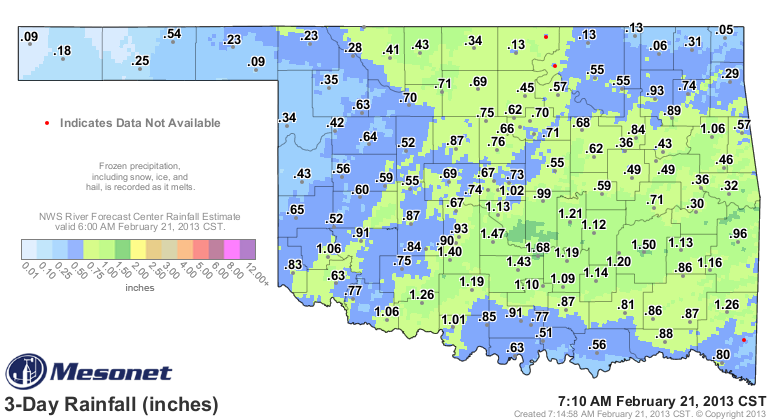
where those smaller bursts of thunder-sleet and such fell. Add these amounts
to the previous round yesterday and you have a lovely area of green and blue
across the state, signifying a half-inch to nearly 2 inches in some areas.
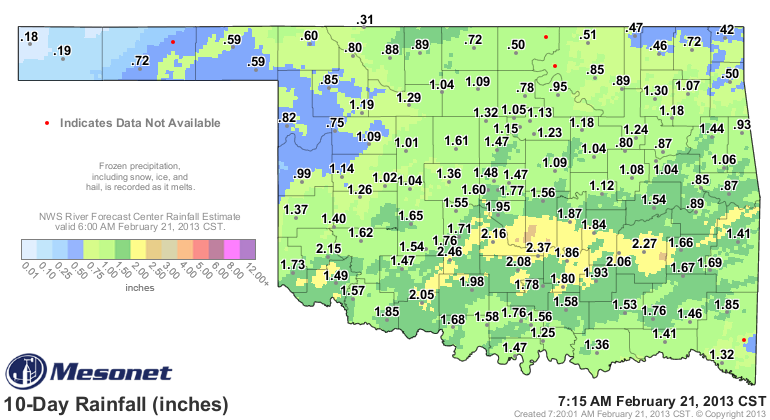
Add THAT to last week's storm and you have an even nicer map with widespread
areas of an inch to more than 2 inches.
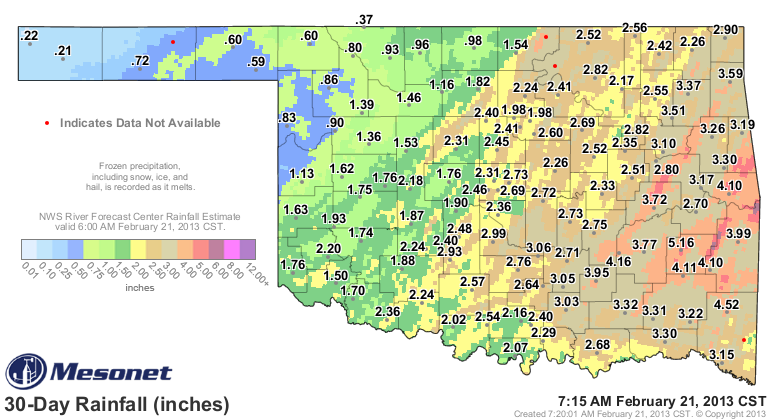
Not good enough? Picky! Here's the last 30 days then, showing a large area of
the southeastern two-thirds of the state with 1.5-4 inches of liquid precip.
The statewide average for February thus far, even without the frozen stuff
awaiting some 33-degree weather, is up to 1.58". While that's only 0.24" above
normal for Feb. 1-21, it's good for the 26th wettest such period since 1921.
The normal for all of February is about 1.8", so we could exceed that and
ensure two straight wetter-than-normal months in a row! January finished about
a tenth of an inch above normal. We haven't seen that kind of action since
March and April 2012.
--------------------------------------------------------------------------------
Drought Monitor Map Already Out of Date
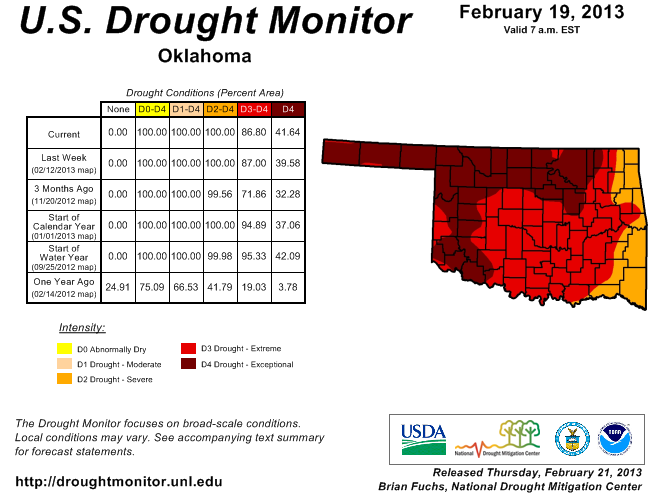
The release of this morning's U.S. Drought Monitor map is highly anti-climactic
(and as usual anti-climatic), given that this current moisture missed the 6 a.m.
Tuesday cutoff point. Most of it, at least. So this current storm will be
reflected on next week's map.
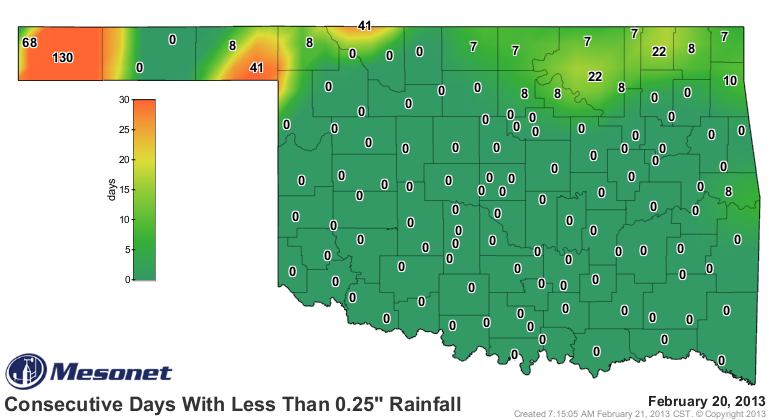
This morning's map shows a slight up-tick in Exceptional (D4) drought due to
an increase in the far western Panhandle, where it's been more than 130 days
since Boise City has seen at least a quarter-inch of rain in a single day.
Drought Monitor
Consecutive Days With Less than 0.25 inches
No need to dwell on the DM map, since it will be changing next week after we
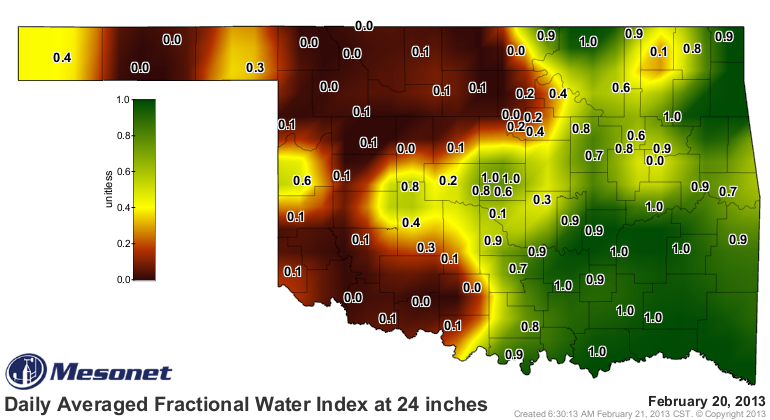
take a look at the impacts. Two of the most important things to check out will
be any improvements in the soil moisture at the lower levels and lake levels.
Right now, that Mesonet map from 2 feet down is still fairly dry across western
Oklahoma.
The lake levels will have to wait as we see how much runoff made it into those.
-------------------------------------------------------------------------------
A look ahead
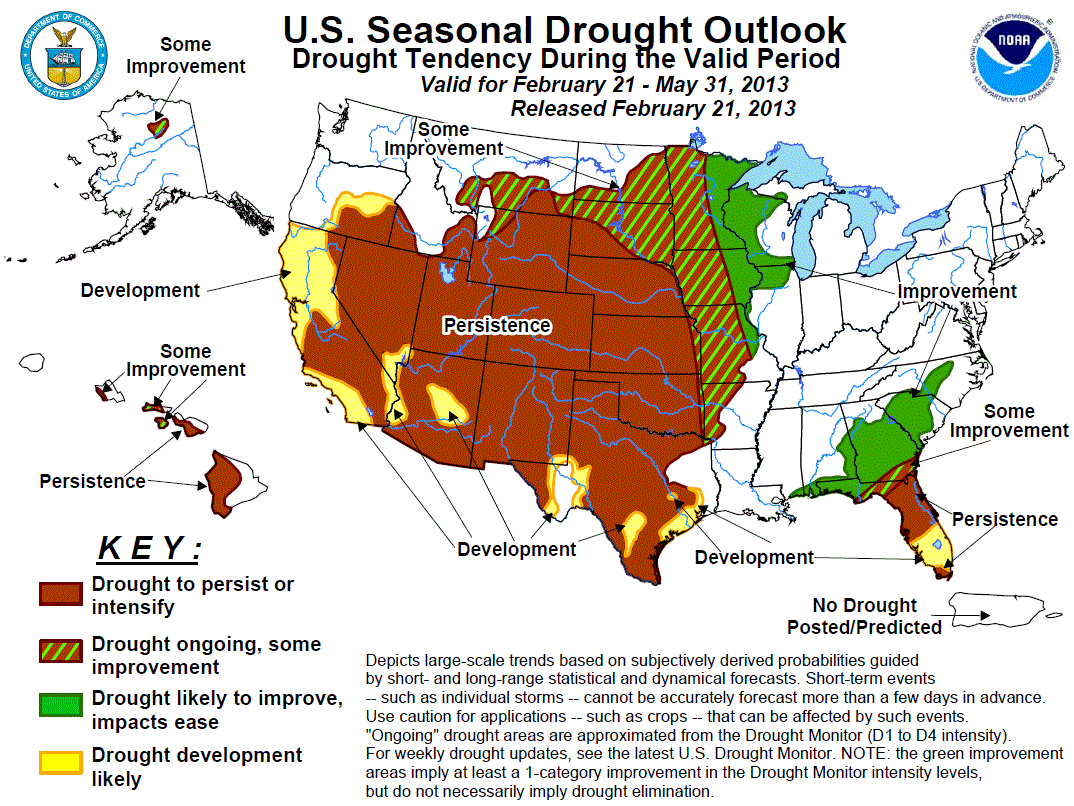
I wish we had some different outlook maps to see, but the new U.S. Seasonal
Drought Outlook map released this morning from the CPC looks much the same as
it did the last several releases ... most of Oklahoma remains in that "drought
to persist or intensify" through the next three months (March-May). There is
a tiny sliver of eastern Oklahoma in the "some improvement" area, so bully for
them.
Their reasoning?
"After this system exits, another could bring moderate precipitation
to the southern Plains ... during the first week of March. Otherwise,
drier than normal weather is expected to prevail across the central
and western states during late February and early March. In addition,
the March and March - May 2013 precipitation outlooks favor below-median
precipitation roughly from the western half of the central and southern
Plains. With dry weather favored for most locations and time periods,
and considering the large precipitation deficits accumulated over the
last 6 to 24 months, drought persistence (and in some areas expansion)
was the only reasonable forecast. Even in the eastern Plains, which
lies outside the area with enhanced chances for dryness during March -
May, the endurance and/or severity of observed moisture shortages make
it unlikely that conditions will improve by late May. Thus the
persistence forecast reaches eastward through all of Oklahoma, Kansas,
Nebraska, southwestern South Dakota, and most of Wyoming."
They did leave us with the old "wild card" ploy:
"The one significant wild card is May - a wet month with sizeable
precipitation normal as mentioned above. Moisture deficits could
rise or fall quickly once the month gets underway if May precipitation
trends significantly above or below normal."
Translation: It will be tough to overcome the deficits we've seen since May
2012 and all the way back to October 2010 if the March-May outlooks (shown
below) come true. But if May is a monster month, we could see big improvements
then. Sound good?
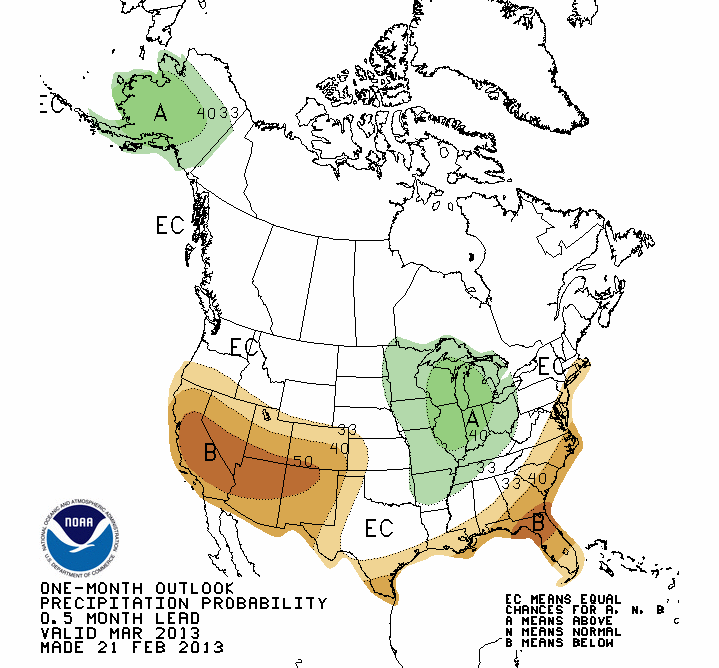
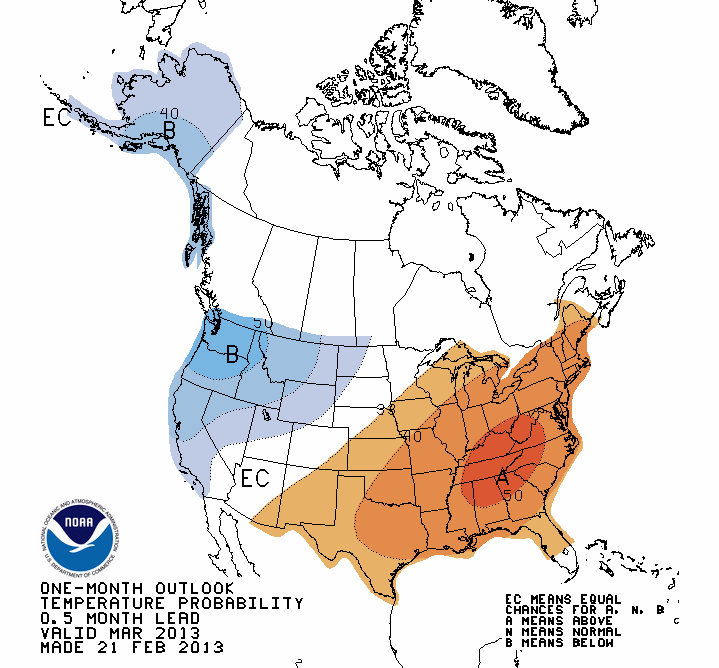
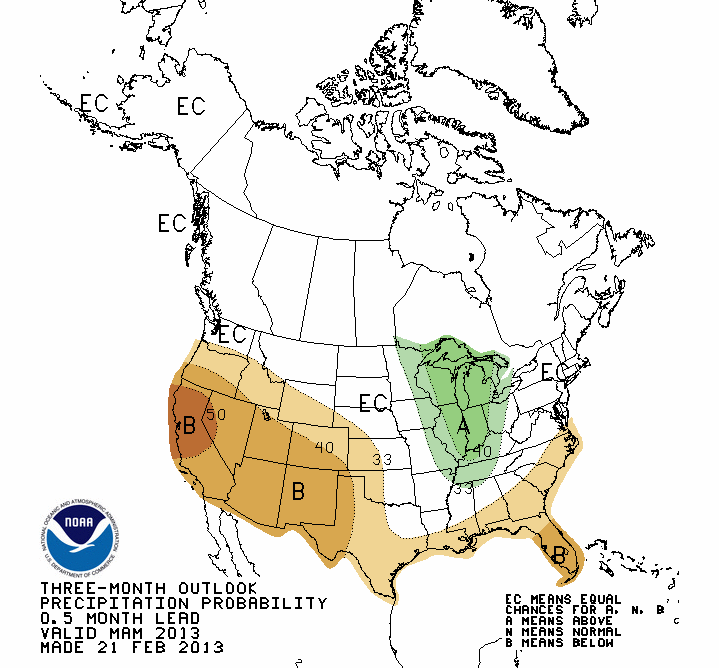
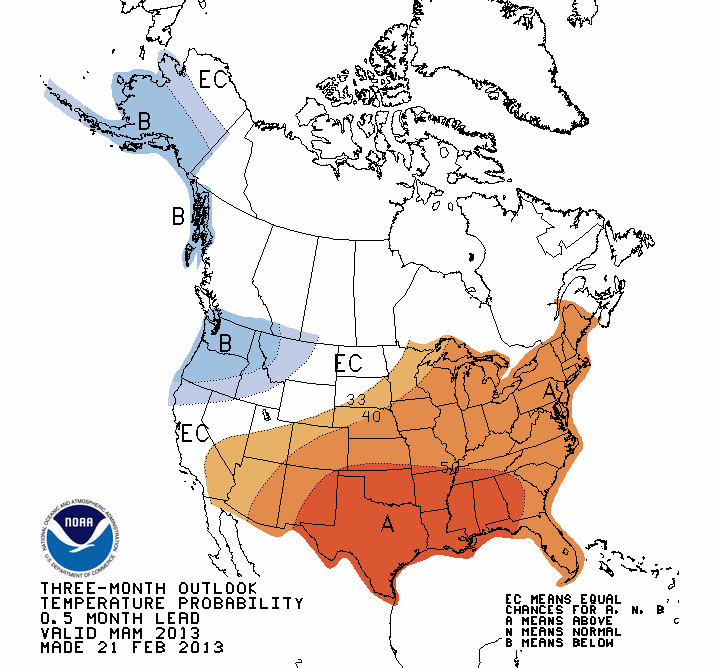
Here are those March and March-May rainfall and temperature outlooks from CPC.
They both show increased odds of below normal precip across western OK, and
above normal temps across all of OK.
*REMEMBER*, these maps show probabilities (or odds), not amounts.
March Outlooks
March-May Outlooks
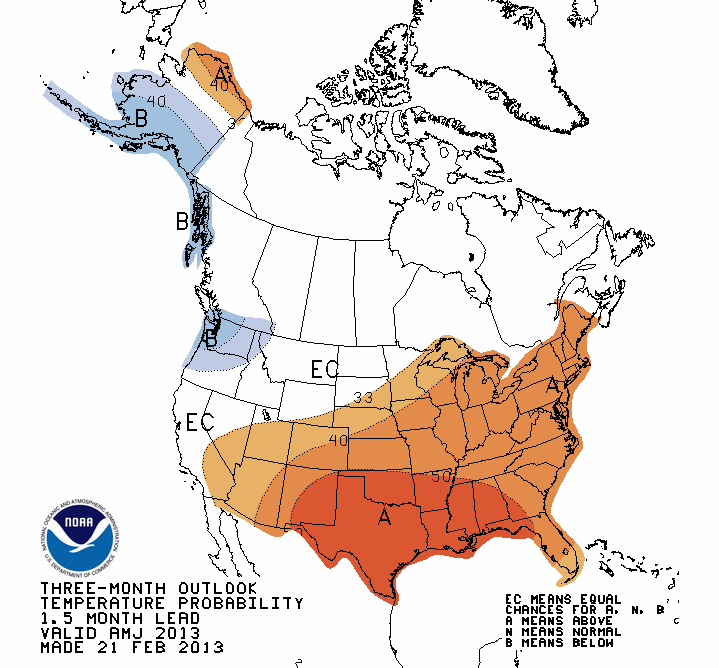
The April-June outlooks look a bit worse, and that's important since those
encompass the bulk of our primary rainy season of May through mid-June.
April-June Outlooks
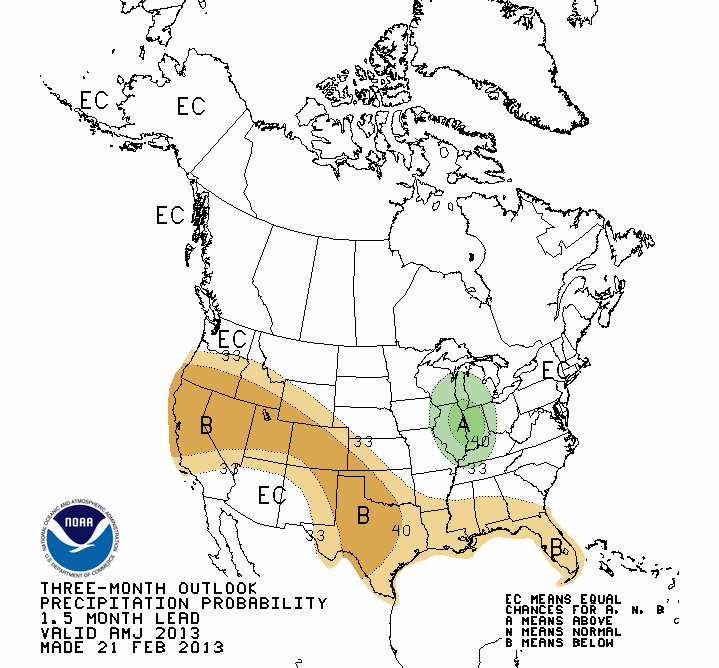
Now don't be fooled by the white "EC" areas on any of these precip oulook maps.
THAT IS NOT AN INDICATION OF NORMAL!! That means there are equal odds for
above-, below- or near-normal rainfall. IT DOES NOT MEAN THERE ARE INCREASED
ODDS FOR NEAR-NORMAL PRECIP!! Everybody got that? Not sure I do, so we can all
be confused together. Basically it means if'n you had a dollar to bet on the
outcome, you'd bet $0.33 cents on each category. Take that left-over penny and
buy yourself something nice.
If the temperatures are indeed above normal as we go through the first few
months of the warm season as indicated by the outlooks, that would not be good
news for drought. Increased temperatures mean more evaporation and drought
enhancement, all other things being equal.
Here's my final plea: we're getting into the time of year when these outlooks
really get a bit dicey and lose some skill. Therefore, these are not a sure
thing, especially when we start to get into the convective environments of
spring. Hard to say where those storms will develop and train repeatedly.
We cannot give you definitive answers on what will happen, unfortunately. But
this is the best the science of seasonal forecasting has to offer.
*I* am not the best the science has to offer, but I hope I have translated it
appropriately for ya.
Gary McManus
Associate State Climatologist
Oklahoma Climatological Survey
(405) 325-2253
gmcmanus@mesonet.org
February 21 in Mesonet History
| Record | Value | Station | Year |
|---|---|---|---|
| Maximum Temperature | 87°F | BURN | 2023 |
| Minimum Temperature | 2°F | HOOK | 2013 |
| Maximum Rainfall | 2.90″ | BROK | 2018 |
Mesonet records begin in 1994.
Search by Date
If you're a bit off, don't worry, because just like horseshoes, “almost” counts on the Ticker website!