Ticker for January 7, 2013
MESONET TICKER ... MESONET TICKER ... MESONET TICKER ... MESONET TICKER ...
January 7, 2013    January 7, 2013    January 7, 2013    January 7, 2013


The Backache Index

A couple of years ago, I had a tumor removed from my spinal cord. In the process,
I also had  part of my spine removed (confirming what was long suspected ... I am
indeed spineless!). So just like the stories you've always heard, when the
weather gets colder, my back goes to aching. That's partially the reason I'm such
a warm weather nut. The other reason is it gives me a chance to show off my legs
(the horror!). So the last couple of weeks have been a bit higher on the
"Backache Index." Now the backache index should not be confused with any of the
drought indices, since drought is a pain in the back in general.

The point is it looks like it's about to get really cold across much of the
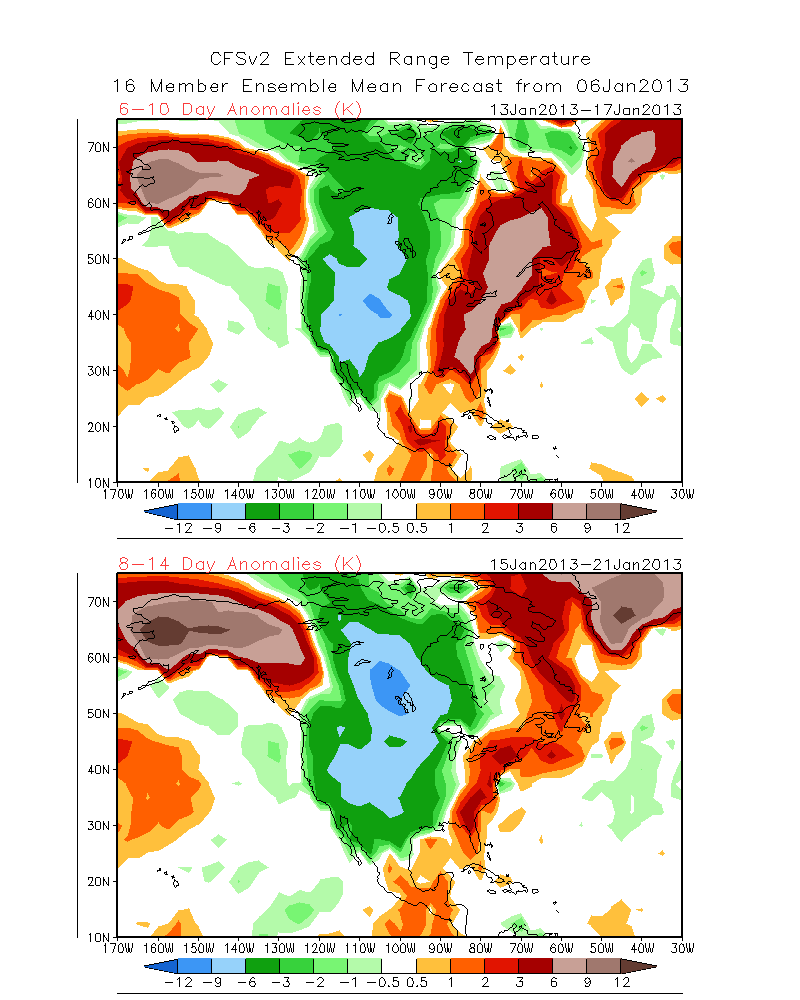
western and central U.S., including Oklahoma. This is the temperature anomaly
picture for the U.S. for January 13-17 and 15-21 from the CPC's CFSv2 forecast
model. Anomalies of -2C to -12C are showing up for the western two-thirds of the
country.


Now this is the forecast using yesterday's data as the starting point, so it
could still change. But that cold air is amassing, and it will want to flow south
eventually. The Arctic Oscillation (AO) is about to go strongly negative, which
means there will be a weakness in the jet stream, allowing for more "dips" of
that arctic air as we've talked about in earlier Tickers.


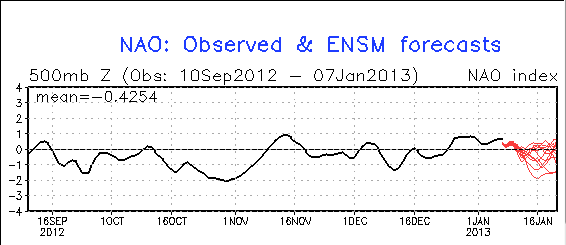
And the NAO is looking at negative territory in that time frame as well, so
there will probably be a blocking pattern west of Greenland, allowing that "dip"
to take shape of the U.S.


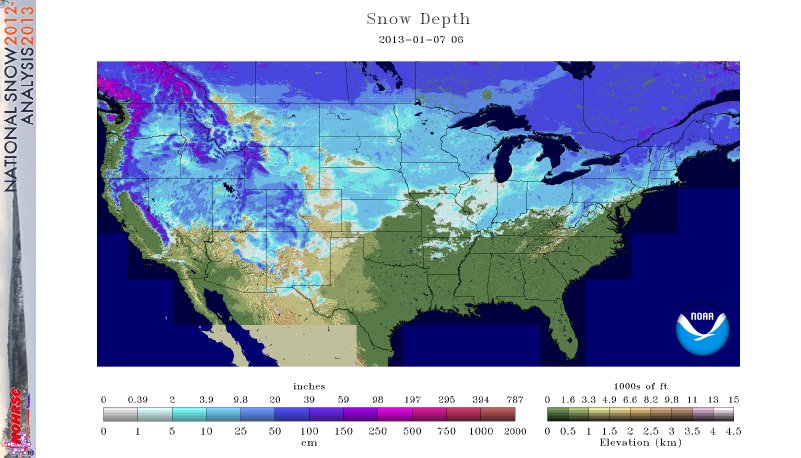
Finally, there's still some decent snowpack left between us and the origin area
of that arctic air. That should allow for some of that air to make it to us
with some of its original chill still intact. That snow could still melt between
now and then, but there will probably be some left. You can see from this
graphic that there is still about 57% of the country covered by snow (avg.
depth of about 5 inches).


There are some indications of above normal precipitation for that time frame
as well, but at this time, we're not prepared to implement the Bread and Milk
Broadcast System.

That's part of being spineless.

-------------------------------------------------------------------------------

Here comes the rain!

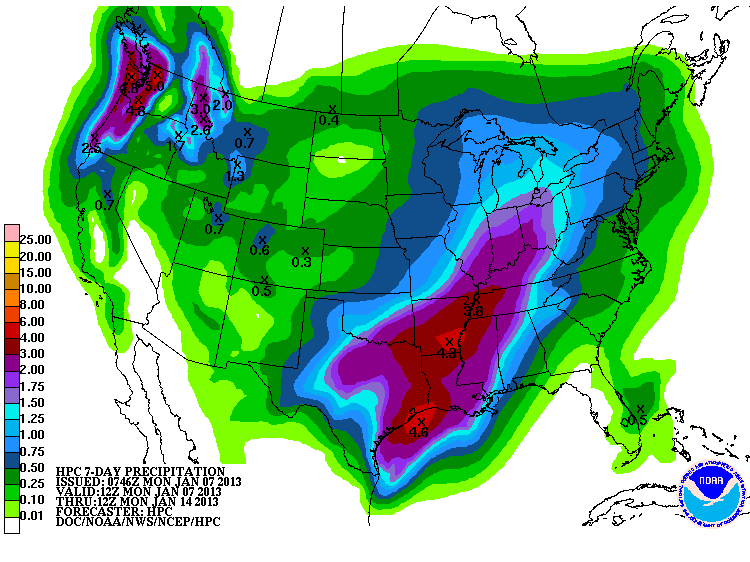
The forecast models have flirted a bit lately with taking out delicious-looking
rain totals farther to the south. Points south and east of Oklahoma probably
will get the more generous totals, but that still leaves from 1-2" for our
neck of the woods. Or areas of dessicated trees.


Southeast Oklahoma could get more than 3 inches, which would put them in drought
improvement territory. We'll watch those lakes and ponds down there and see
if they respond at all. Even the Panhandle is slated to get from a quarter to
possible three-quarters inches of moisture, which would be fantastic.

Here's out starting point, with the May 1, 2012-January 7, 2013, totals and
anomalies from the Oklahoma Mesonet. This has been the driest of all May 1-
January 7 periods dating back to 1895, of course, with a statewide average of
13.48", nearly 14" below normal.


So bring on the rain, but you can stuff you cold in a sock, mister!

Gary McManus
Associate State Climatologist
Oklahoma Climatological Survey
(405) 325-2253
gmcmanus@mesonet.org
January 7 in Mesonet History
| Record | Value | Station | Year |
|---|---|---|---|
| Maximum Temperature | 85°F | WOOD | 2006 |
| Minimum Temperature | -19°F | KENT | 2017 |
| Maximum Rainfall | 2.75″ | PORT | 2008 |
Mesonet records begin in 1994.
Search by Date
If you're a bit off, don't worry, because just like horseshoes, “almost” counts on the Ticker website!