Ticker for January 4, 2012
MESONET TICKER ... MESONET TICKER ... MESONET TICKER ... MESONET TICKER ...
January 4, 2012    January 4, 2012    January 4, 2012    January 4, 2012


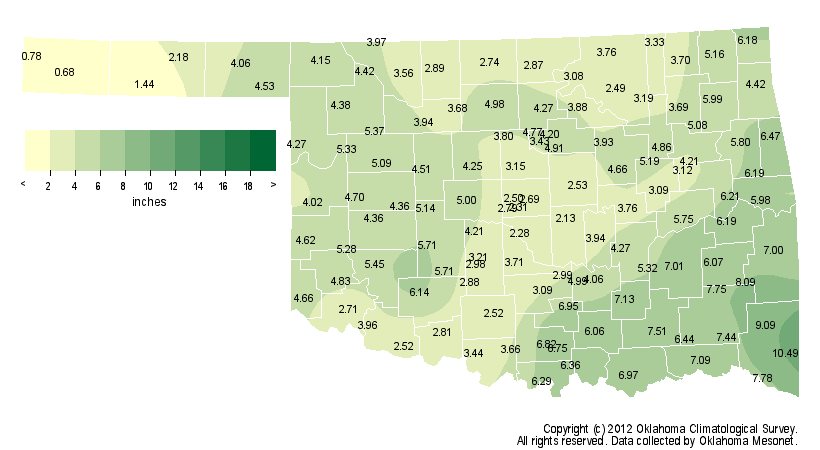
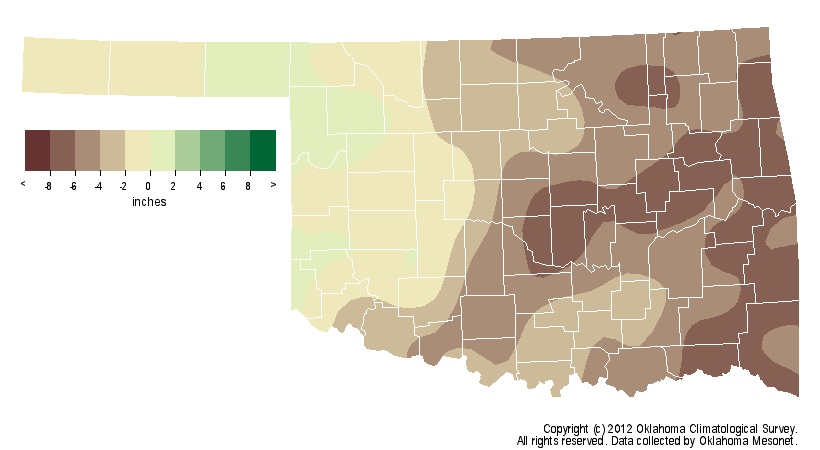
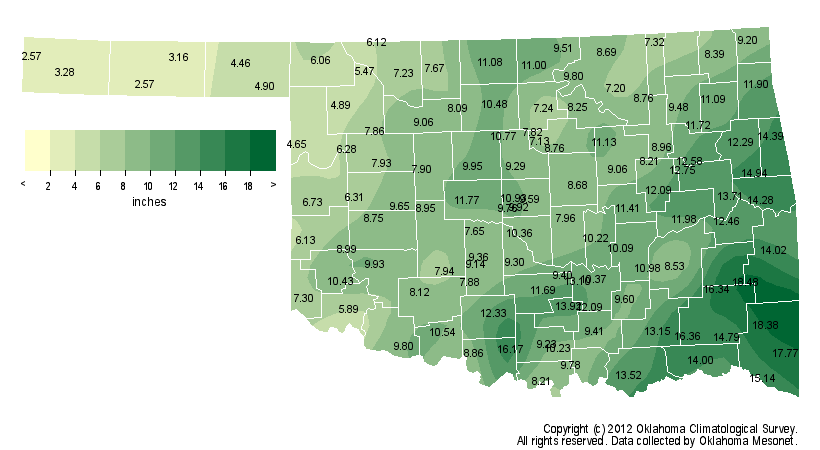
October-December: What a difference a year makes

Still beating a dead year around here so I thought another look at our Octember
(I'm tired of hyphens) period was in order. As has been mentioned many times, last
year's catastrophic drought actually got its start in October 2010. Take a look
at the differences between the two October-December periods and how we went from
some of the driest weather on record to some of the wettest.

October-December 2010


-****-
October-December 2010 Mesonet Precipitation
Clim. Div.	Precipitation    Dep.	Rank since 1895
Panhandle	     2.76	-0.49	  58th Driest
North Central	     3.92	-2.12	  44th Driest
Northeast	     4.20	-5.33	  17th Driest
West Central	     4.70	-0.73	  55th Wettest
Central              3.50	-4.98	  18th Driest
East Central	     5.43	-6.12	  22nd Driest
Southwest	     4.51	-1.58	  52nd Driest
South Central	     5.35	-4.53	  27th Driest
Southeast	     7.72	-6.38	  27th Driest
Statewide	     4.56	-3.66	  26th Driest
-***-

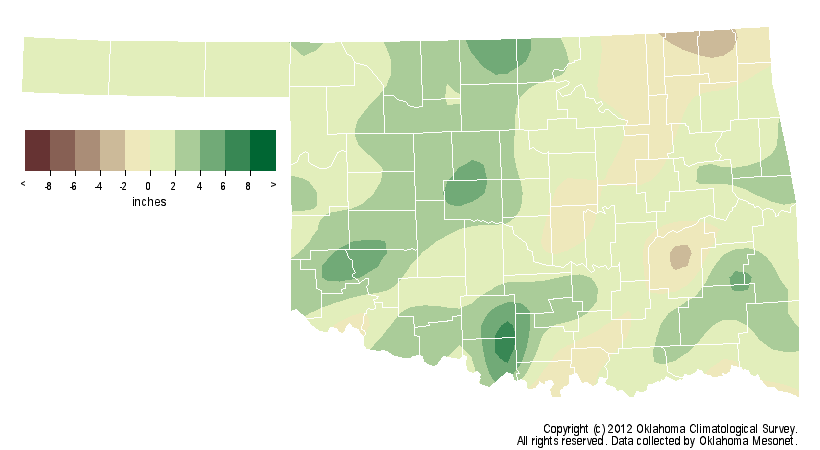
October-December 2011


-****-
October-December 2011 Mesonet Precipitation
Clim. Div.	Precipitation	     Dep.      Rank since 1895
Panhandle	    3.96	     0.71	32nd Wettest
North Central	    8.13	     2.09	17th Wettest
Northeast	    9.52	    -0.01	41st Wettest
West Central	    7.63	     2.20	21st Wettest
Central	            9.47	     0.99	23rd Wettest
East Central	   12.05	     0.50	37th Wettest
Southwest	    8.77	     2.68	20th Wettest
South Central	   11.24	     1.36	28th Wettest
Southeast	   16.14	     2.04	23rd Wettest
Statewide	    9.55	     1.33	28th Wettest
-***-

Combining the two tables above shows just how much our precipitation totals
increased during the last three months over the same period in 2010.

-****-
Clim. Div.	 2011-2010 Difference	  Percent Increase
Panhandle	        1.20		         43%
North Central		4.21		        107%
Northeast		5.32		        127%
West Central		2.93		         62%
Central		        5.97		        171%
East Central		6.62		        122%
Southwest		4.26		         94%
South Central		5.89		        110%
Southeast		8.42		        109%
Statewide		4.99		        109%

Astounding! In most cases the precipitation amounts more than doubled. That's
also the reason there is so much optimism for this year's winter wheat crop.
After being devastated by the drought in 2011, this year's crop has risen from
the ashes of September drought fears, resurrected by the October-December rains.
The latest OK Crop Weather Report from the USDA-NASS Oklahoma Field Office
relates that 63% of the current Oklahoma wheat crop is rated Good/Excellent and
93% is rated Fair/Good/Excellent. Only 6% is rated as Poor and 1% rated as Very
Poor. Certainly an improvement over last year at this time as the crop was
rated as 37% Good/Excellent, 81% Fair/Good/Excellent, 18% poor and 1% very
poor.

The rains have also brought a great improvement in the topsoil since last year
at this time. The NASS report from Jan. 3, 2011, found 76% of the state's
topsoil rated as Short/Very Short of moisture and only 24% with Adequate/Surplus
moisture. The Jan. 3, 2012 report counters with 33% of the soils rated as
Short/Very Short and 67% rated with Adequate/Surplus. The subsoil moisture is
a different story, however. The January 2011 report had 70% of the subsoil rated
as Short/Very Short and 30% rated Adequate/Surplus. For January 2012, those
numbers appear to be quite similar with 69% Short/Very Short and 31% Adequate/
Surplus.

With wheat and rain, it's often said the "when" is as important as the "how
much." More moisture will be needed for the crop, especially with the continued
moisture deficits in the subsoil. But compared to last year at this time, this
wheat crop is looking a whole lot better.

Gary McManus
Associate State Climatologist
Oklahoma Climatological Survey
(405) 325-2253
gmcmanus@mesonet.org
January 4 in Mesonet History
| Record | Value | Station | Year |
|---|---|---|---|
| Maximum Temperature | 72°F | HOLL | 2022 |
| Minimum Temperature | -6°F | BOIS | 2015 |
| Maximum Rainfall | 5.42″ | COOK | 1998 |
Mesonet records begin in 1994.
Search by Date
If you're a bit off, don't worry, because just like horseshoes, “almost” counts on the Ticker website!