Ticker for October 27, 2011
MESONET TICKER ... MESONET TICKER ... MESONET TICKER ... MESONET TICKER ...
October 27, 2011 October 27, 2011 October 27, 2011 October 27, 2011
Another brick out of the wall
As I've said before, there's nothing better than releasing information about a
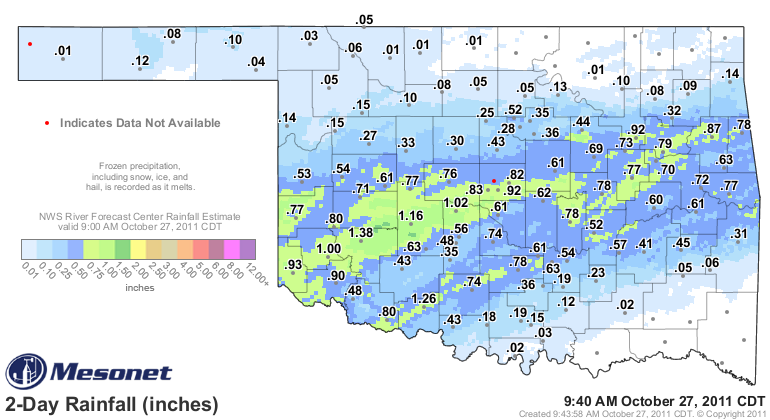
drought than on a nice rainy gray day. Rain continues to fall across Oklahoma
with more than an inch accumulating from southwestern through central and into
northeastern Oklahoma.
This follows the rainfall we had in early October and also the rain we had last
Saturday. Each of those is another chink in the drought's armor. In and of
themselves, they may not create widespread relief. They do weaken the drought's
hold on the state, however, and create the opportunities for future rains to
bring that widespread relief. As we've mentioned many times, drought relief does
not always occur with the bigtime events (e.g., October 1941 ending the Dust Bowl
drought with the wettest month in state history, or ending the 1950s drought with
the wettest year in state history -- 1957). If this drought dies the death of
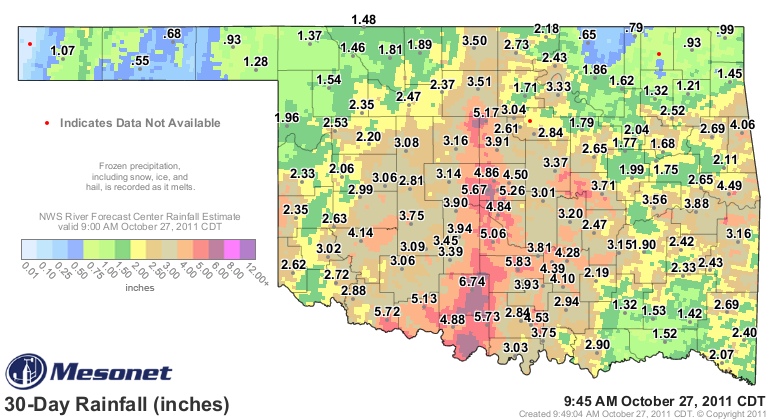
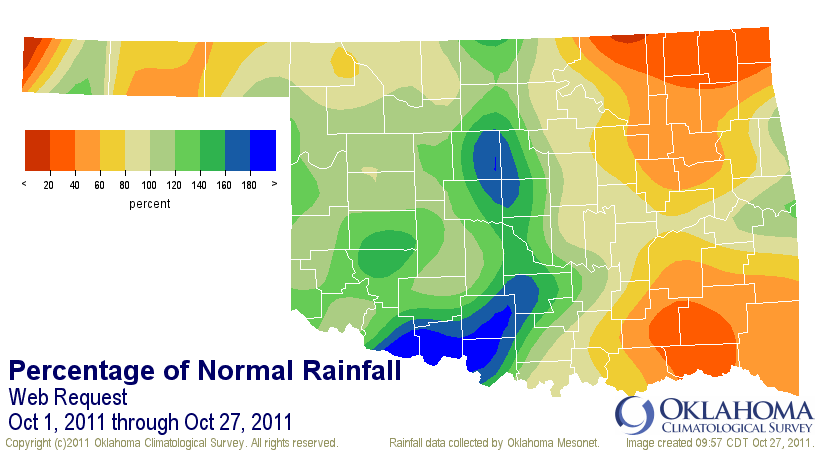
a thousand cuts, it will still be dead. The 30-day rainfall reflects where the
great rains have fallen across the state with these events.
The U.S. Drought Monitor continues to add improvements with each event. The
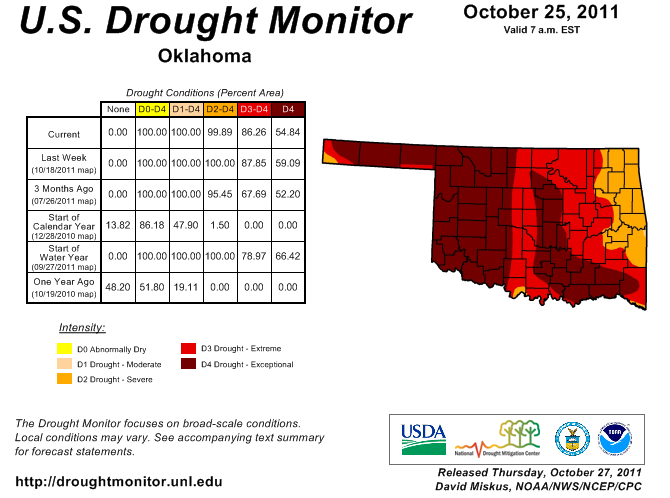
map released this morning indicates our area of exceptional (D4) drought
decreased by about four percent this week, and we even had a splotch of severe
(D2) drought in far south central Oklahoma. Hooray for severe drought?? Hey,
it's all relative. Improvements due to the current rainfall will not show up
until next Thursday's map.
The rainfall through this morning makes this October 1-27 the 36th wettest on
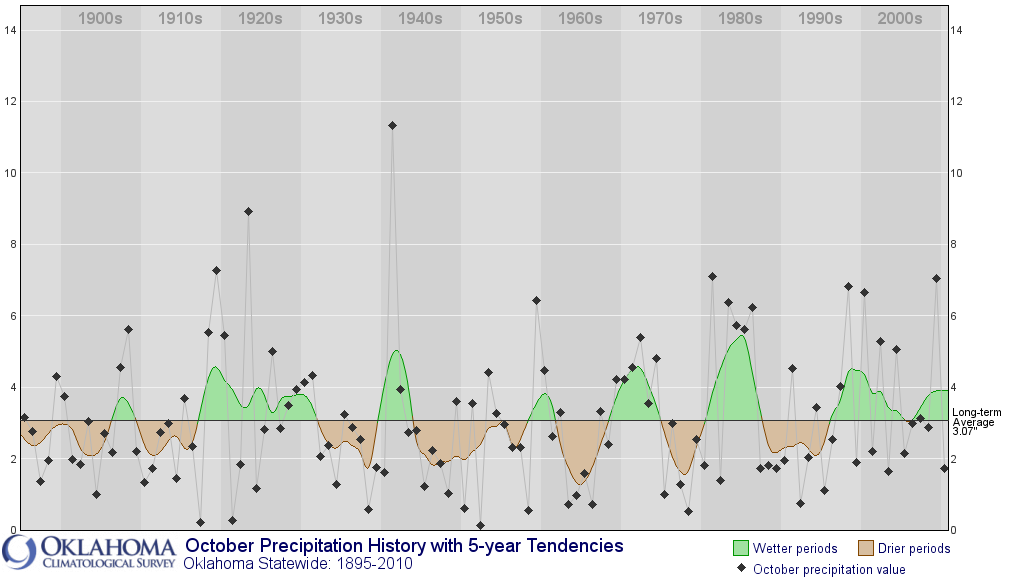
record since 1921 with 2.65 inches, on average, but still 0.3 inches below
normal. Still below normal, yet 36th wettest since 1921? Well, a look at
historical October statewide average rainfall gives us a clue how that odd
paradox arises.
Simply put,Oklahoma has had a bunch of really low statewide average rainfall
totals during October. There are a lot of those black squares below the 2-inch
line. So that gets us the higher rank with the below-normal total. Remember,
the normal period being used is still 1971-2000. There were more than a few
really high totals during that time frame, especially during the 1980s. That
skewed the averages higher for that period.
When the new statewide normals are released in a couple of months reflecting
the 1981-2010 data, we'll lose some of those low totals in the 1970s and
replace them with some "higher-low" totals from the 2000s. October normal
rainfall will possibly go up, depending on what occurs when we lose some of
the higher totals from the 1970s as well. If so, this rain will be even farther
below normal relative to the last 30 years, but the historical ranking will
remain the same.
Despite any oddities in the statistics, it's still wet and it looks pretty good
to me.
Gary McManus
Associate State Climatologist
Oklahoma Climatological Survey
(405) 325-2253
gmcmanus@mesonet.org
October 27 in Mesonet History
| Record | Value | Station | Year |
|---|---|---|---|
| Maximum Temperature | 91°F | MANG | 2014 |
| Minimum Temperature | 15°F | BOIS | 2020 |
| Maximum Rainfall | 4.03″ | EUFA | 2004 |
Mesonet records begin in 1994.
Search by Date
If you're a bit off, don't worry, because just like horseshoes, “almost” counts on the Ticker website!