Ticker for September 28, 2011
MESONET TICKER ... MESONET TICKER ... MESONET TICKER ... MESONET TICKER ...
September 28, 2011 September 28, 2011 September 28, 2011 September 28, 2011
A Brief History of Drought: The Biggies!
Yesterday I attempted to show how Oklahoma's drought characteristics have changed
over the last few decades in not only periodicity but length as well. As a
reminder, this image shows how the 20-year cycle of decadal-scale drought in the
first 60 years of the 20th century transitioned into an extended pluvial (wet
period) starting in the early 1980s.
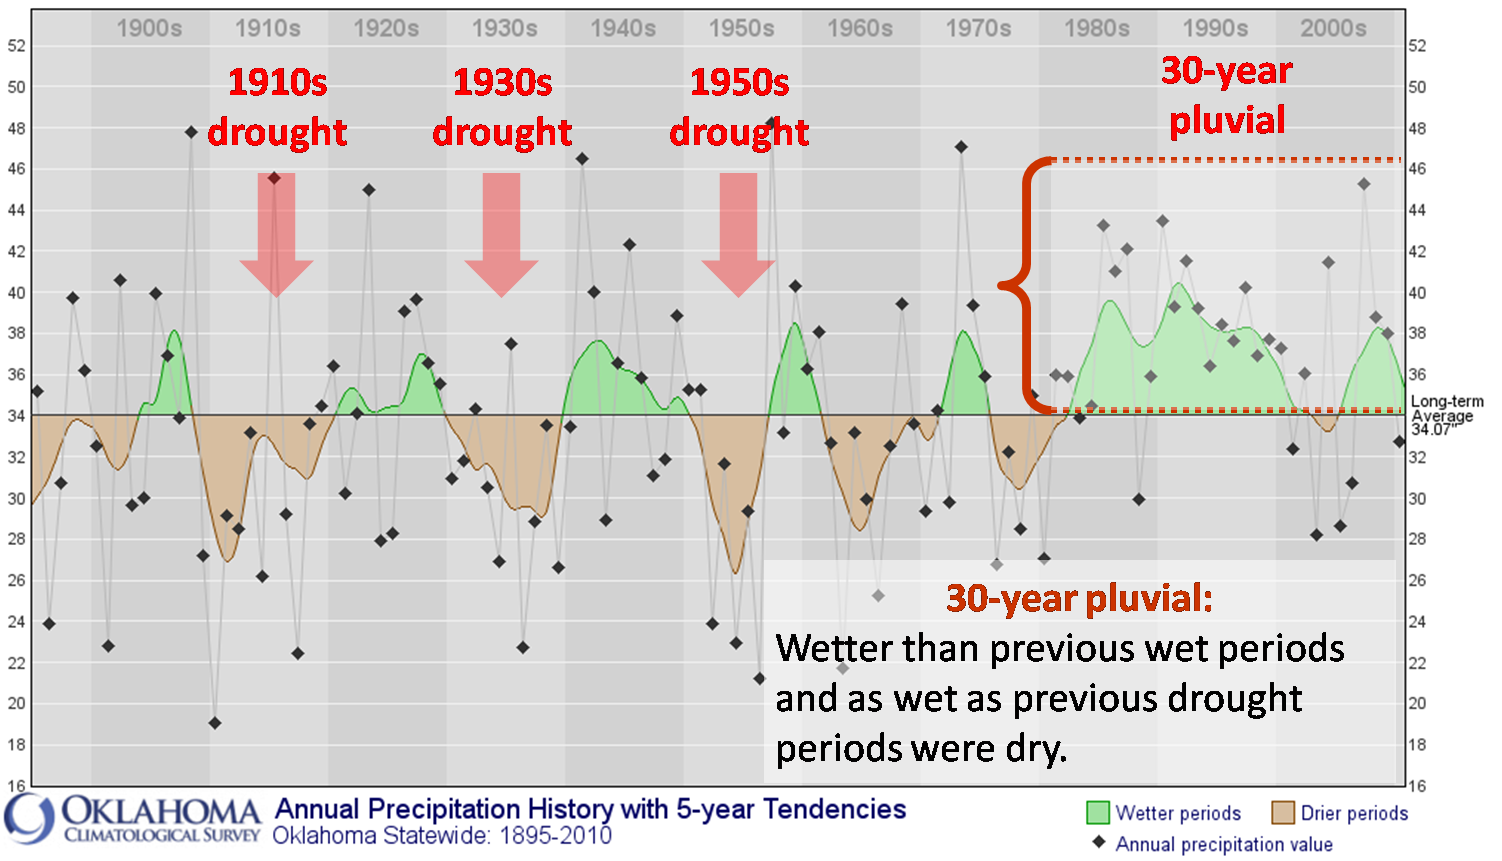
So the drought characteristic for Oklahoma went from nasty, society-changing
events like the 1930s Dust Bowl drought and the 1950s drought to short-yet-
severe episodes that last a year or so.
As I describe these decadal-scale droughts, paleoclimate data (i.e., tree rings,
sediment deposits, etc.) show evidence of even nastier droughts farther back in
history. These would dwarf the big droughts of the 20th century, such as the
1845-1860 drought or the "Great Drought" of the 13th century that is thought to
have caused the migration of the Anasazi away from their cliff dwellings in the
American Southwest. Tree ring studies (dendrochronology) show that drought
lasted from about 1276-1299, so a quarter-century of drought aptly labeled as
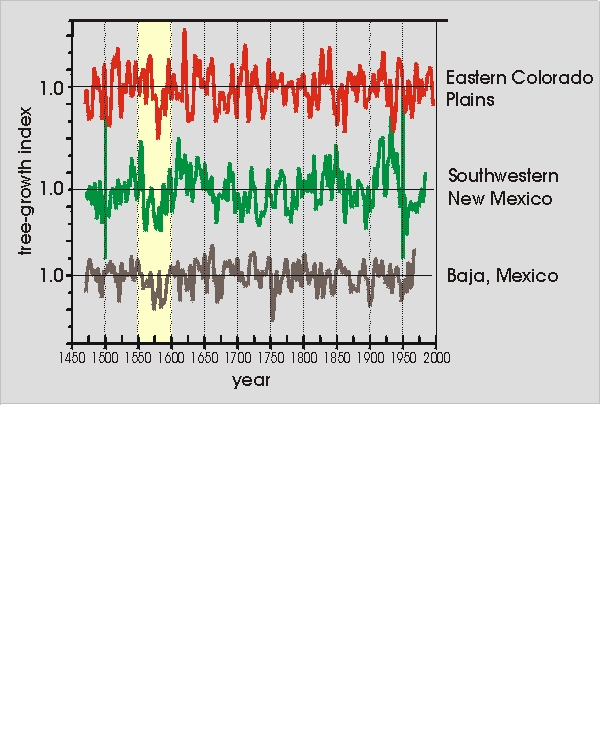
a "Mega Drought." For instance, take a gander (or goose) at this graphic
of tree-ring growth index showing the drought periods of the last 650 years
or so for various parts of the American Southwest. When the tree-ring index is
low, drought is signified. This picture has the Mega Drought of the 16th century
highlighted.
Current scientific literature once again attributes those extended drought
periods to connections of our weather with changes in sea surface temperatures
in the Pacific and Atlantic. This is known as a "teleconnections" And that is
why it is important to study that data from the past, to give us a clue of
current climate forcings and teleconnections. At any rate, on with the show.
We'll start with "The Biggies" for today's Ticker and give a brief summary of
those decadal-scale droughts mentioned previously.
****************************************************************************
Decadal-Scale Droughts
1909-18: For Oklahoma, this period remains the 10 driest consecutive years since
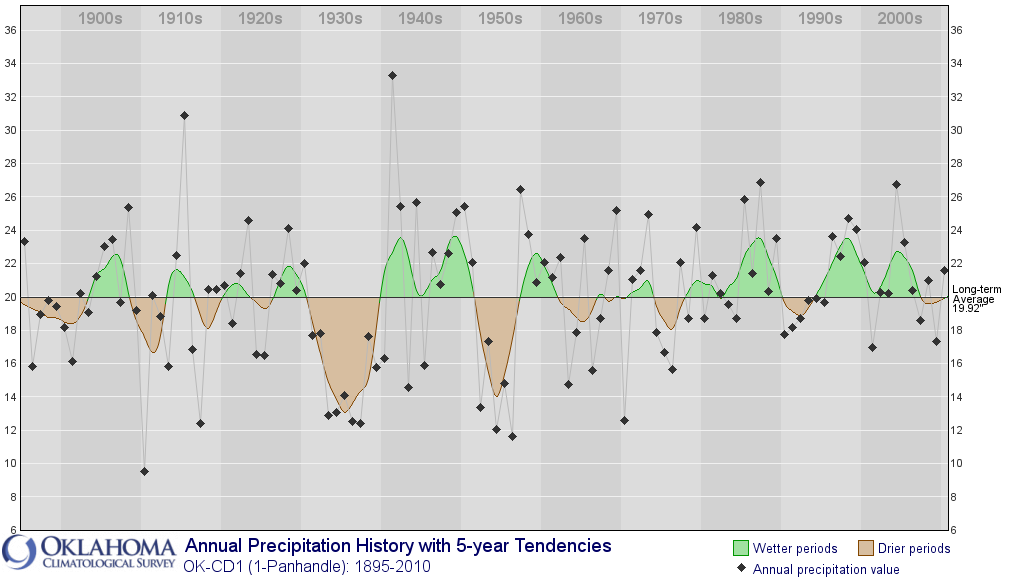
1900. This drought was much more severe in the main body of the state. Compare
the statewide precipitation history graph with that of the Panhandle. The
Panhandle precipitation was much more variable than that across the rest of the
state. Those wet years in the Panhandle actually helped to produce the coming
Dust Bowl drought two decades later by giving the High Plains farmer a false
sense of a wetter climate, if I can put it that way.

1931-41: The Dust Bowl (?Dirty Thirties?) drought of the 1930s was mostly a
Northern Plains/High Plains drought. This decade of drought was actually a
series of smaller droughts combined into the larger event. The interspersed
rainy periods were not enough to alleviate the damage done by the longer drought
periods. Again, compare the Panhandle precipitation history just shown to that
of the main body of the state. The Dust Bowl drought was clearly the drought
of record in the Panhandle (High Plains) region. As John Steinbeck portrayed in
his book "The Grapes of Wrath" that so enraged Oklahomans (Okies) at the time,
this was a society-changing drought, with a little-maybe-lot of help from the
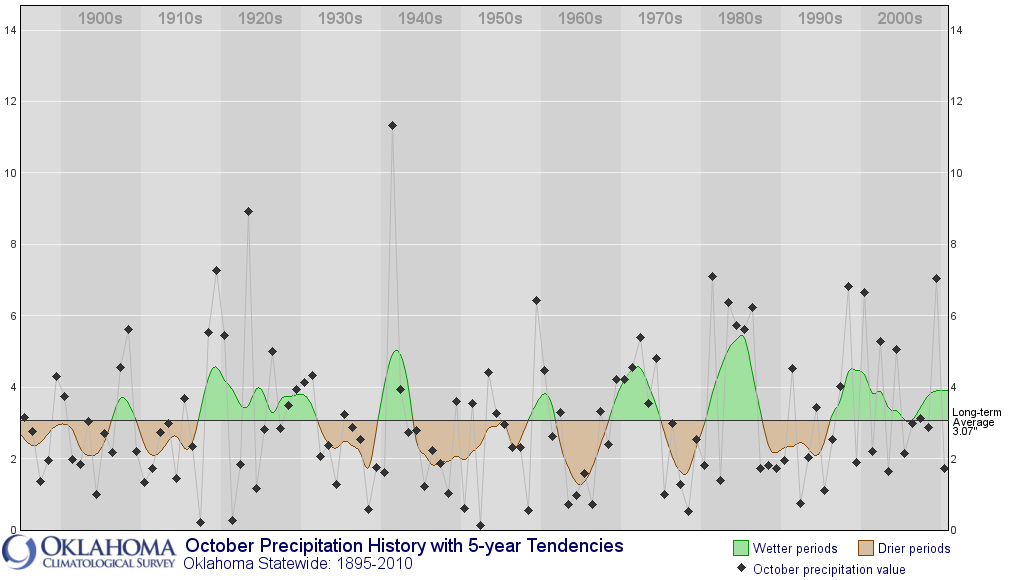
Depression. The final nail in this drought's coffin in Oklahoma was the October
1941 rains, and that month is still the wettest month (of any month) in
Oklahoma's recorded climate history with a statewide average of 11.32 inches.
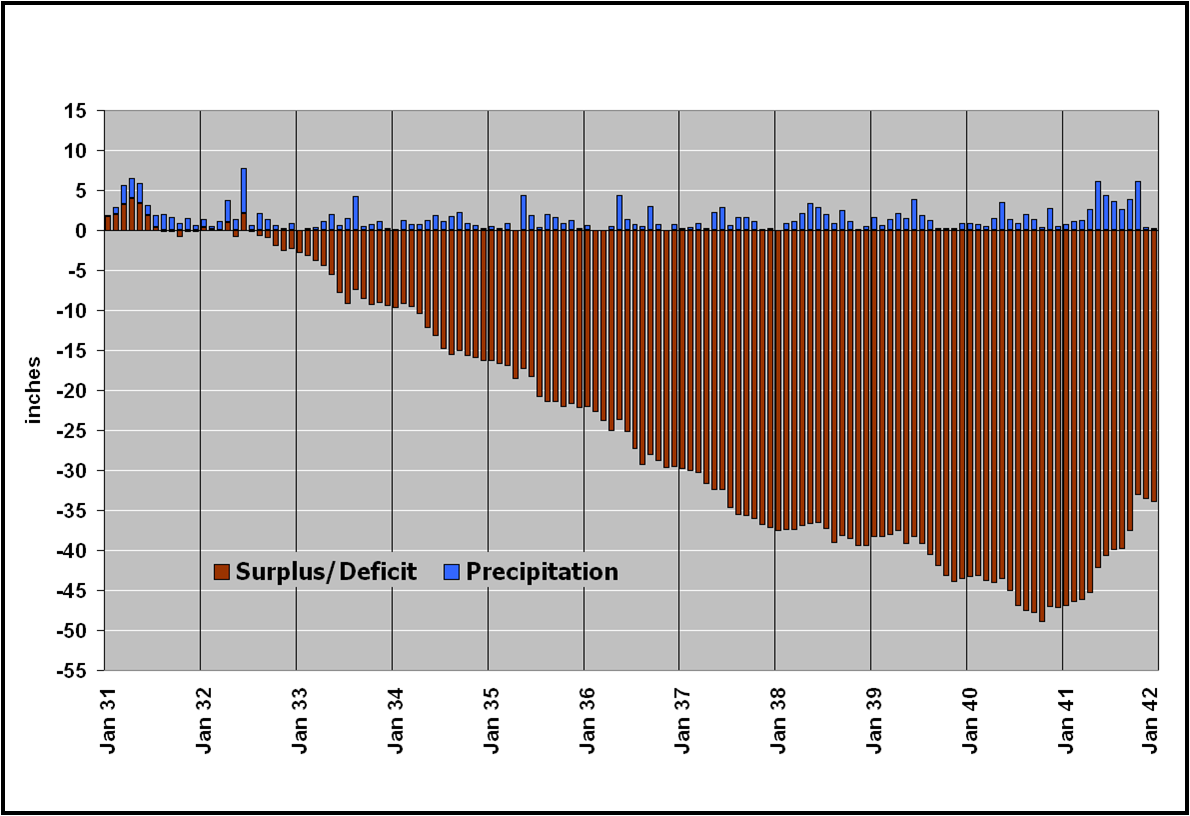
How bad did it get in the Panhandle during the 1930s drought? Here is a graphic
showing the monthly precipitation (blue bars) averaged over the Panhandle and
the running surplus (red bars above 0) or deficit (red bars below zero) over
the life cycle of the 1930s drought (1931-1941). As you can see, the cumulative
deficit of the region peaked at about 50 inches late in 1940.
1950-56: Statistically the drought of record for the main body of the state,
this drought was focused on the Southern Plains. For Texas, this was their
society-changing drought. Oklahoma is unfortunate enough to get the worst of
the impacts from both the 1930s and 1950s drought. Dust Bowl conditions did
not return with this drought thanks to improved farming/conservation practices
learned in the 1930s. Not having the entire High Plains of North America plowed
and waiting for the wind helped tremendously. This drought was broken by the
deluges of 1957, still the wettest year in Oklahoma's recorded climate history
with a statewide average of 48.21 inches.
***************************************************************************
The extreme rainfalls at the end of the 1930s and 1950s droughts are what helped
push the idea along that droughts are ended by flooding in Oklahoma. Still
waiting on the flooding to end this one! In a future Ticker I'll give you a
recap of more recent droughts. While not as long as The Biggies, they can
certainly be just as devastating while they're here ($1.6-2 billion and counting,
presently).
Gary "Okie Born and Bred" McManus
Associate State Climatologist
Oklahoma Climatological Survey
(405) 325-2253
gmcmanus@mesonet.org
September 28 in Mesonet History
| Record | Value | Station | Year |
|---|---|---|---|
| Maximum Temperature | 100°F | WALT | 1998 |
| Minimum Temperature | 35°F | KENT | 2006 |
| Maximum Rainfall | 3.03″ | SEIL | 2013 |
Mesonet records begin in 1994.
Search by Date
If you're a bit off, don't worry, because just like horseshoes, “almost” counts on the Ticker website!