Ticker for March 31, 2011
MESONET TICKER ... MESONET TICKER ... MESONET TICKER ... MESONET TICKER ...
March 31, 2011 March 31, 2011 March 31, 2011 March 31, 2011
WE ARE BOISE CITY!
188 days. That's not quite enough to impress a Spartan, but when you're talking
"how many days has it been since it has rained a quarter-inch in a single day"
... well, that's another matter altogether. It has now been 188 days since Boise
City has had at least a quarter-inch of rain in a single day.
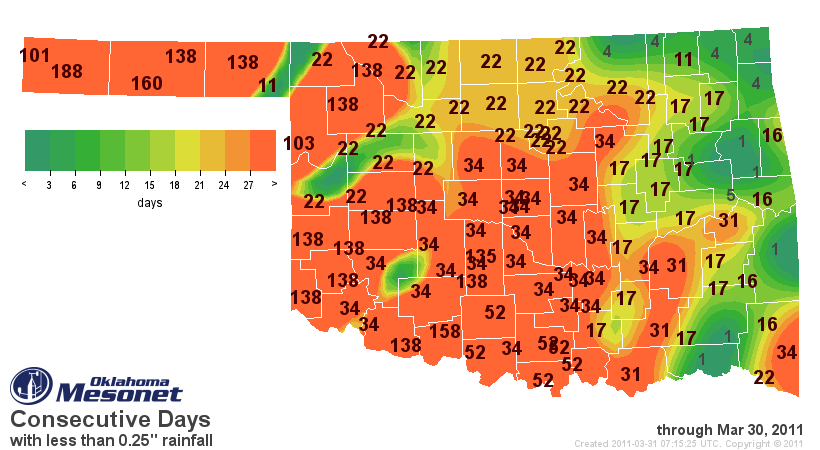
That takes us all the way back to September 23, 2010. Since that day, the
Oklahoma Mesonet site at Boise City has recorded a whopping 0.94" of rain, or
about 3.8" below normal. As you can see, things are not much better in the
southwestern corner of the state where it has been 158 days since Walters has
seen 0.25" in a day and 138 days since Grandfield has had 0.10".
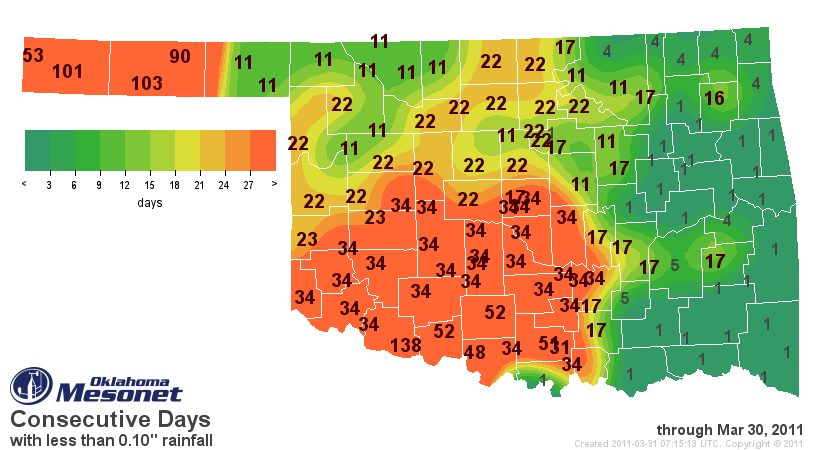
That one takes us back to October 24, 2010. Since then, Grandfield has had
0.77", over 8" below normal. Now since we have reached the end of the month we
can extend our climate division records back from 1921 to 1895. Provided there
is no significant precipitation today (HAHAHAHAHAHA!!!), this month will finish
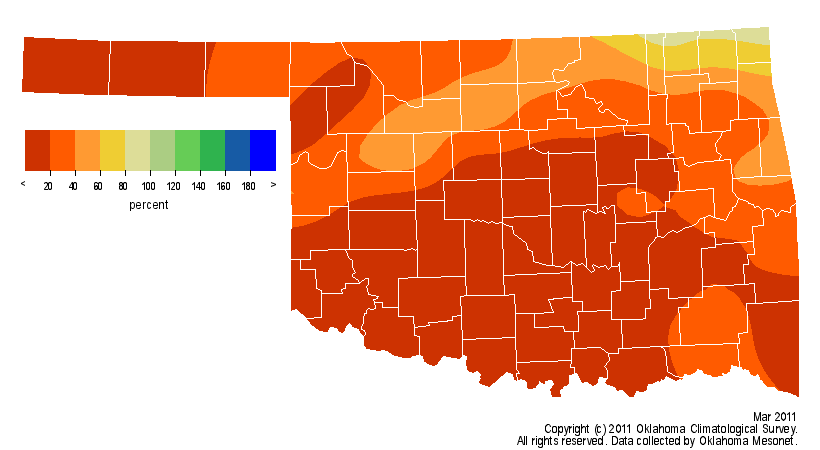
as the 8th driest March on record dating back to 1895 with a statewide average
of 0.67", 2.44" below normal. Oklahoma City will end up with 0.03" of rain for
March, the 2nd driest on record behind 1911's 0.02". Tops. of course, was 2007
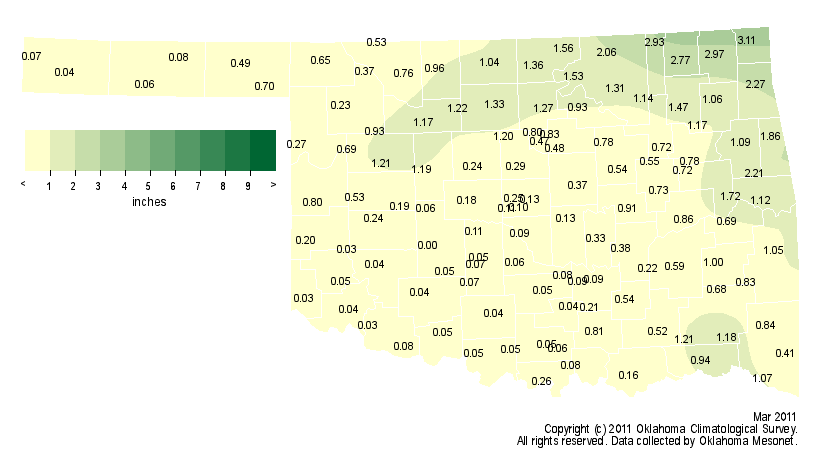
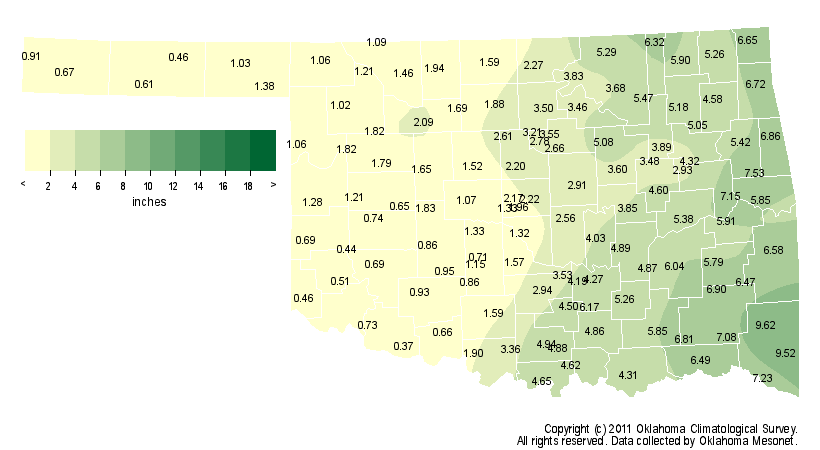
when 8.02 inches fell on OKC. Of the Mesonet's 120 stations, 32 had less than
a tenth of an inch of rain during March with Fort Cobb bringing up the rear with
a big old goose egg. Miami led the way with 3.1".
Here's a look at the entire state for March 2011:
Region Avg. Precip Departure Rank since 1895
Panhandle 0.29 -1.33 27th Driest
North Central 0.98 -1.70 33rd Driest
Northeast 1.75 -1.92 33rd Driest
West Central 0.56 -1.84 24th Driest
Central 0.36 -2.88 7th Driest
East Central 0.98 -3.11 9th Driest
Southwest 0.04 -2.22 2nd Driest
South Central 0.19 -3.36 1st Driest
Southeast 0.92 -3.56 1st Driest
Statewide 0.67 -2.44 8th Driest
Take it back to December 1 through today and the numbers are just as bleak:
Region Precip Departure Rank since 1895
Panhandle 0.90 -2.59 6th Driest
North Central 1.80 -4.33 6th Driest
Northeast 5.04 -4.46 13th Driest
West Central 1.14 -4.42 3rd Driest
Central 2.34 -6.14 2nd Driest
East Central 5.45 -6.18 10th Driest
Southwest 0.80 -5.23 1st Driest
South Central 4.22 -5.97 8th Driest
Southeast 7.25 -7.25 6th Driest
Statewide 3.18 -5.16 3rd Driest
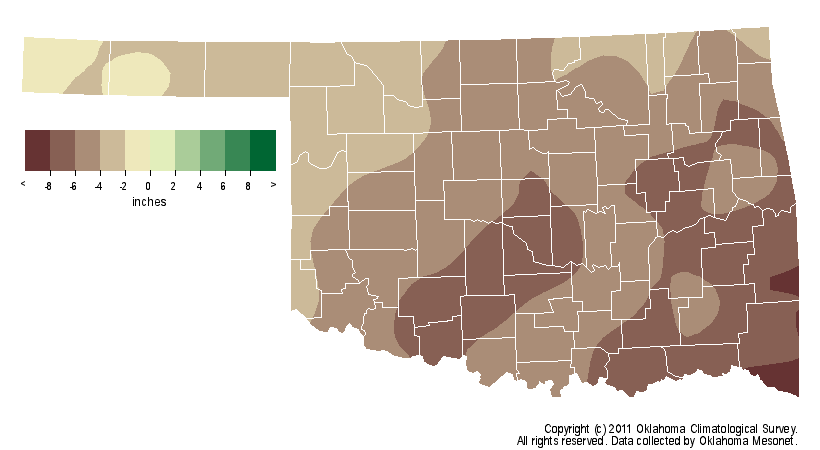
Looking at those numbers, every bushel of wheat harvested in southwestern
Oklahoma this June should be made into Wonder bread (emphasis on "WONDER"!). All
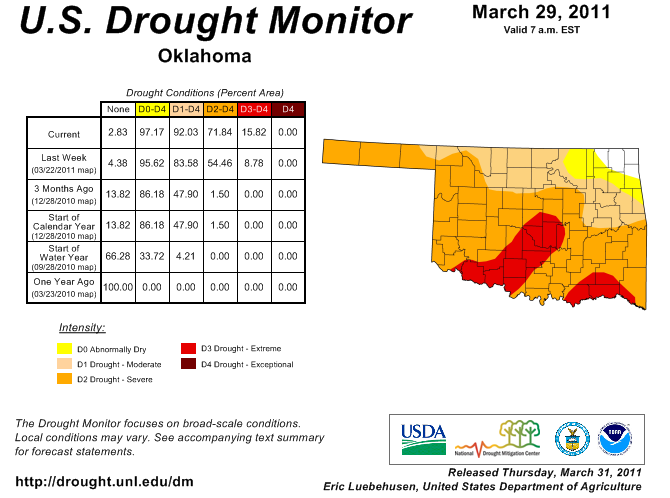
of this news culminates in yet another depressing graphic - the latest U.S.
Drought Monitor map which sees even MORE expansion of extreme (D3) drought in
southeastern Oklahoma.
Not to toot our own horn, or even hoot our own torn, but OCS began mentioning
the possibility of a cool-season drought as early as last May when word of a
developing La Nina first materialized. When signs appeared it would be a fairly
strong La Nina, we grew a little more concerned. Does every La Nina impact
Oklahoma this way? No. Was La Nina a major influence on the upper-air patterns
that produced this drought in the Southern Plains? Yes. Do I always ask and
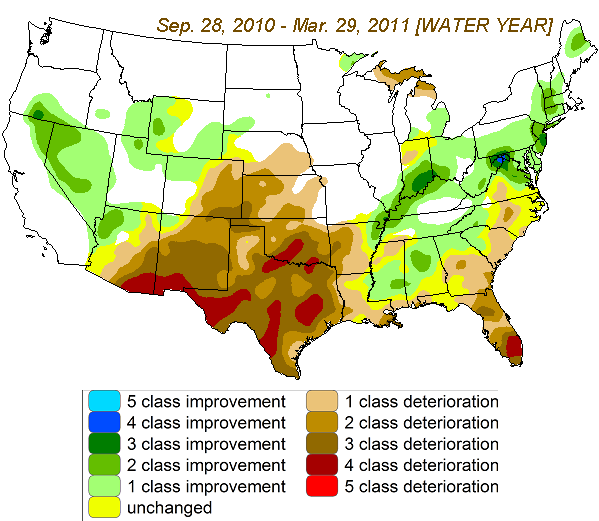
answer my own questions? Sometimes. But here you can see the classic impact
pattern on the Southern Plains by this phenomenon by looking at the change in
the U.S. Drought Monitor map from September 28, 2010-March 29, 2011.
Does that make up for all the times we've been wrong?
No.
Gary McManus
Associate State Climatologist
Oklahoma Climatological Survey
(405) 325-2253
gmcmanus@mesonet.org
March 31 in Mesonet History
| Record | Value | Station | Year |
|---|---|---|---|
| Maximum Temperature | 97°F | BUTL | 2010 |
| Minimum Temperature | 16°F | EVAX | 2019 |
| Maximum Rainfall | 5.36″ | BOWL | 2015 |
Mesonet records begin in 1994.
Search by Date
If you're a bit off, don't worry, because just like horseshoes, “almost” counts on the Ticker website!