Ticker for August 6, 2010
MESONET TICKER ... MESONET TICKER ... MESONET TICKER ... MESONET TICKER ...
August 6, 2010 August 6, 2010 August 6, 2010 August 6, 2010
Withering Heights
As I've talked about before, one of our responsibilities here at OCS is to
represent the state in matters weather or climate related, both inside and
outside the state's borders. For example, we are to provide expertise and input
to the U.S. Drought Monitor, which tracks drought and drought impacts across the
country.
http://www.drought.unl.edu/dm/monitor.html
Recently, we recommended severe drought for Harper County and moderate drought
for parts of southeastern Oklahoma:
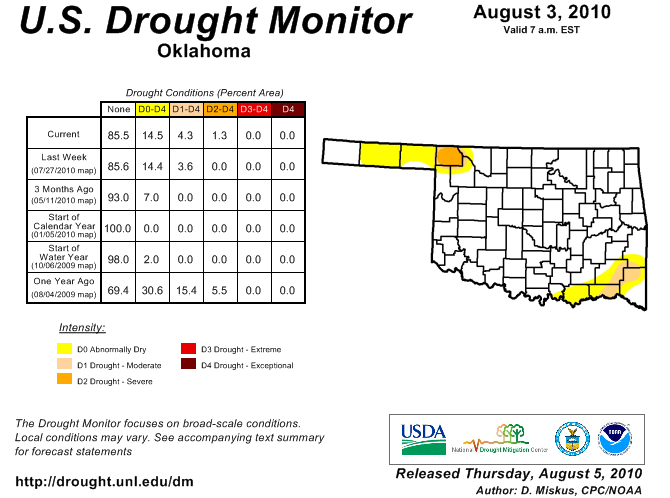
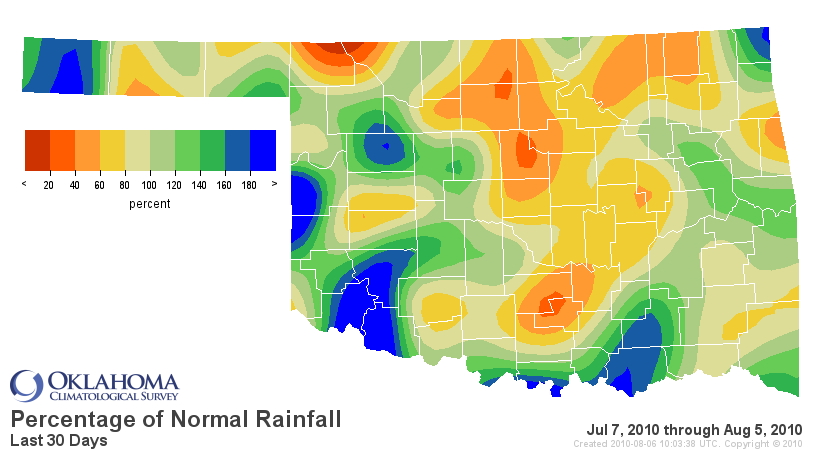
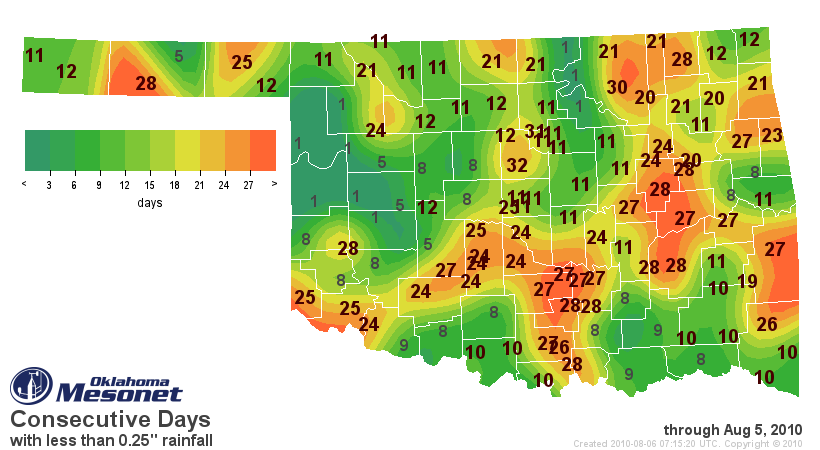
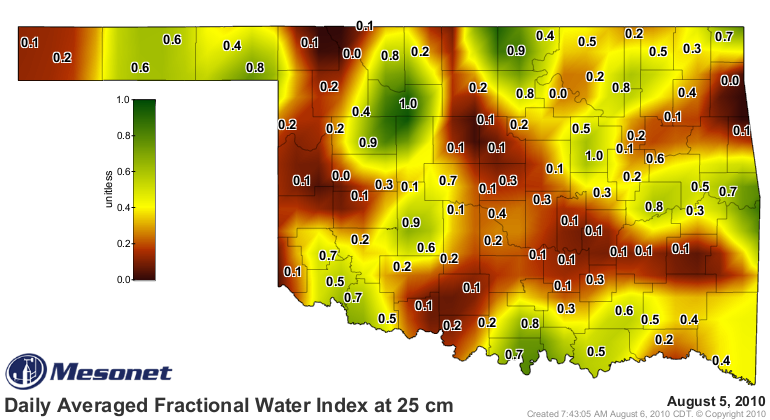
Now it is beginning to get fairly dry across parts of the state after all the
rainfall we had in June and July, as evident in the Mesonet rainfall and soil
moisture data:
You might ask the question, why does Harper County in the northwest and parts
of the southeast get a drought designation while other parts of the state that
appear as dry get no designation? Well, drought is tricky at times to identify.
You have to recognize the difference between long-term dryness and short-term
dryness, and what SHOULD be expected at the time.
So why do other parts of the state remain in the white in that Drought Monitor
map? Well, to put it bluntly, because it's summer and it's sorta supposed to be
dry in the summer, right? Let's take a look at the case of the Buffalo Mesonet
site, which anchors the severe drought designation in Harper County. Buffalo's
rainfall amounts tell the story:
Period Total (inches)
last 30 days 0.8
last 60 days 2.4
last 90 days 5.9
last 120 days 7.4
last 180 days 9.5
since Jan 1 10.5
last 365 days 16.1
So while other areas enjoyed above normal rainfall over the last few months,
Buffalo has been largely left high and dry. Further, Buffalo's strange aversion
to rainfall has lasted for several years. Take a look at their monthly rain
totals dating back to 2006:
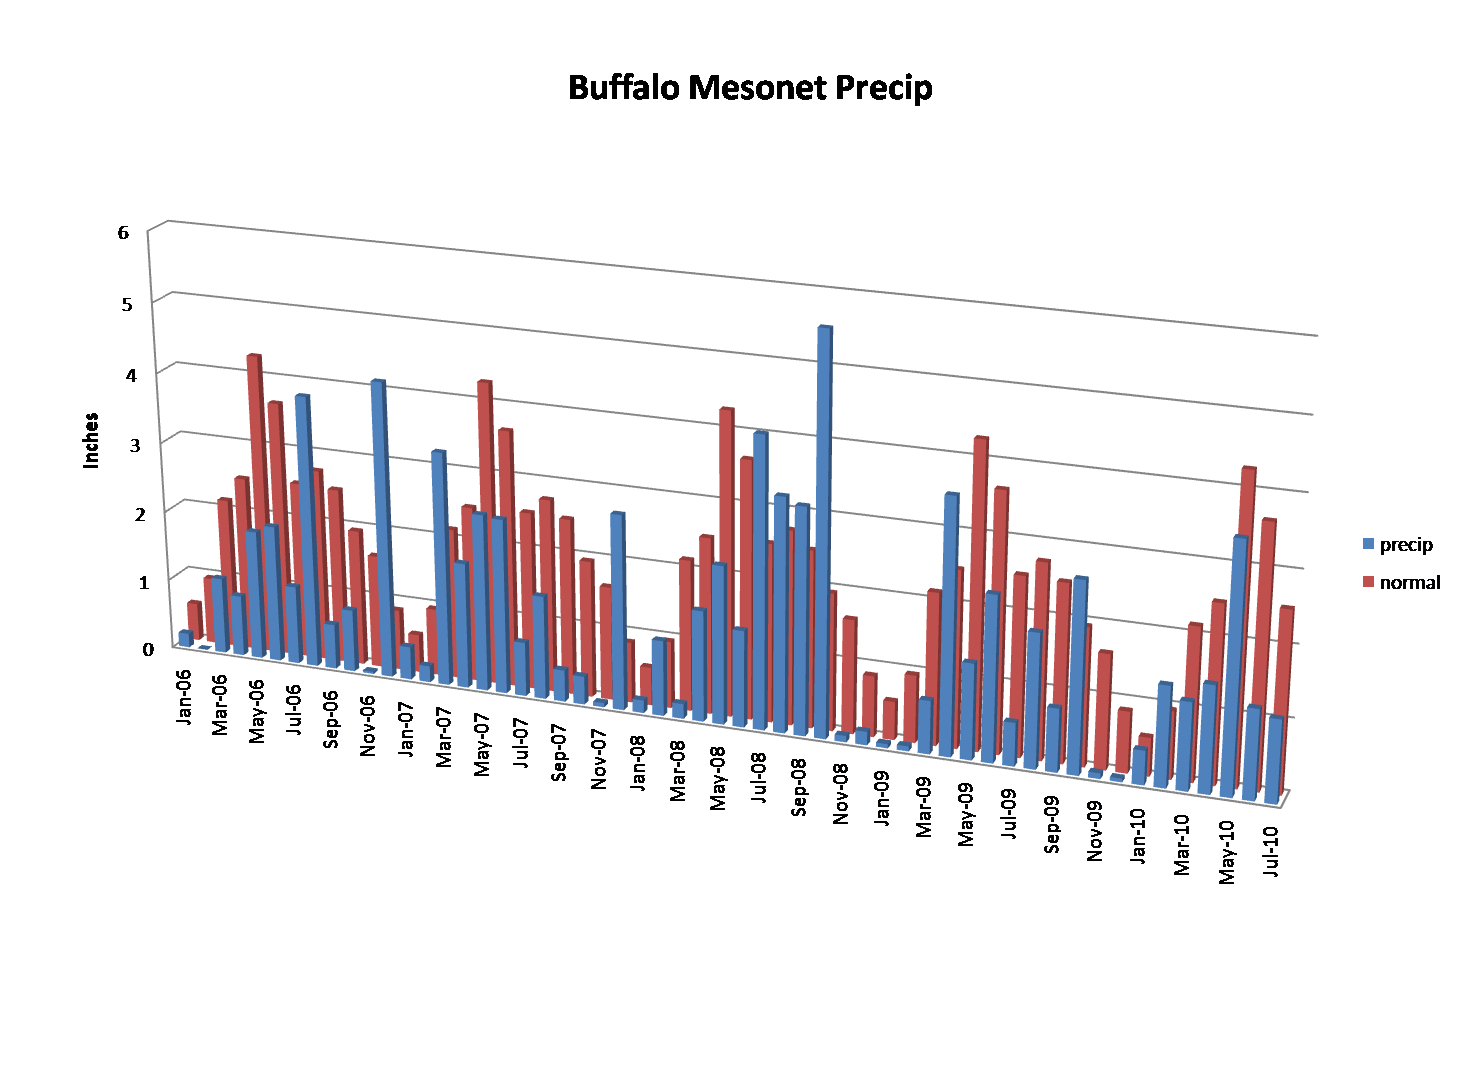
The more red you see on that chart, the worse the dryness has been ... and
there's a LOT of red on that chart. In fact, Buffalo has finished below normal
for 44 of the last 55 months, and the total deficit over those 55 months
amounted to -39.88 inches. To make matters worse, Buffalo has borne the worst
of the heat over that time period as well, hitting triple-digits 16 out of the
last 25 days for an average high temperature of 100 degrees.
So sometimes, "what have you done for me lately" is not the primary concern.
For most of us that are dry this summer, well, what did you expect?
It's summer!
Gary McManus
Associate State Climatologist
Oklahoma Climatological Survey
(405) 325-2253
gmcmanus@mesonet.org
August 6 in Mesonet History
| Record | Value | Station | Year |
|---|---|---|---|
| Maximum Temperature | 112°F | OKMU | 2011 |
| Minimum Temperature | 54°F | BOIS | 1998 |
| Maximum Rainfall | 6.70″ | HUGO | 2017 |
Mesonet records begin in 1994.
Search by Date
If you're a bit off, don't worry, because just like horseshoes, “almost” counts on the Ticker website!