Ticker for January 25, 2010
MESONET TICKER ... MESONET TICKER ... MESONET TICKER ... MESONET TICKER ...
January 25, 2010   January 25, 2010   January 25, 2010   January 25, 2010


Of Bread and Milk

That's right, rush to the store now to get your bread, milk and generators. Just
let me know when you are going because I hate crowds. After a two-week break,
Old Man Winter is forecast (a lawyer would say "allegedly") to make a visit to
the state. It's still a few days out, so the storm track could change between
now and then, but it would appear that somewhere in the state is going to get
rain, snow, sleet, and the most grievous fiend of all ... freezing rain.

Here's the deal though. Did you know that a couple of enterprising young
gentlemen from right here in Oklahoma have come up with an index to measure the
severity of ice accumulations from freezing rain events? In fact, this index
has already won a national award from the American Public Works Association
for Technical Innovation of the Year.

The index is known as the "Sperry-Piltz Ice Accumultaion Index" or SPIA for
short. The inventors of the index are Sid Sperry, director of public relations,
communications and research at the Oklahoma Association of Electric
Cooperatives in Oklahoma City, and Steve Piltz, meteorologist in charge at the
Tulsa National Weather Service forecast office. The index was started
specifically to monitor the need for utility managers to make preparations
for freezing rain events. It is obviously a nice trump card to know where
to pre-place repair crews in the event of freezing rain, and that's
where the index as a forecast comes in. The Oklahoma Mesonet plays a very
important part in the real-time adjustment to the index forecasts as well.

You can see the home page for the index at the NWS Tulsa office's home page,
known ironically as "bad ice":

http://www.srh.noaa.gov/tsa/?n=badice

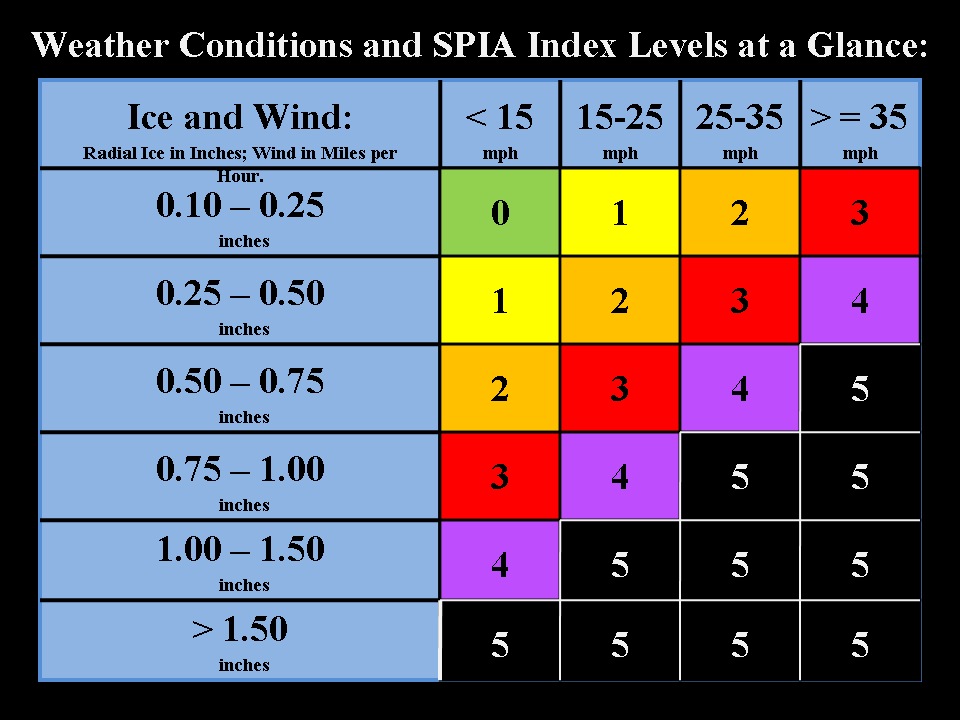
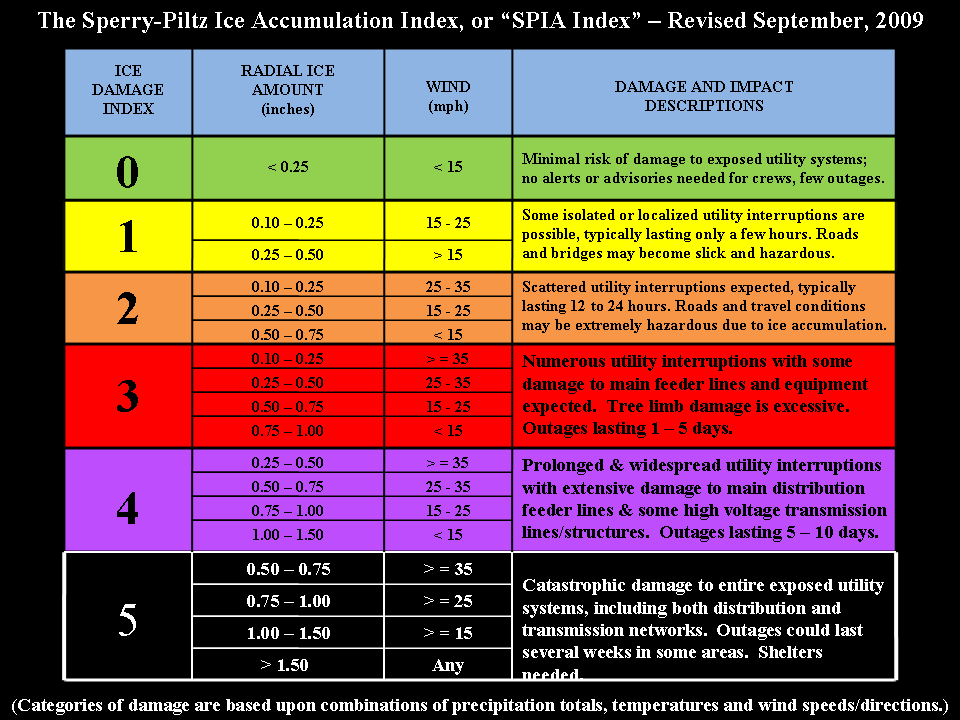
Utility damage from ice storms comes from a combination of wind and ice
accumulation. How does that affect power lines? Well, you can see for yourself
with these two SPIA tables:


One interesting effect can occur when the ice starts forming on power lines
then starts to get blown into the shape of an airfoil on the line itself. So
by making power lines into airplane wings, you create lift for the bouncing
up and down that causes so much damage.

The index is also used as a diagnostic. Since 2000, the state has seen nine
ice storms of Level 3 or above, with five of those storms rated as level 5.
The last one might shock you, but level 3 damage was associated with the
Christmas Eve storm in southwestern Oklahoma. It left 35,000 customers without
power and caused nearly $2 million in damages. Since 2000, the state has
suffered more than $1.5 billion in damages from ice storms with more than 1.3
million customers experiencing power outages.

The potential for this index and the information it provides obviously has
many more uses than just for utilities. I like to know where there's going
to be a hundredth of an inch of ice if I'm going to be driving, let alone
a half of an inch! The index is viewable by the public at the Tulsa page, but
only for northeastern Oklahoma. To ease your mind, there are products available
for utilities for the rest of the state as well, just not open to the public
yet. Stay tuned!

Now off to the land of milk and bread.

$1.5 billion dollars!!

Gary McManus
Associate State Climatologist
Oklahoma Climatological Survey
(405) 325-2253
January 25 in Mesonet History
| Record | Value | Station | Year |
|---|---|---|---|
| Maximum Temperature | 77°F | MADI | 2005 |
| Minimum Temperature | 7°F | VINI | 2019 |
| Maximum Rainfall | 3.32″ | MTHE | 2012 |
Mesonet records begin in 1994.
Search by Date
If you're a bit off, don't worry, because just like horseshoes, “almost” counts on the Ticker website!