Ticker for December 7, 2007
MESONET TICKER ... MESONET TICKER ... MESONET TICKER ... MESONET TICKER ...
December 7, 2007   December 7, 2007   December 7, 2007   December 7, 2007


Use a Meteogram to Help Diagnose Winter Precip Issues

With the possibility of winter weather becoming concrete for much
of the state, here are a few meteogram-watching tricks for assessing
ice deposition. Remember, these are "poor man's guides" ... and
are intended to supplement (not replace!) information from official
sources.

A meteogram can be extremely valuable in winter situations. Take a
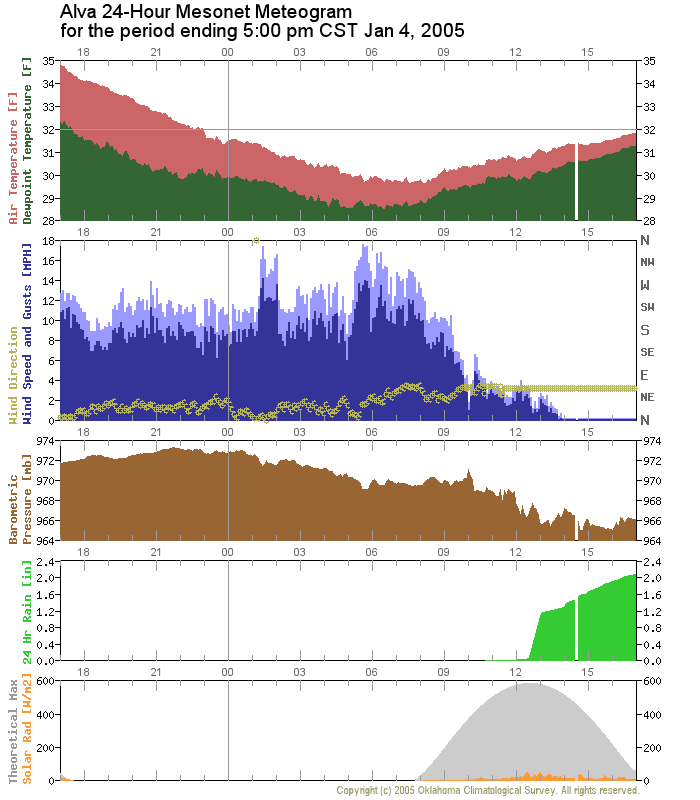
look at this Alva meteogram from 2005:


A few things to notice from this meteogram (and you can apply these
features during the upcoming event):

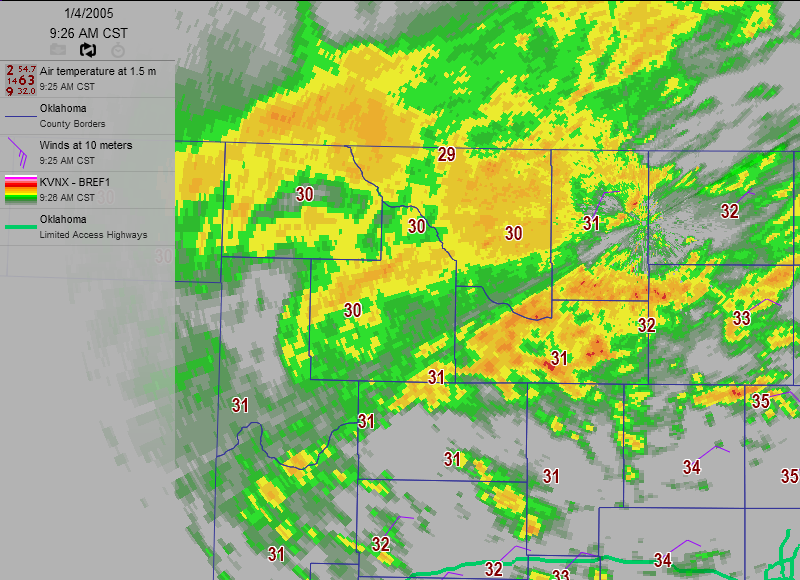
1a. Notice that, at 9:30 am, the temperature was below freezing, but
precipitation had yet to accumulate in the rain gauge. And it was
certainly precipitating at the time:

(Alva is the big "30" right in the middle of the image)

1b. Also notice that, at 9:30 am, the winds (blue traces) started
grinding down toward zero, then locking from one direction.
A couple hours later, they WERE zero. As we all know, zero-mph
winds don't happen in Oklahoma during winter storms.

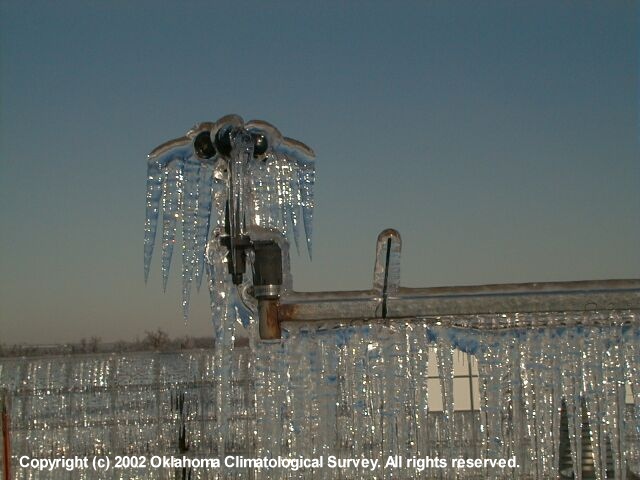
Together, 1a and 1b indicate light precip that was freezing onto
the wind instrumentation, not too dissimilar to this:


Now, here's the important thing: the wind sensor is placed at
ten meters above the ground (about 30 feet). So, when the wind
sensor starts to freeze up, it's a decent indicator that other
elevated things (power lines, limbs, etc.) are beginning to do so
as well.

2. Notice in the 2005 Alva meteogram that water flows through the
rain gauge from about noon onward. Mesonet rain gauges are
attached to the ground (they resemble knee-high ashtrays), so
when water flows through them, it indicates that near-surface
(within a foot or two) temps are above freezing. This would be
a surrogate indicator that ice/snow in the area is melting upon
contact with the ground (note: this does NOT COUNT FOR BRIDGES
AND OVERPASSES!).

3. Together, if the wind sensor grinds to a halt, but water still
flows through the rain gauge, it probably means bad things are
happening overhead, but surfaces are relatively better.

NOTE: On a meteogram, precipitation is indicated by an accumulation
in the green trace. A flat green trace indicates zero precip
accumulation since the time that the line went flat. In other
words, precip is indicated by a *rising* green line.

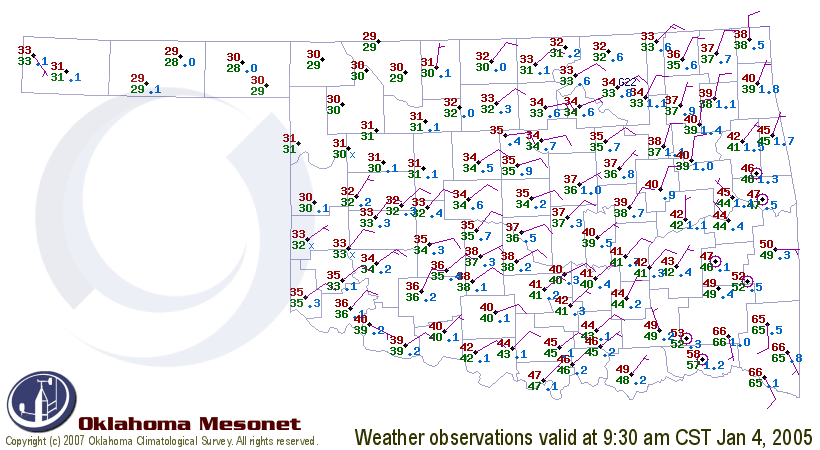
One more thing: if Mesonet wind barbs begin to disappear, a la:

it's another indicator of the extent of icing (at 30 feet).

Enjoy your meteograms, and let us know how they did.
December 7 in Mesonet History
| Record | Value | Station | Year |
|---|---|---|---|
| Maximum Temperature | 80°F | BURN | 2007 |
| Minimum Temperature | -9°F | BOIS | 2005 |
| Maximum Rainfall | 1.27″ | BBOW | 1997 |
Mesonet records begin in 1994.
Search by Date
If you're a bit off, don't worry, because just like horseshoes, “almost” counts on the Ticker website!