Ticker for July 26, 2006
MESONET TICKER ... MESONET TICKER ... MESONET TICKER ... MESONET TICKER ...
July 26, 2006 July 26, 2006 July 26, 2006 July 26, 2006
It's Not Just The Shift, It's the Shape Too
Folks who have read the Ticker over our eight years know us for two
things: plagiarism and lousy editing.
But hopefully you've looked past that and know us for two more:
1. Our insistence that one "normal" number doesn't describe climate
2. Our undying loyalty to the meteogram as a descriptive tool
Well, today we get to marry some cousins of these two holy concepts!
Anyway, on with the show ...
We've all heard again and again that climate is "changing", and that's
probably true. It's also true that climate has been changing for as
long as we've observed it. And, often, the climate change is
represented (clumsily) as a single-number "shift". Something like:
in the year NNNN, the average temperature will be X.X degrees warmer.
We don't claim to know the ultimate answer for the unknowns above,
but we do tend to dislike single-number declarations. Also, what is
often lost in such statements is the fact that most of us rise, act
and retire 365 times per year. We don't go about our human business
over the course of a year, we do it in chunks of DAYS. And it is the
climate change in DAYS that will affect us most.
In other words, considering temperature alone, a single-number shift
in the annual average won't affect us as directly as a change in the
SHAPE of the annual curve. Which parts of it are being pulled upward
and which downward? A shift of X.X degrees over the course of a year
doesn't mean each day will be X.X degrees warmer. Some parts of the
calendar will warm more than others.
And that's exactly what we've seen in the last ten years in Oklahoma.
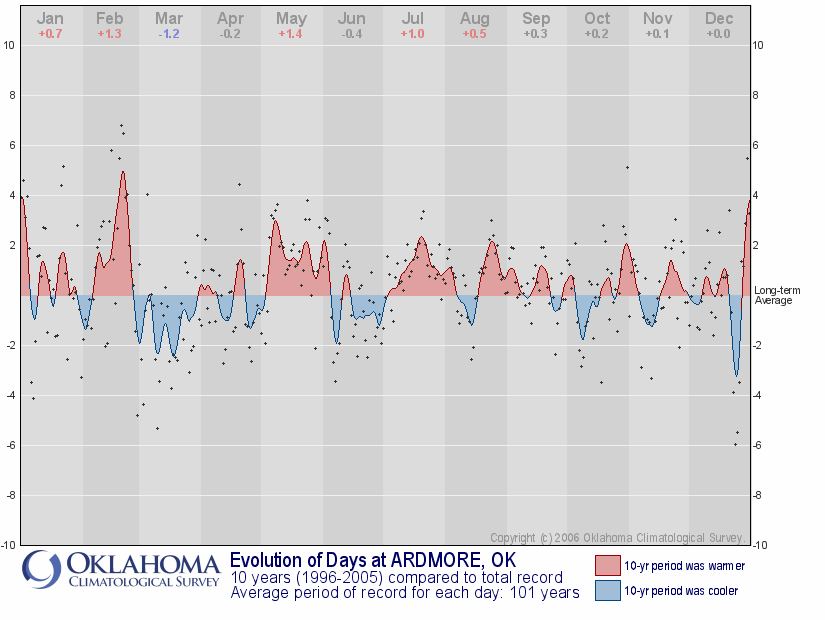
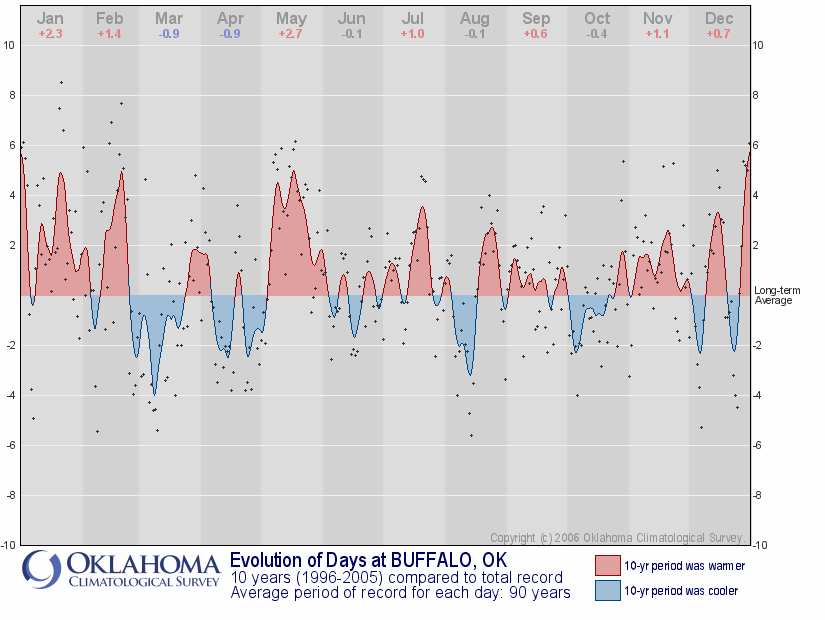
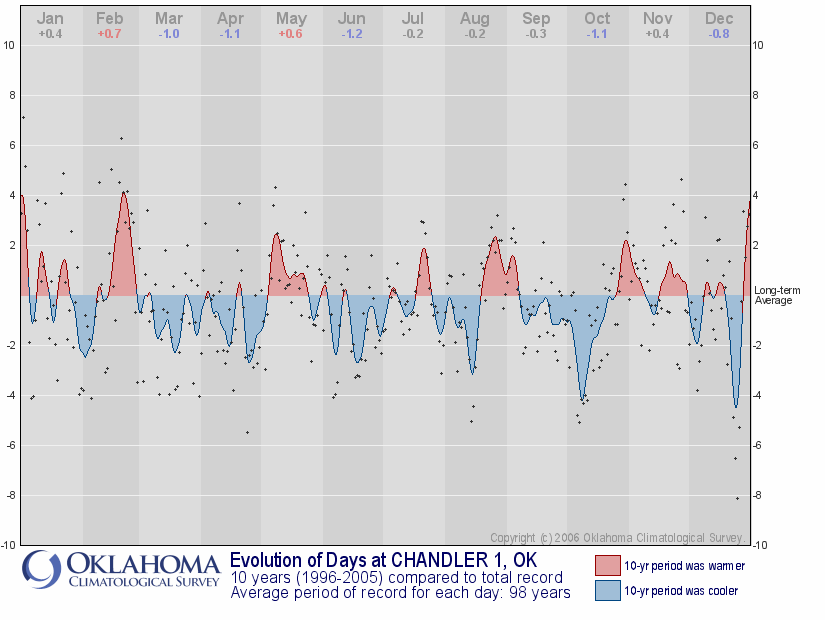
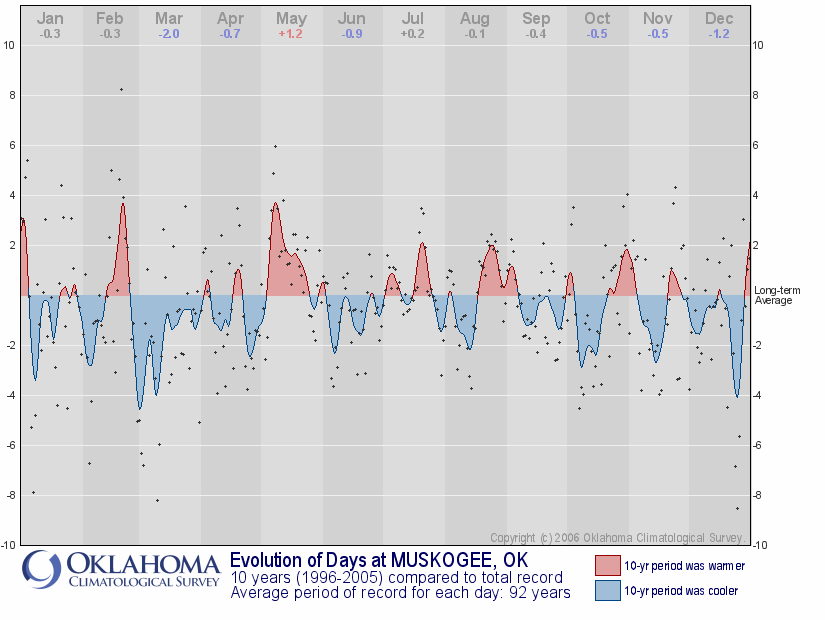
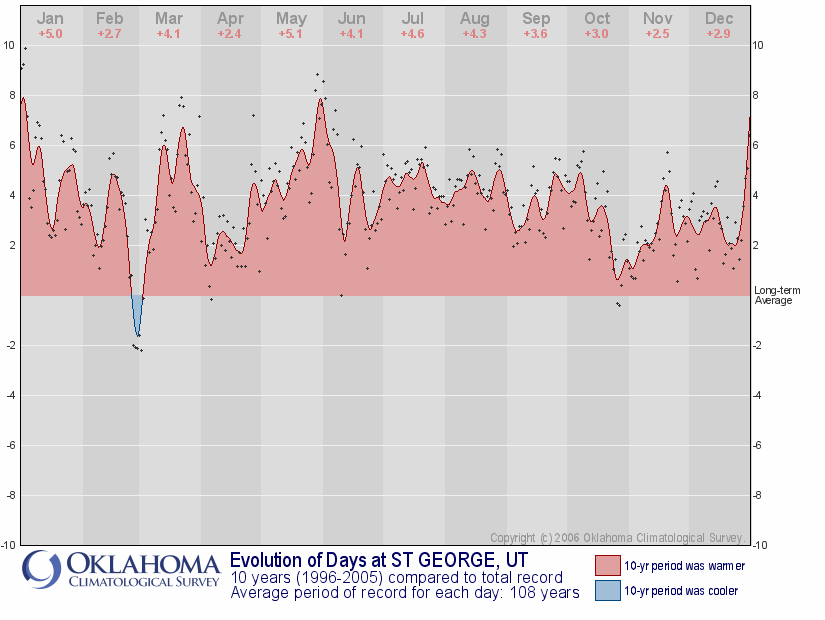
The following graphics are the change in average temperature for each
day on the calendar, laid out in a meteogram-ish time-series format.
Individiual dots show the change in individual days. Colored areas show
the same info, smoothed over a week-long period. Red areas show when
1996-2005 was warmer than the long-term average, and blue areas show
when it was cooler.
Anyway, a few things jump out consistently across the board:
* Early spring has defintely been cooler as of late.
* February, especially late February, has been much warmer.
* Mid-may and late-August warm bumps suggest the summer season
is longer (starts earlier, finishes later)
A few other things:
* Buffalo, in the west, has warmed more overall than the eastern
stations. This trend (west OK slightly warmer, east OK slightly
cooler) is fairly consistent among the 30-something Oklahoma
stations not shown in this Ticker.
* If all this change stresses you out, relax. You could be in
southern Utah:
July 26 in Mesonet History
| Record | Value | Station | Year |
|---|---|---|---|
| Maximum Temperature | 111°F | HOLL | 2011 |
| Minimum Temperature | 50°F | CAMA | 2004 |
| Maximum Rainfall | 5.09″ | BROK | 2013 |
Mesonet records begin in 1994.
Search by Date
If you're a bit off, don't worry, because just like horseshoes, “almost” counts on the Ticker website!