Ticker for March 3, 2003
MESONET TICKER ... MESONET TICKER ... MESONET TICKER ... MESONET TICKER ...
March 3, 2003 March 3, 2003 March 3, 2003 March 3, 2003
Metadata: Everybody's Favorite Data
In any science, one of the least available and most appreciated facets
of data is metadata, or data that describes the data. In climate
research, metadata can tell you all sorts of things about a network's
history and quality. For instance, take a look at the following
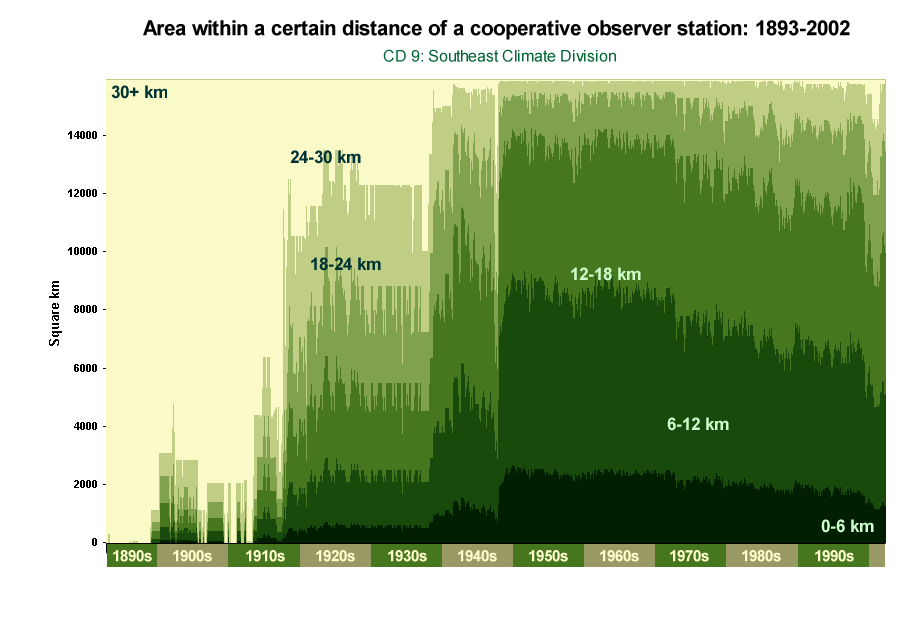
graphic, which shows the evolution of station coverage in Oklahoma's
Climate Division Five ("CD5", the Central Climate Division) since 1893:
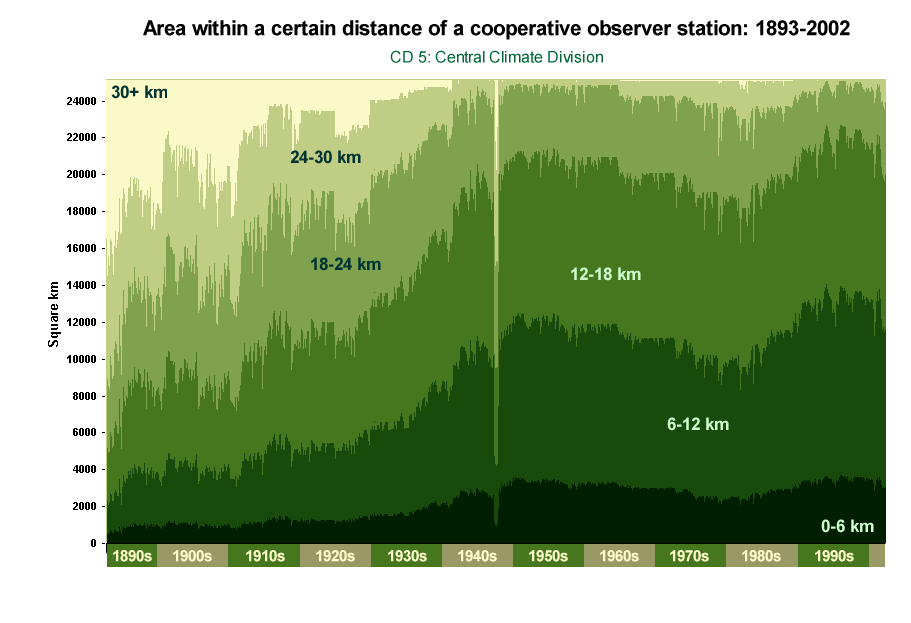
The bottom axis represents time, so as you march left-to-right, you
are traveling forward in time from 1893 to 2002. On the vertical axis
is area: specifically the areas of CD5 within certain distances of a
cooperative observer ("coop") station. For example, the darkest green
represents the area within 6 km of a coop station, and the light cream
color represents the area of CD5 that was more than 30 km from a coop
station.
Over the last century or so, the dark green area has expanded, while
the light cream area has decreased. This improvement in station
coverage represents two trends: the number of stations has increased,
and the spatial distribution of those stations has improved. In fact,
the latter is especially true for the last 50 years, because the number
of stations has actually decreased slightly since the mid-1950s.
By the way, the little notch in the middle of the graph represents
a chunk of missing data from late 1947.
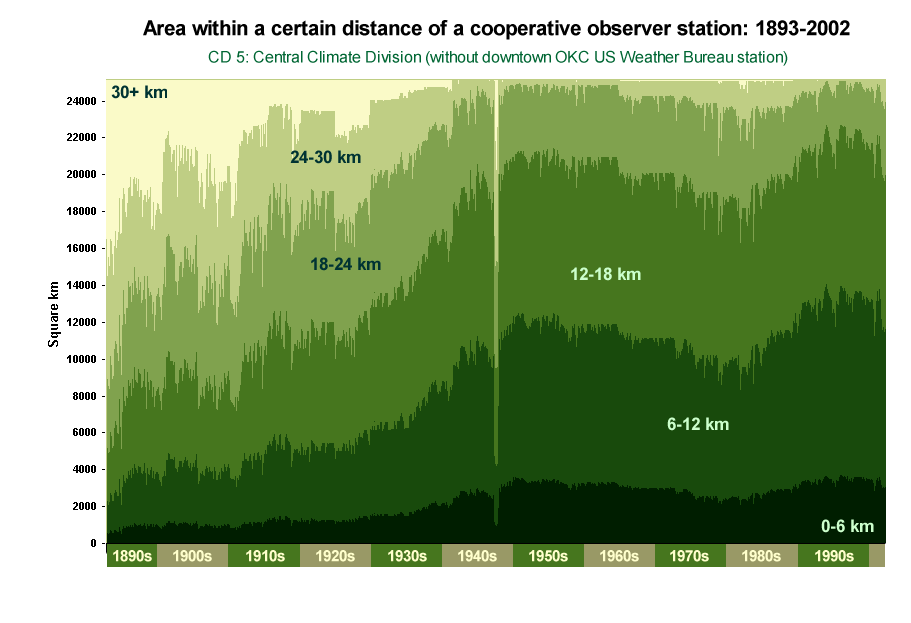
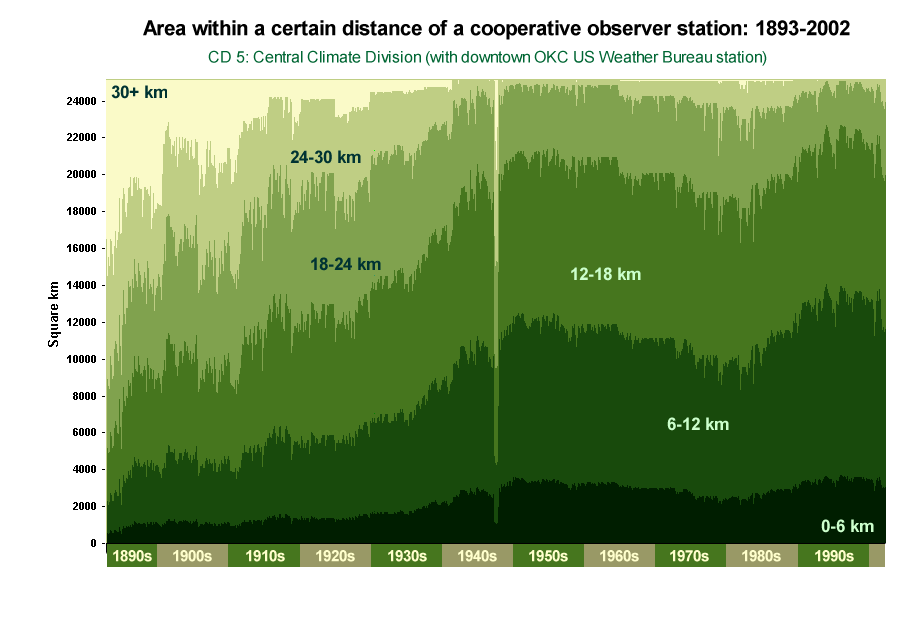
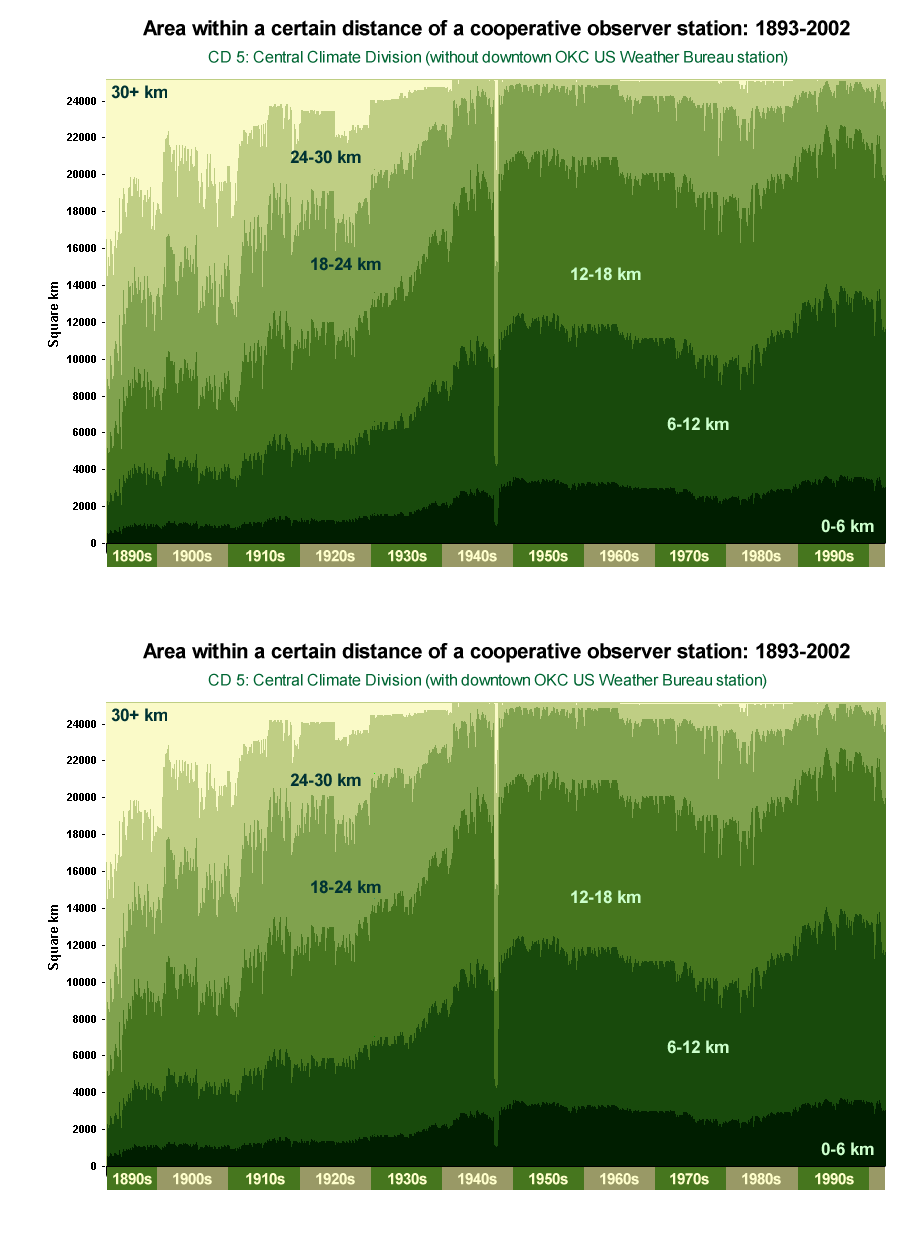
Next, check out how much difference a station can make. Recently,
the OCS Climate Information Group "rescued" some lost data from
the early 20th century at the downtown OKC Weather Bureau station.
This effectively filled a 50-year hole in Oklahoma County's climate
record. The "before and after" pictures show some improvement
in station coverage during the early century:
- or, for a simple animation:
So, why is all this metadata junk important? Because it lets you
know about your data set. Let's say you're making some very delicate
climate analyses using 120 years of CD5's average rainfall. Would you
feel comfortable with the station coverage in central Oklahoma back
in the late 1890s? That would probably depend on your study.
Say you wanted to apply the same study using CD-averaged rainfall
data from southeast Oklahoma. Would you feel comfortable with this?
March 3 in Mesonet History
| Record | Value | Station | Year |
|---|---|---|---|
| Maximum Temperature | 86°F | WAUR | 2024 |
| Minimum Temperature | -7°F | BUFF | 2014 |
| Maximum Rainfall | 3.93″ | PORT | 2004 |
Mesonet records begin in 1994.
Search by Date
If you're a bit off, don't worry, because just like horseshoes, “almost” counts on the Ticker website!