Ticker for January 23, 2002
MESONET TICKER ... MESONET TICKER ... MESONET TICKER ... MESONET TICKER ...
January 23, 2002   January 23, 2002   January 23, 2002   January 23, 2002


Severe Rainfall Deficit Continues in Western Oklahoma

Today's rainfall over some parts of southern and central Oklahoma is
certainly welcome, but parts of western and northwestern Oklahoma will
need much more than a half-inch or so to pull them out of a rainfall
deficit covering more than half a year.  Much of this area, including
the state's major winter wheat belt, is entering into its eighth
consecutive month of below-normal precipitation (see tables below).

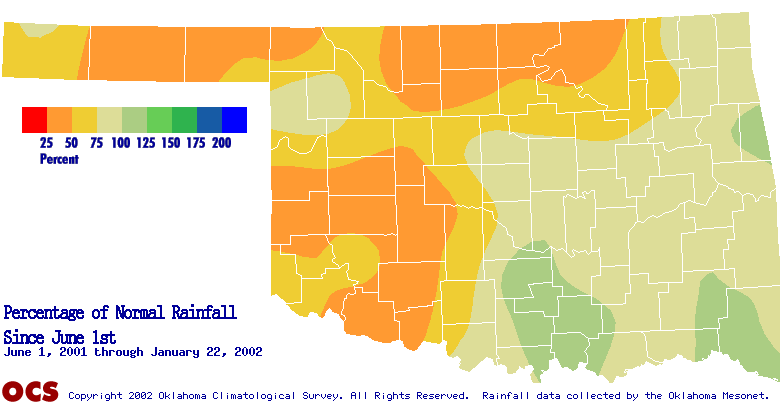
The following graphic shows the percentage of normal rainfall observed
since June 1, 2001.  Much of western Oklahoma has received less than
half of normal rainfall over the period:


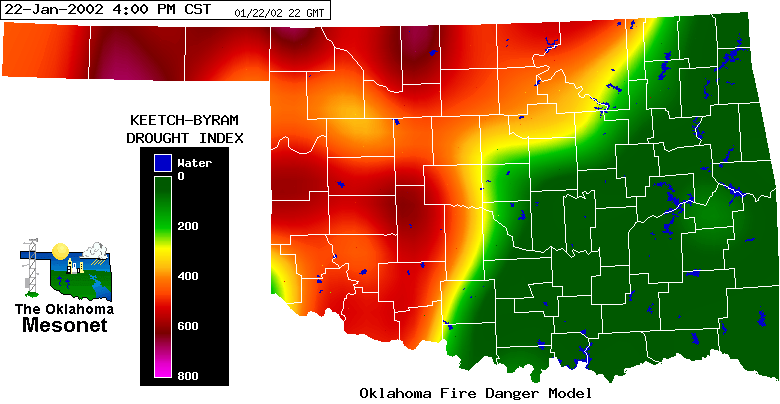
The Keetch-Byram Drought Index provides an estimate of moisture
conditions in the soil's top layer.  This KBDI map, derived from Oklahoma
Mesonet data, clearly shows the areas affected by lack of rainfall:


The summer onset, and autumn through winter continuance, of this event
presents a problem for winter wheat growers, who are already reporting
very stressed crops.  The statistics from the current event are similar
to the drought of 1995-96, but with an earlier onset.  In spring 1996,
the state's wheat yield was among the lowest in its history.  If the
current trend continues, livestock operations in western Oklahoma may
face deficient spring forage.  This also occurred in 1996.

Long-term (90-day) outlooks from NOAA's Climate Prediction Center (CPC)
are not optimistic for the region.  On their Jan. 18th Seasonal U.S.
Drought Outlook product, the CPC indicates that areas already affected
by drought in the Southern Plains are "Likely to Persist" into April.


TICKER TABLE: PERCENTAGE OF NORMAL RAINFALL SINCE GIVEN DATE
(through Jan 22, 2002)

Climate Div.    Since June 1    Since Aug 1    Since Oct 1
CD1: Panhandle           52%            50%            28%
CD2: N.Central           51%            55%            32%
CD4: W.Central           46%            52%            29%
CD7: Southwest           46%            61%            45%

TICKER TABLE: PERCENTAGE OF NORMAL RAINFALL FOR SPECIFIC MONTHS

Climate Div.      Jun   Jul   Aug   Sep   Oct   Nov   Dec   Jan (thru 22nd)
2001  2001  2001  2001  2001  2001  2001  2002
CD1: Panhandle    48%   66%   58%   73%    4%   58%   16%   59%
CD2: N.Central    62%   19%   71%   80%   19%   60%   20%   12%
CD4: W.Central    36%   29%   64%   80%   12%   66%   13%   20%
CD7: Southwest    15%   12%  121%   48%   18%  105%   34%   39%


Front Shows Up Nicely

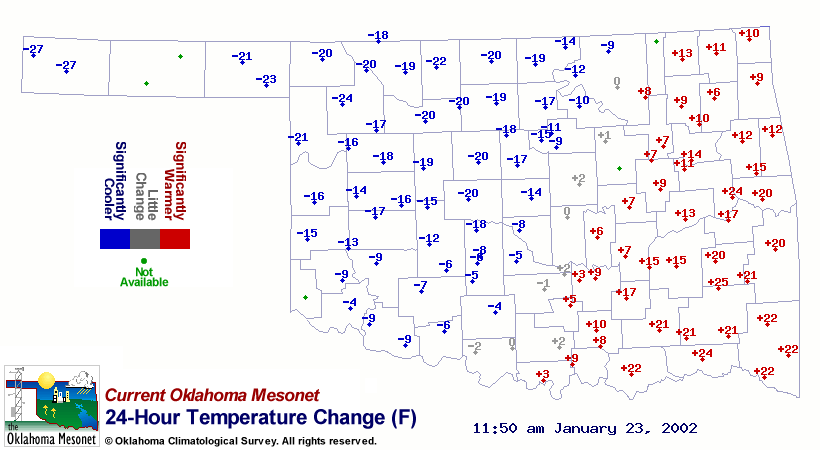
Today's front shows up very well in the Mesonet's "24-hour Temperature
Change" product:


The cooling behind the front is obvious, as is the strong southerly flow
(and warmth) ahead of it.  This product is updated every 15 minutes on
the Mesonet subscriber pages.
January 23 in Mesonet History
| Record | Value | Station | Year |
|---|---|---|---|
| Maximum Temperature | 78°F | WEBB | 2002 |
| Minimum Temperature | -3°F | HOOK | 2014 |
| Maximum Rainfall | 1.90″ | STIG | 2002 |
Mesonet records begin in 1994.
Search by Date
If you're a bit off, don't worry, because just like horseshoes, “almost” counts on the Ticker website!