MESONET TICKER ... MESONET TICKER ... MESONET TICKER ... MESONET TICKER ...
October 22, 2012 October 22, 2012 October 22, 2012 October 22, 2012
A O, AAAAAAAAAAAAAAAAAAAAA O... AO come and me wan' go home!
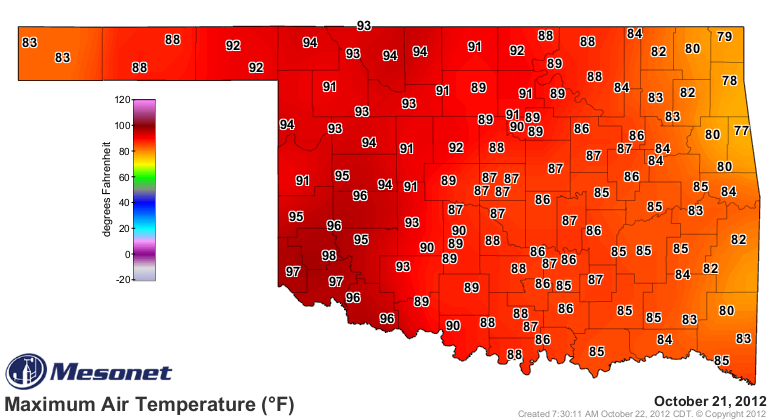
It's been so warm the last few days that even this cold-blooded Associate State
Climatologist finds it a bit ridiculous. Highs yesterday across western Oklahoma
were better suited for September than late October. Mangum topped the Mesonet
with 98 degrees for a high.
http://ticker.mesonet.org/archive/20121022/oct21-highs.png
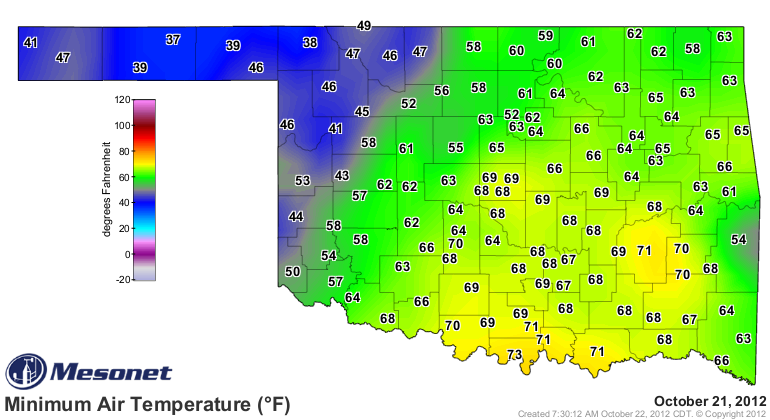
Heck, for most of the state, the low temperatures were right where the normal
highs should have been.
http://ticker.mesonet.org/archive/20121022/oct21-lows.png
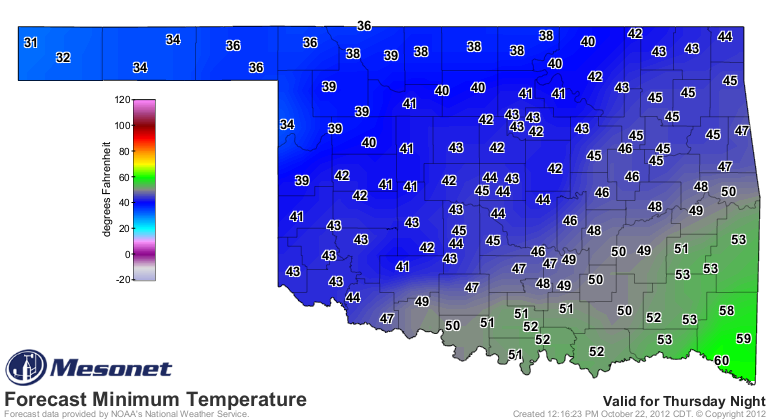
Alas, all good things must end, and cold weather is once again staring us in
the face starting on Thursday and through the weekend. Here are the NWS forecast
temps for Friday to set the chill in early for ya.
http://ticker.mesonet.org/archive/20121022/thursday-night-lows.png
http://ticker.mesonet.org/archive/20121022/friday-afternoon-highs.png
With the possible demise of El Nino, dead before it even really got started,
some other climate factors are starting to get talked about as the big players
for this winter, so I thought I would go over the biggie in the news recently,
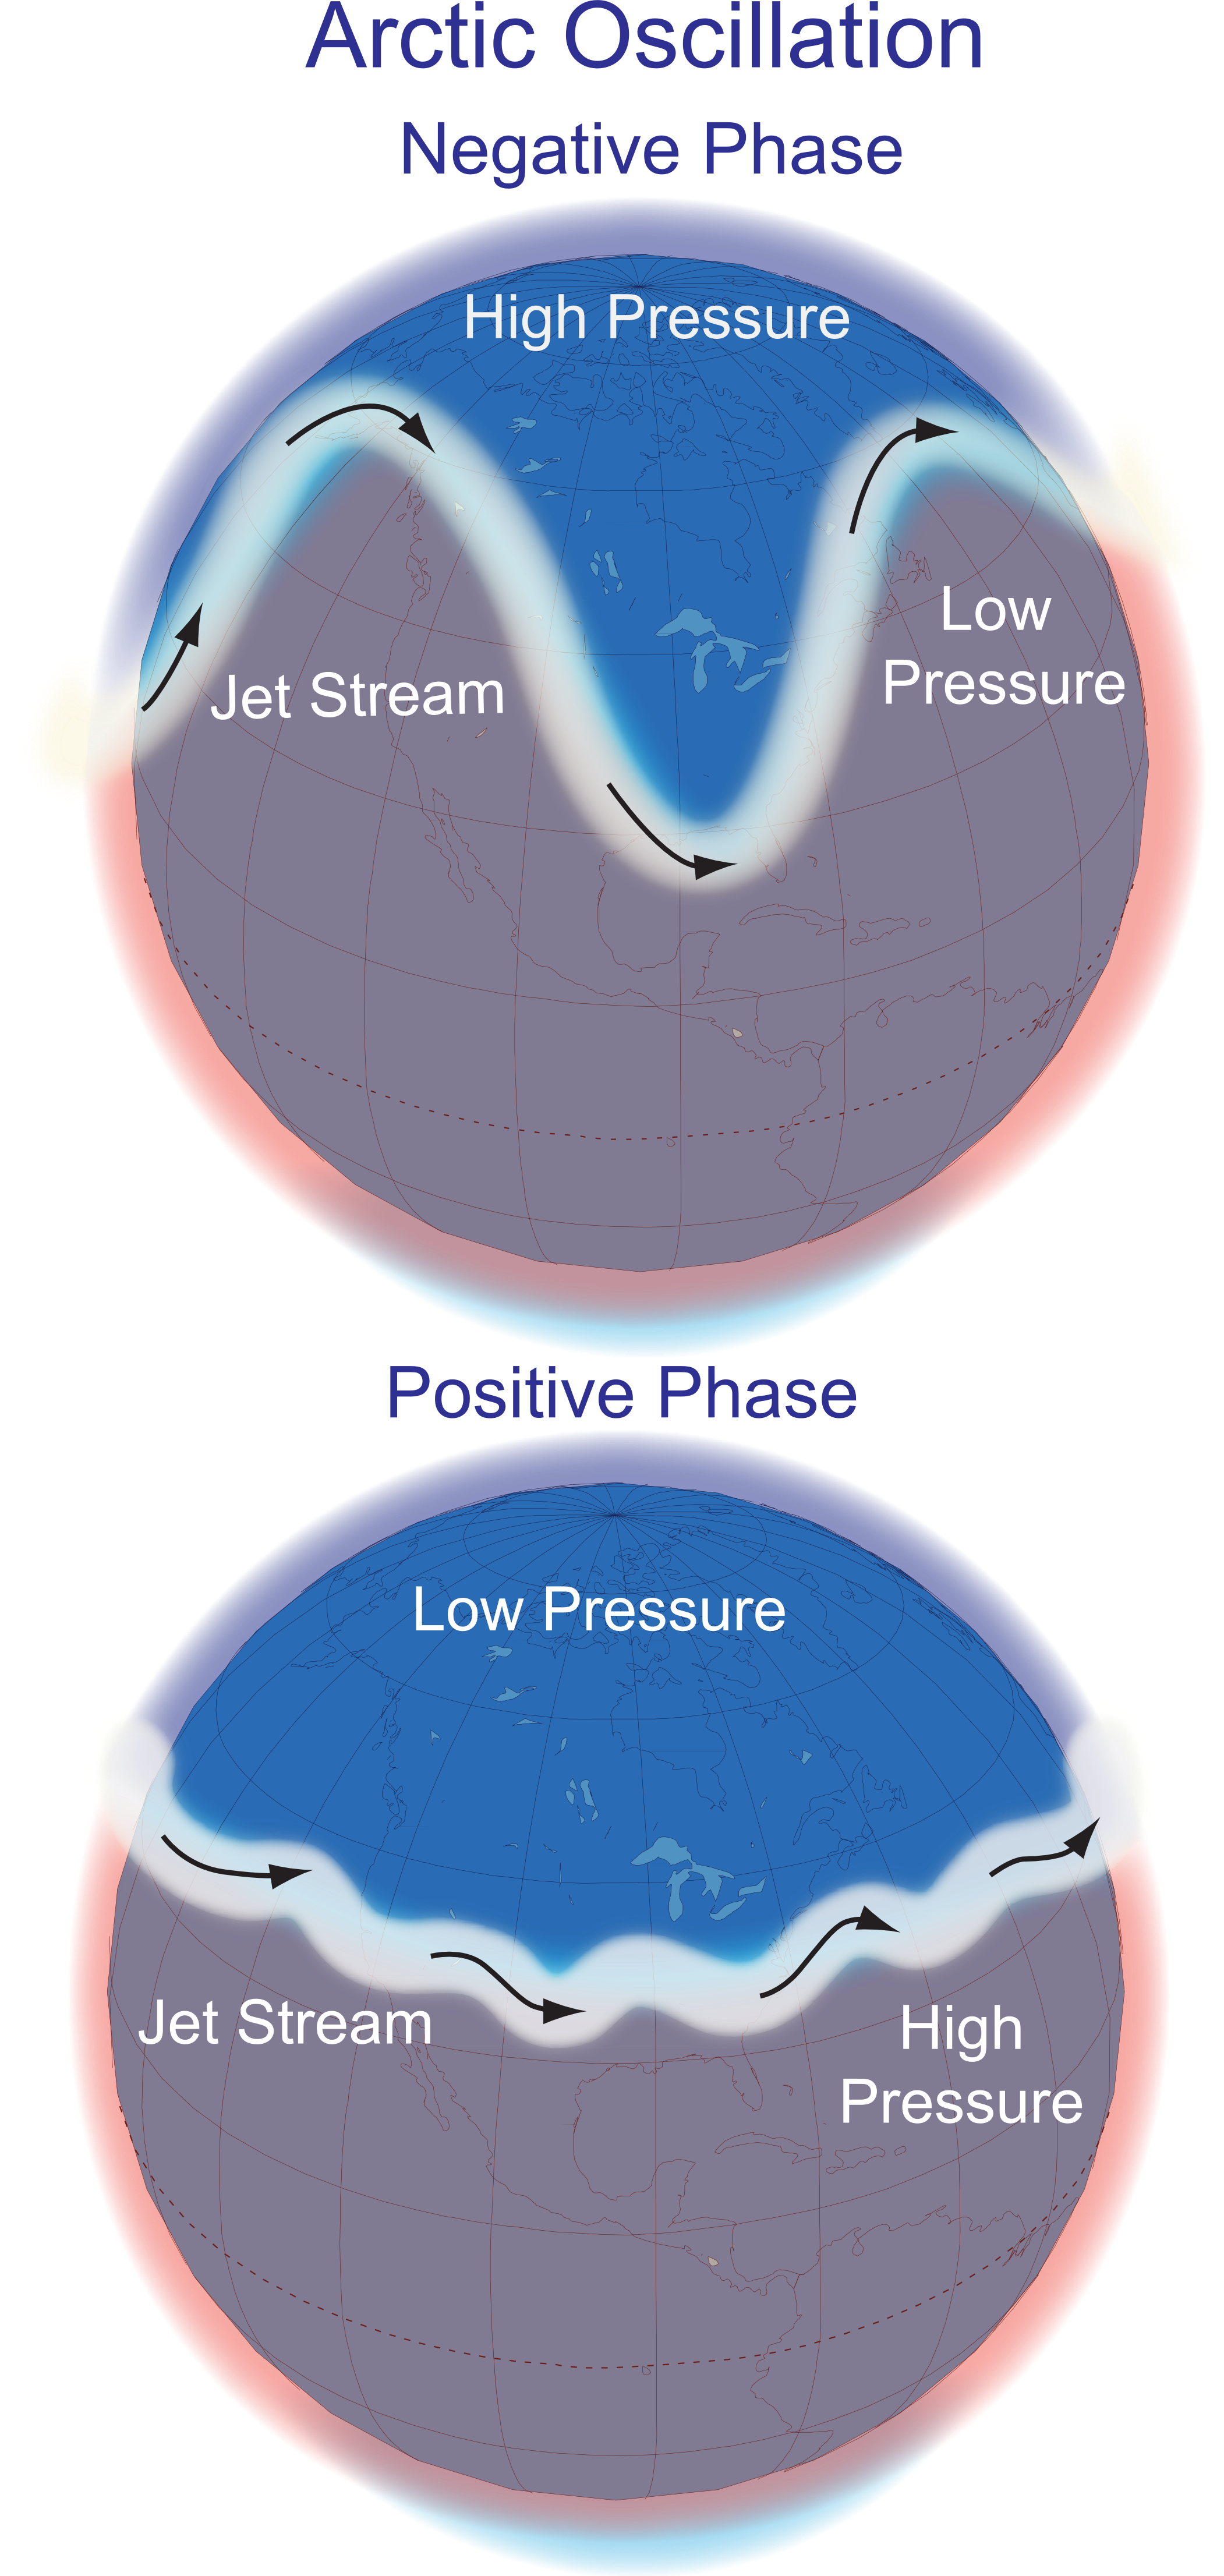
the Arctic Oscillation (AO). Our old friend the AOis acting all negative again,
which CAN lead to arctic air plunging into the eastern half of the U.S.,
including the Plains states. The AO index is a measure of sea level pressure
differences between the arctic and the mid-latitudes. Now this is going to get
a bit sticky, but here goes.
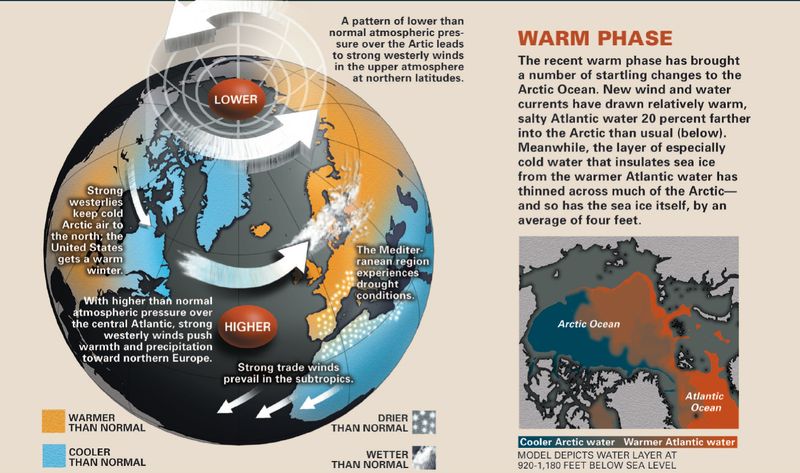
When the AO is in positive phase, low pressure over the arctic and high pressure
over the mid-latitudes act to increase the strength of the mid-latitude jet
stream, and keeps it blowing predominantly from west to east. In essence, this
helps trap the cold air in the polar region and more mild winter weather in the
U.S. can result. Europe can be cold and snowy during this type of weather
pattern. This is largely what occurred last winter, with the AO being mostly
positive (or weakly negative) for most of the winter.
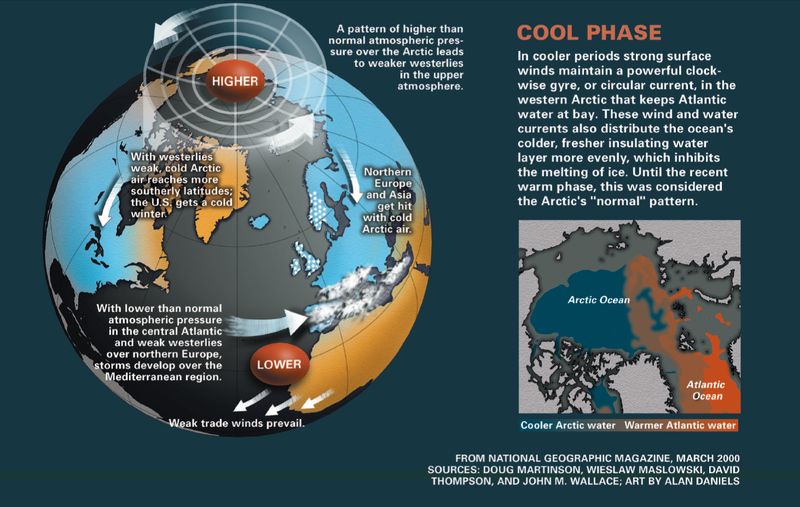
On the other side of the oscillation, the negative phase occurs with higher
pressure over the arctic and weaker or more normal pressure in the mid-latitudes.
This helps to weaken the mid-latitude jet and allow for some pretty substantial
dips to the south from time to time. Within those dips, you get a full blast of
air from the polar regions. The AO was in negative phase for the winters of
2009-10 and 2010-11. During the winter of 2009-10, it was more negative than it
had been during the last 50 years. Some climate researchers believe the negative
phase of the AO combined with El Nino to produce a cold, snowy season that year
for much of the South (including Oklahoma) and the East Coast (remember the
Snowmageddon storm that buried the Northeast back in December 2009?).
Here are a couple of graphical renderings from our friends at NOAA and
National Geographic that can better sum up what I've clumsily tried to explain.
NCDC
http://ticker.mesonet.org/archive/20121022/NCDC_Arctic_Oscillation.png
National Geographic
http://ticker.mesonet.org/archive/20121022/nat-geographic-netagive-phase.jpg
http://ticker.mesonet.org/archive/20121022/nat-geographic-positive-phase.jpg
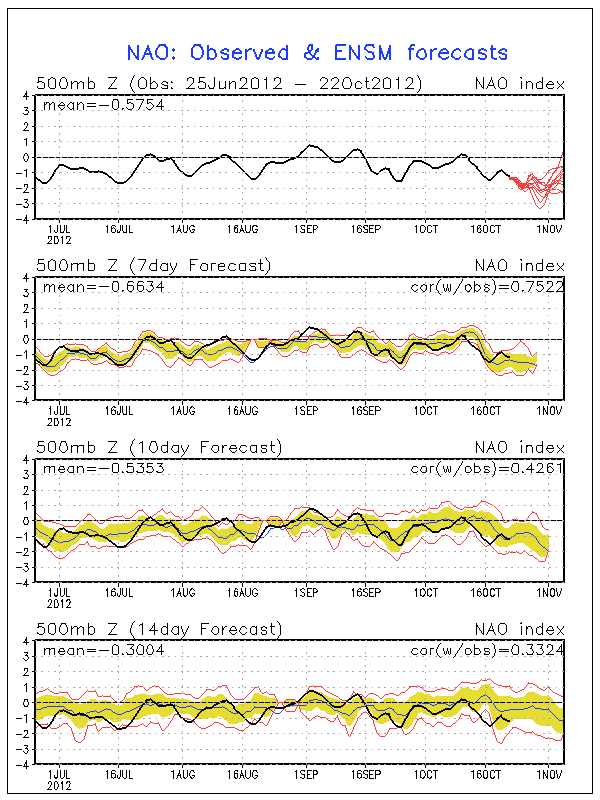
Now the AO is closely related to the North Atlantic Oscillation (NAO), which
some would say is a regional version of the AO. The NAO is also a measure of
the pressure differences between the same areas in the North Atlantic, with
similar results.
I like to think of it like this, since it can be rather confusing: the AO is
the large-scale pattern that makes the cold polar air available, and the NAO
is the smaller-scale blocking pattern that helps funnel the cold air into
the eastern half of the country by causing that big "dip" we talked about
earlier to form across the eastern U.S. So when the AO and NAO are both strongly
negative and work in unison, cold weather can be the result.
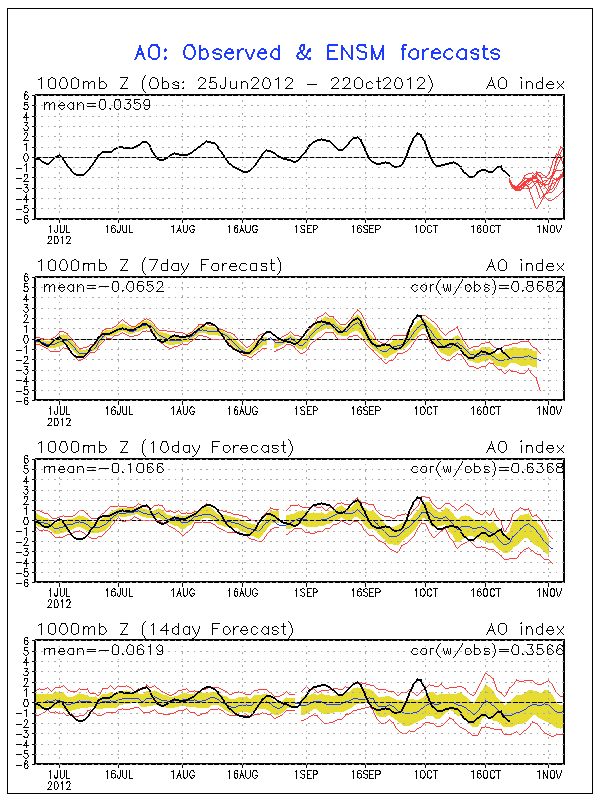
Annnnnnd, as it so happens, that's exactly the type of pattern we see setting
up with both indices plunging into negative territory over the next week. Here
are the forecasts for the AO and NAO for the next week or so. Pay attention
to the top graph in each figure. These "spaghetti plots" show the different
model solutions for the index for the next couple of weeks. Also notice how
the plot gets a bit wild the farther out you go. Unfortunately, these are
phenomena that are very difficult to predict out much farther than that, as the
solutions get chaotic.
http://ticker.mesonet.org/archive/20121022/ao.gif
http://ticker.mesonet.org/archive/20121022/nao.gif
Now we have to be careful when we start blindly saying "this is because of that"
and "that was caused by this." But, a lot of research is continuing to find
links between climate patterns like this and regional weather. The difficulty
in forecasting these types of patterns out past a couple of weeks also
underlines the difficulty forecasters have in predicting seasonal temperature
and precipitation patterns.
Now after all of that, let's remember we can't do anything about any of it!
Back to the banana boats.
Gary McManus
Associate State Climatologist
Oklahoma Climatological Survey
(405) 325-2253
gmcmanus@mesonet.org
==================================================
The OCS/Mesonet Ticker
https://ticker.mesonet.org/
To subscribe or unsubscribe from the Ticker
or for questions about the Ticker or its content
Phone or Email the Ticker Manager at OCS
Phone: 405-325-2253 Email: ticker@mesonet.org
---------------------------------------------------
-C- Copyright 2024 Oklahoma Climatological Survey
===================================================
|


 Tweet
Tweet