MESONET TICKER ... MESONET TICKER ... MESONET TICKER ... MESONET TICKER ...
August 19, 2010 August 19, 2010 August 19, 2010 August 19, 2010
58 Has Never Looked Better
Okay, I'm going to show you a high temperature map for about the 100th time this
summer. Wait, let's see, three months of summer, 30 or 31 days hath June...oh,
you know what I meant!
http://ticker.mesonet.org/archive/20100819/today.hilo.gif
And of course, we're back in the 100s at a few spots. With the upper-level ridge
of doom coming back this weekend, we're sure to see those 100s spread again. But
wait, what I really wanted to show you on that map are the LOW temperatures,
specifically those in northeastern Oklahoma. Notice the 58-degree reading at
Oilton? That's only the second reading below 60 degrees in Oklahoma during August
thus far. The first one was at Kenton but it cheats by being at a higher
elevation.
So take heart, if you are tired of baking, it will eventually end. I have proof
of that with my next figure. Forget that you remember it getting cooler every
fall. Any climatologist worth his salt will tell ya memories aren't real unless
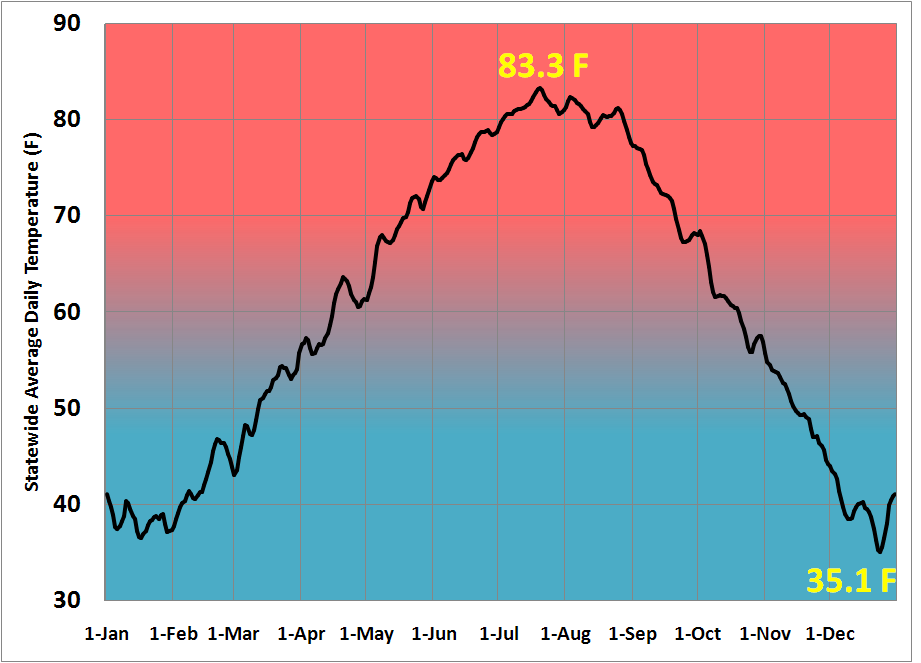
it's backed up by data. This figure shows the statewide average daily temperature
(24-hour average) from the Mesonet for the period 1994-2009, as put together by
OCS research scientist Brad Illston.
http://ticker.mesonet.org/archive/20100819/daily_average_temperature.png
Now obviously this is a display of the seasonal variations in temperature, and
we're nearly to that first big drop-off point in late August when our average
temperatures really start to decline in earnest. That point, at least when
averaged over 1994-2009, has been August 26. That comes after our maximum of
83.3 degrees on July 20, finally reaching the minimum of 35.1 degrees (BOOO!!!) on
December 24. From August 25 to September 25, the average temperature drops from
81.2 degrees to 67.3 degrees.
Now remember, that's averaged over 16 years. Contained within that average is
a whole bunch of craziness known as Oklahoma weather! But now that I've backed
up the seasonal change with actual data, sit back and enjoy the ride.
Trust me, it happens every year.
Gary McManus
Associate State Climatologist
Oklahoma Climatological Survey
(405) 325-2253
==================================================
The OCS/Mesonet Ticker
https://ticker.mesonet.org/
To subscribe or unsubscribe from the Ticker
or for questions about the Ticker or its content
Phone or Email the Ticker Manager at OCS
Phone: 405-325-2253 Email: ticker@mesonet.org
---------------------------------------------------
-C- Copyright 2024 Oklahoma Climatological Survey
===================================================
|


 Tweet
Tweet