Ticker for January 16, 2014
MESONET TICKER ... MESONET TICKER ... MESONET TICKER ... MESONET TICKER ...
January 16, 2014 January 16, 2014 January 16, 2014 January 16, 2014
Dry conditions spread east in Oklahoma
We've shown you evidence of continued drought across western Oklahoma the last
couple of days. You know, fun stuff like Dust Bowl style dust storms and dry farm
ponds. Well, the dry weather is really starting to catch up to parts of central
and eastern Oklahoma as well. The truth is the amount of actual drought (D1-D4) is
the same as last week on the newest U.S. Drought Monitor report, but we are seeing
that "Abnormally Dry" (D0) yellow color spread to the east, where it now covers
Oklahoma City up through Tulsa.
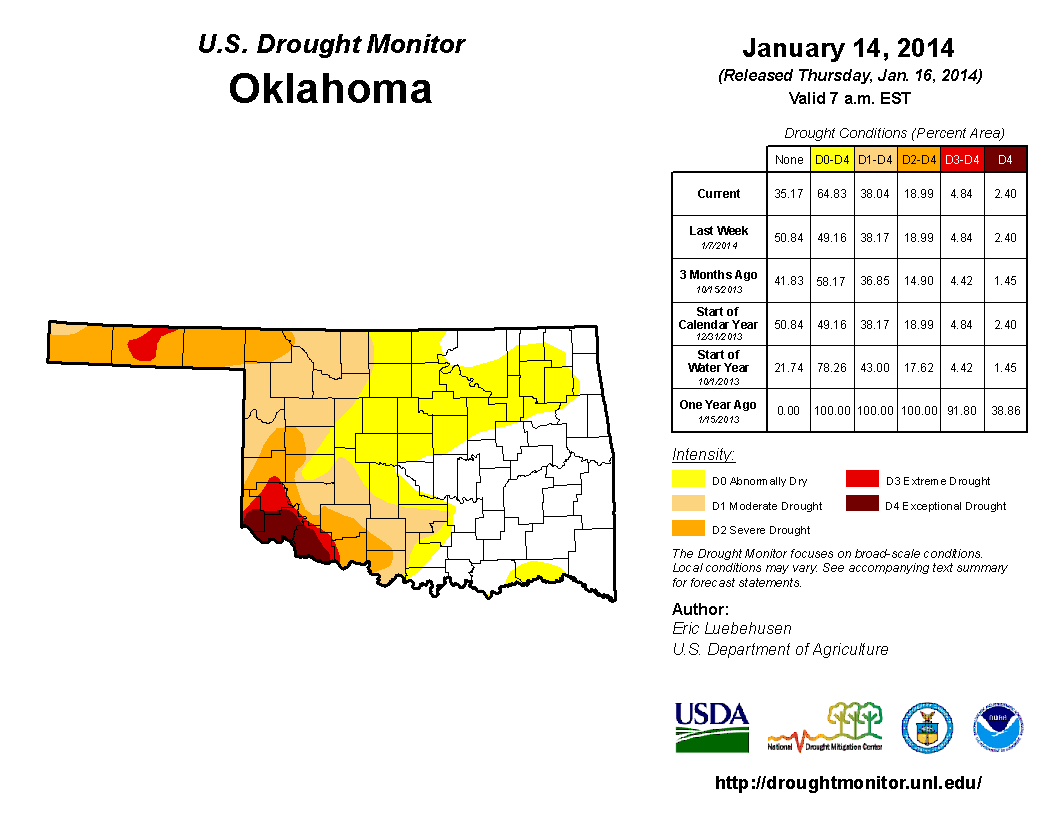
Oklahoma still has 38 percent of the state in at least moderate (D1-D4) drought
(and only 19 percent in at least severe drought), but their percentage of at least
Abnormally Dry (D0-D4) went from 49 percent to 65 percent.
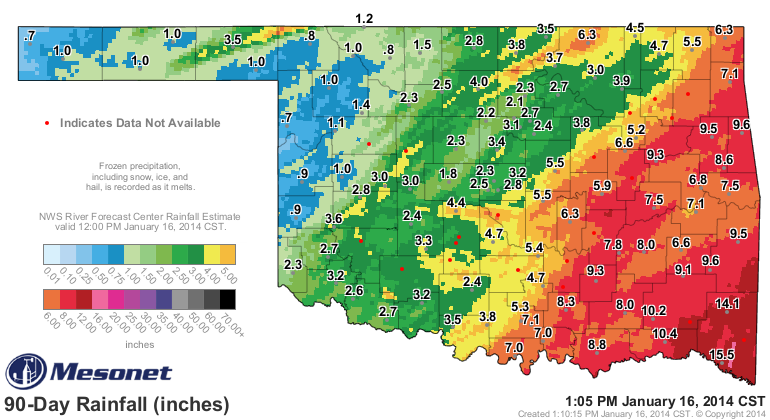
The reasons are obvious ? it has gotten dry as heck out there in the last 90 days
or so (and frankly, the deficits go back even farther than that). There were
the rainstorms in early August and even during September, and the rain and snow
during November and December, but for a large part of the I-44 corridor to the
northwest, a whole lot of cold, dreary nothing.
Those greens and yellers look pretty good until you look at the percent of
normal map to see how they stack up against average.
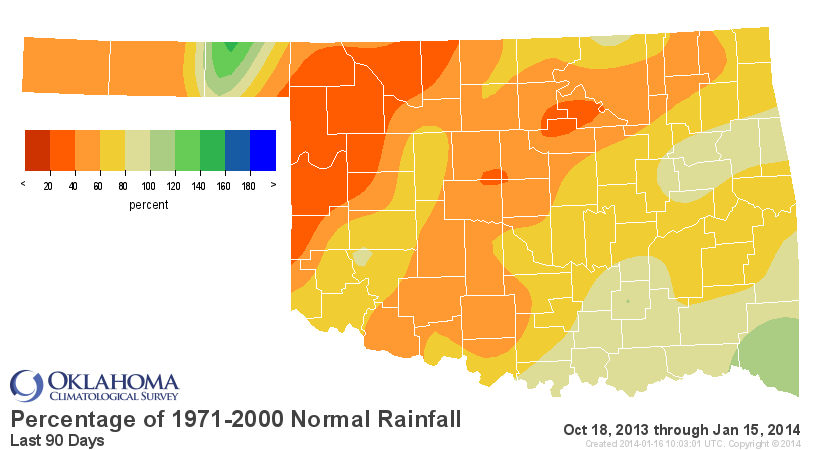
So the greens and yellers ain't that great. We're not talking vegetables here!
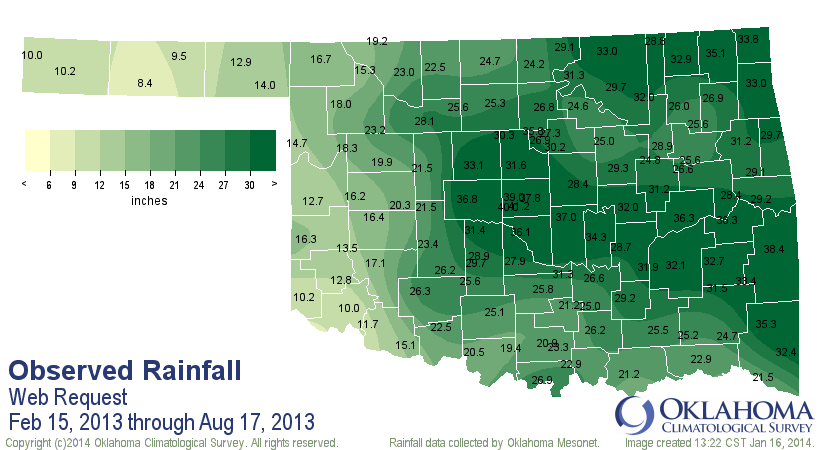
And I like to trace the real dry-down even farther back to the odd date of
August 17th. That's when our rainy summer turned into dry summer and the
deficits that were whittled down from mid-February through that period started
to build again. So we basically have two different periods with different
fortunes:
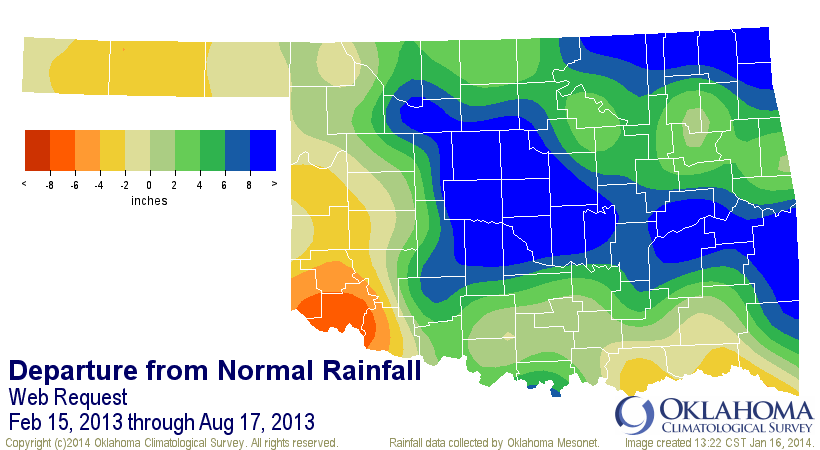
1. The February 15-August 17 period which saw us go from our warm, dry pattern
of the previous couple of years to a cool, wet pattern.
2. The August 18-forward period which saw drought make a comeback, get beaten
back again in the east, now starting to creep back east.
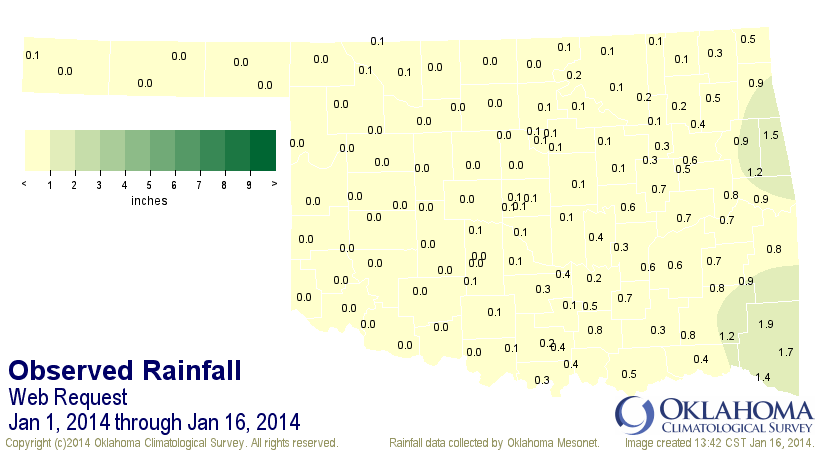
Check out the rainfall maps for yourself. They're quite striking.
Feb. 15-Aug. 17 (24.6" statewide avg, +3.7" above nrml, 12th wettest since 1921)
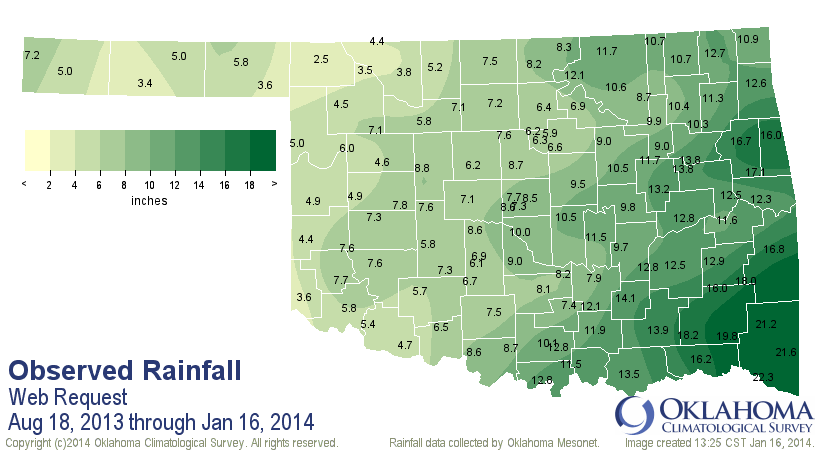
Aug. 18-Jan. 16 (9.2" statewide avg, -4.8" below nrml, 22nd driest since 1921)
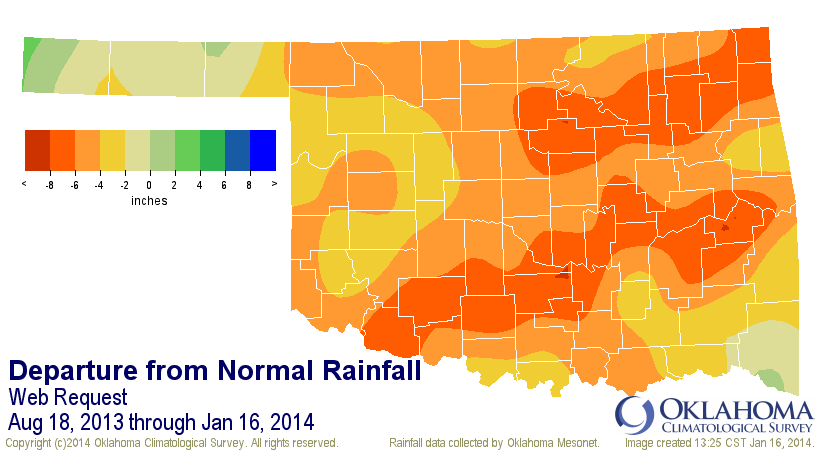
So it's easy to see why that D0 made a sudden jump up to the northeast when you
combine the rainfall deficits of the past 5 months with even more dry weather
over the past 1-3 months. Even in the cool season, it can have an effect,
especially when we've been so windy and warm lately (with lots of fire danger
to go along with it).
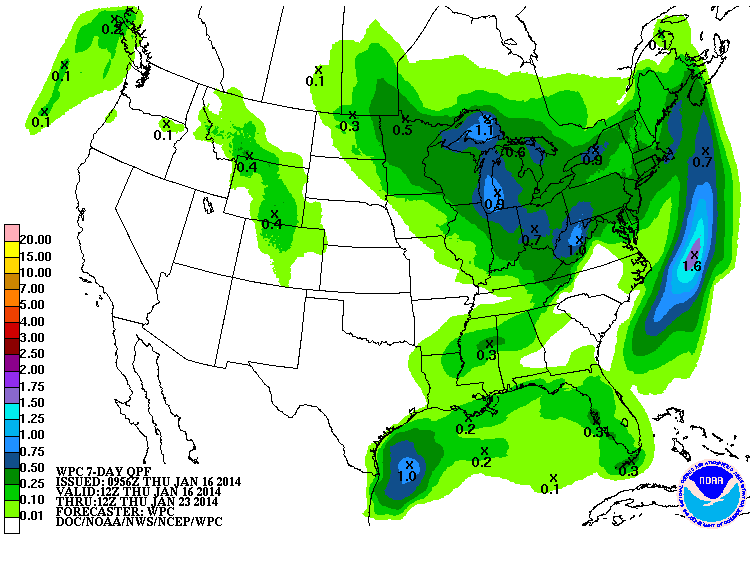
What's coming up next? A whole lotta nothing except for lots of dry weather and
occasional cold fronts that kick up the fire danger. That's what it looks like
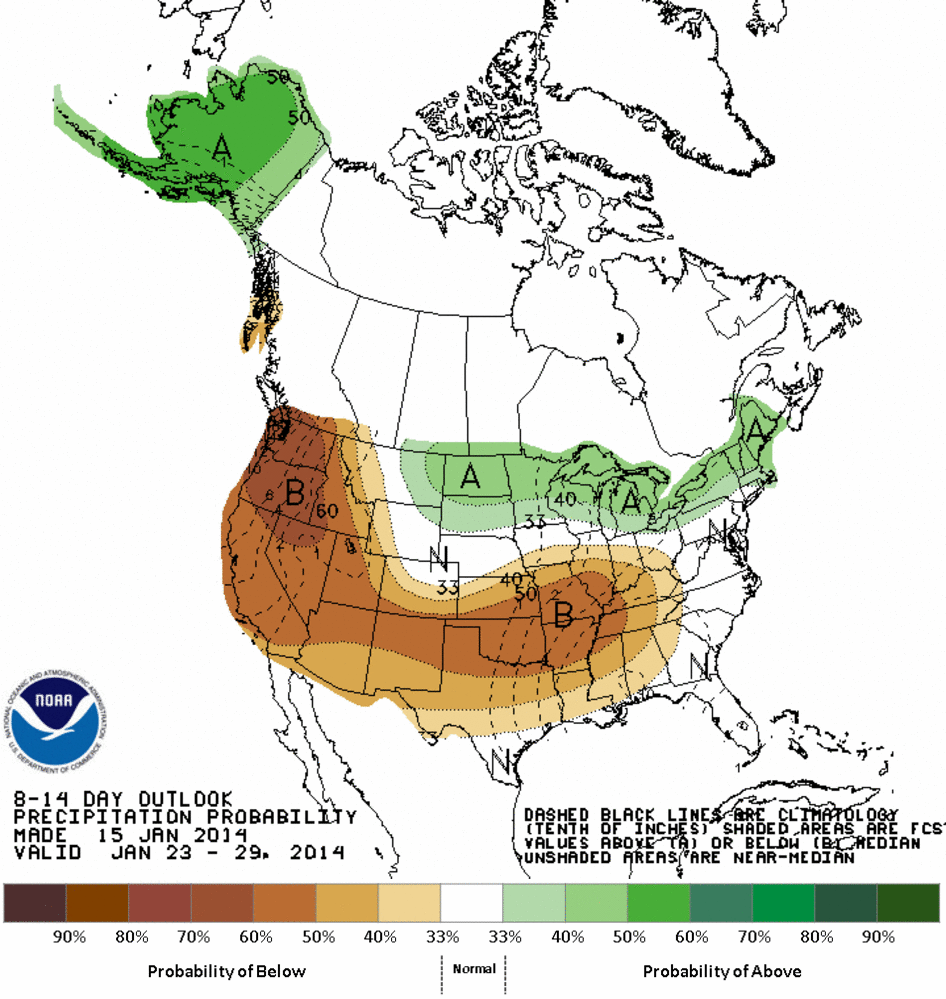
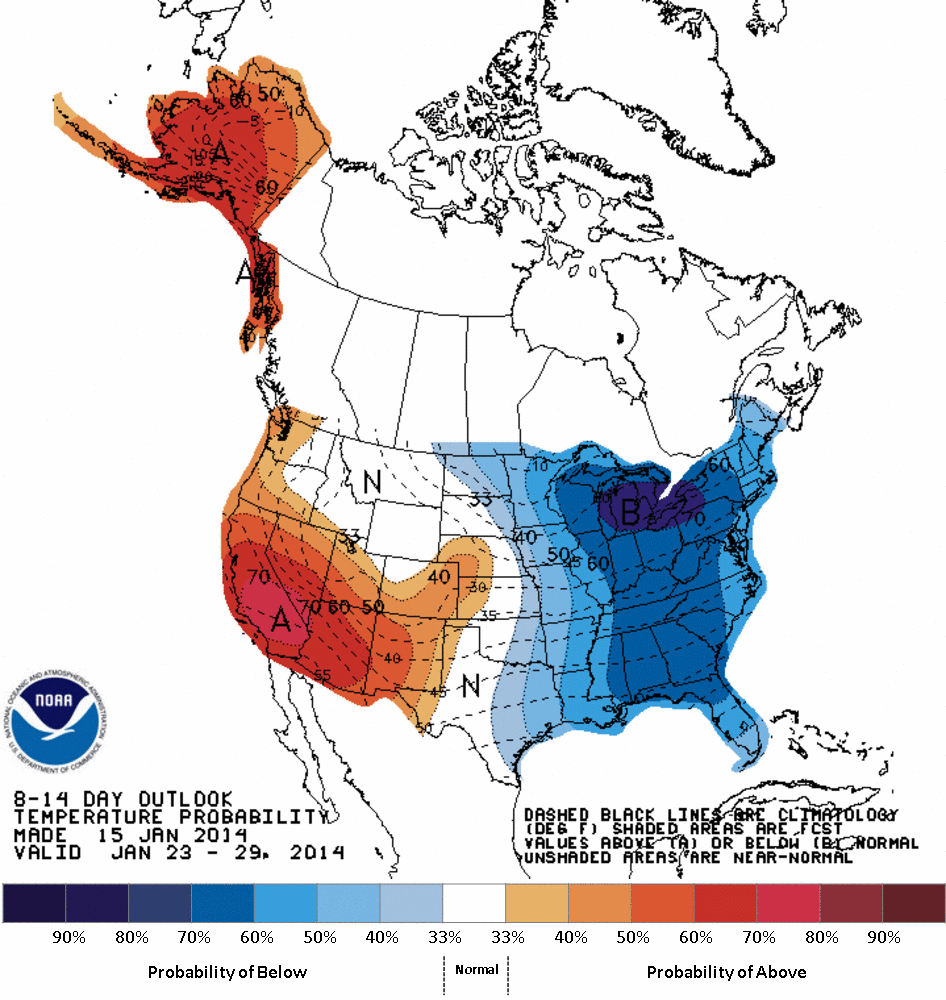
at least through the rest of January. Here's the 7-day precip forecast, and
also the 8-14 day outlooks from CPC. Notice the 8-14 day outlooks are probability
maps, and basically show increased odds of below normal precip and a mixed back
for temperatures.
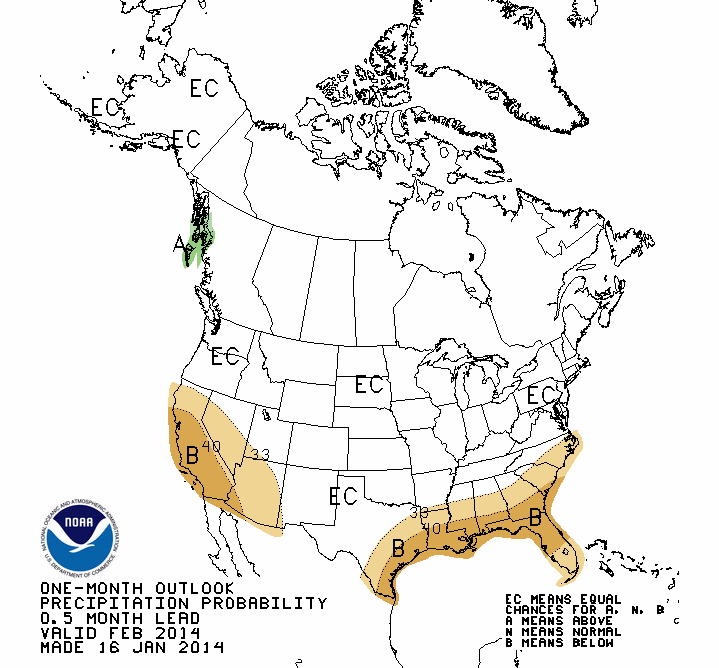
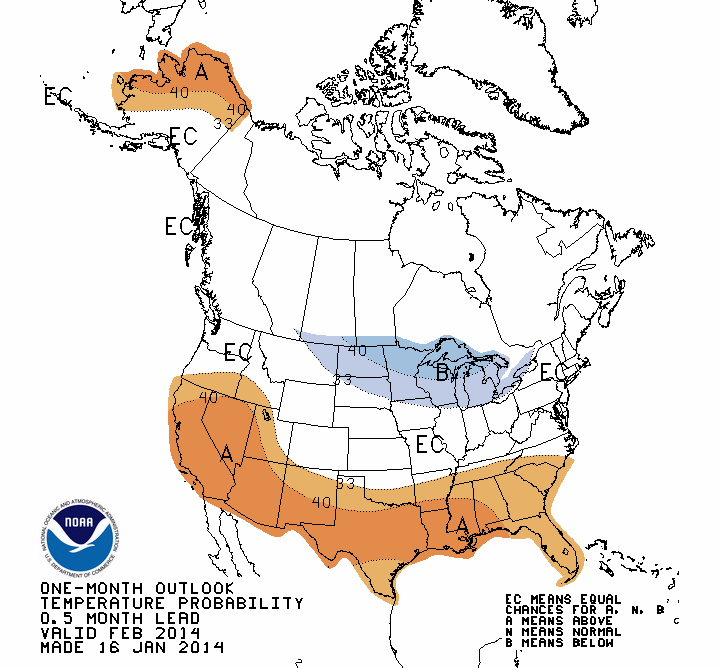
We also have new monthly and seasonal outlooks from CPC today, so here are the
temp and moisture outlooks for February and also the February-April 3-month
period. Again, these are probability maps.
CPC February Outlooks
CPC February-April Outlooks
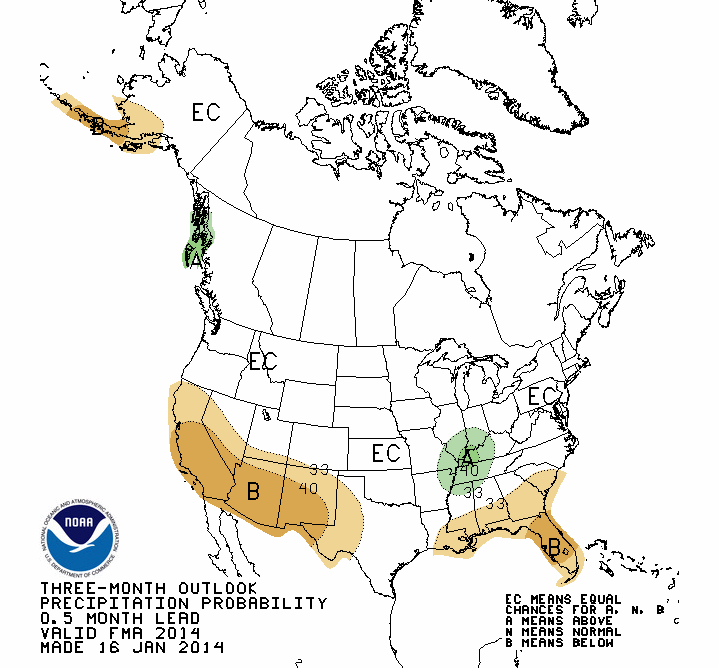
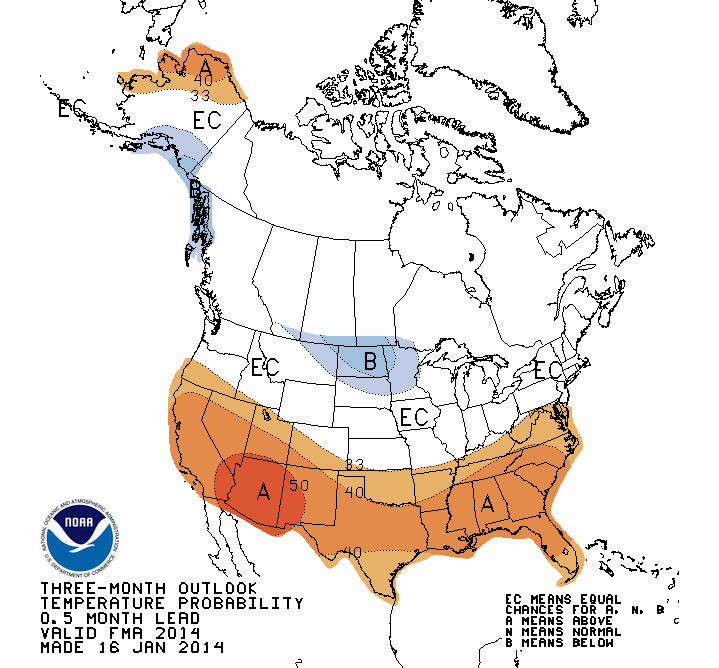
The only real climate signals we see in those are increased odds of above
normal temperatures across the southern half of the state in February, and
across the entire state for the February-April period. The precip outlooks give
us the old "Equal Chances" EC mark, which means they don't have enough evidence
to tip the scales in any direction (INCLUDING NORMAL!! THESE DO NOT INDICATE
INCREASED ODDS OF NORMAL PRECIPITATION AMOUNTS!!).
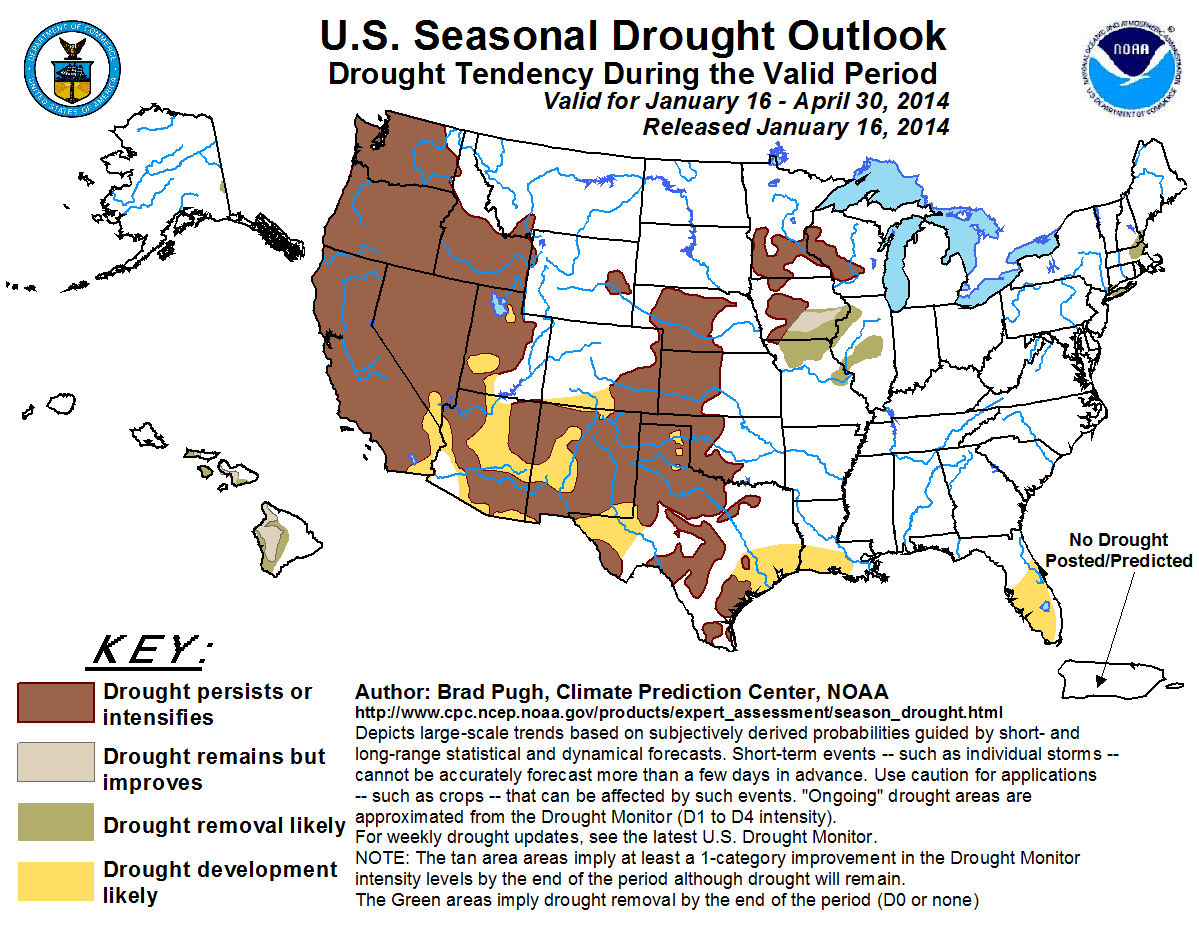
Now, combine those with were we see drought now, and what does CPC expect the
drought situation to look like at the end of April? Well, without any evidence
of dry weather over the next three months, they see drought where there is
already drought,and no drought where there is no drought. At least at the end
of April. Bad news for the west (and the little farm pond, and Lake Tom Steed
and folks wanting to drink water in Altus, etc.) and good news for the east,
I reckon. However, the forecaster for this product did deem the forecast
confidence for the depiction in the Southern Plains as "low." So I guess that
would be bad for the east and good for the west??
If we go moisture-less for the rest of January, we'll finish with about 0.28"
on average across the state, which would make this the 7th driest January on
record, back to 1895. Not good. But better than the 7th driest March, April,
May, June, July, August, September or October. January is normally the driest
month of the year, after all.
Gary McManus
State Climatologist
Oklahoma Climatological Survey
(405) 325-2253
gmcmanus@mesonet.org
January 16 in Mesonet History
| Record | Value | Station | Year |
|---|---|---|---|
| Maximum Temperature | 79°F | MANG | 2012 |
| Minimum Temperature | -15°F | VINI | 2024 |
| Maximum Rainfall | 2.43″ | ALTU | 2004 |
Mesonet records begin in 1994.
Search by Date
If you're a bit off, don't worry, because just like horseshoes, “almost” counts on the Ticker website!