MESONET TICKER ... MESONET TICKER ... MESONET TICKER ... MESONET TICKER ...
August 10, 2012 August 10, 2012 August 10, 2012 August 10, 2012
Potpourri
It got downright chilly in the northwest this morning. So as you gaze at this
morning's low temperature map from the Mesonet, go ahead and get your sweaters
out and get your tailgate stuff ready for the big game today. Then put it all
back up because it will make you feel pretty silly when it's 100 out in a few
days. August is where dreams go to die, or so I've been told. But as longtime
TV meteorologist Fred Norman used to say: "A preview of coming attractions!"
Fall is just around the corner. I've thrown up the record lows for this morning
as well. They got pretty close to setting records out there in the Panhandle!
http://ticker.mesonet.org/archive/20120810/today.record-tmin.png
http://ticker.mesonet.org/archive/20120810/today.tmins.png
The 55s at Goodwell and Hooker are the coolest readings measured by the Mesonet
since June 13 when Kenton hit 55 degrees. Alva and Hooker hit 54 degrees the day
previous to that. It's not that much of a shock to the system, however. Boise
City hit 57 on Aug. 5, and Nowata hit 59 on Aug. 6.
*********************************************************************************
What happened to the kaboom??
And by "kaboom" I mean our green 2012? Yeah, that didn't even make sense, but I
rarely do. You want to try and write about Oklahoma weather and make sense??
I thought so.
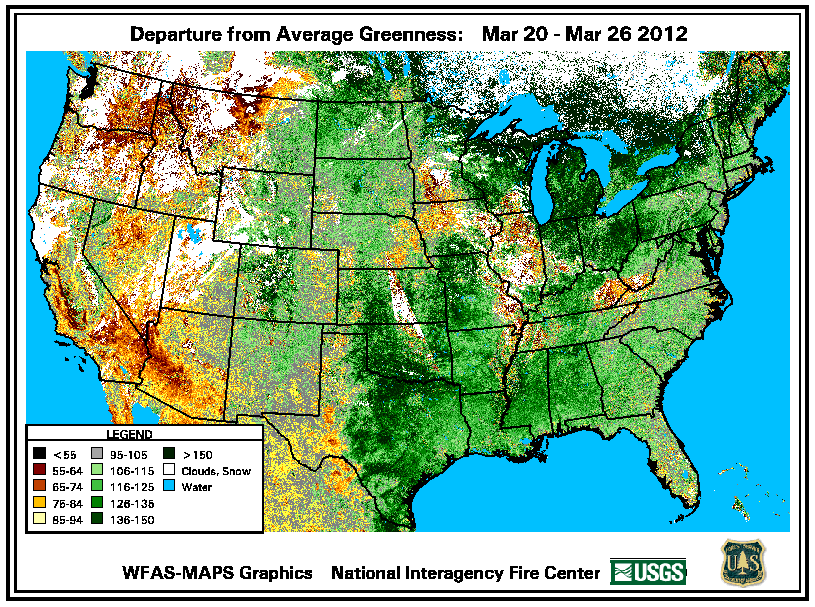
Anyway, check out the departure from average greenness maps from February and
March. Much-written about, but still remarkable how the early moisture and
warmth this year accelerated our vegetation this year.
Feb 14-20: http://ticker.mesonet.org/archive/20120228/DA.png
March 20-26: http://ticker.mesonet.org/archive/20120329/greenness-dep-norm.png
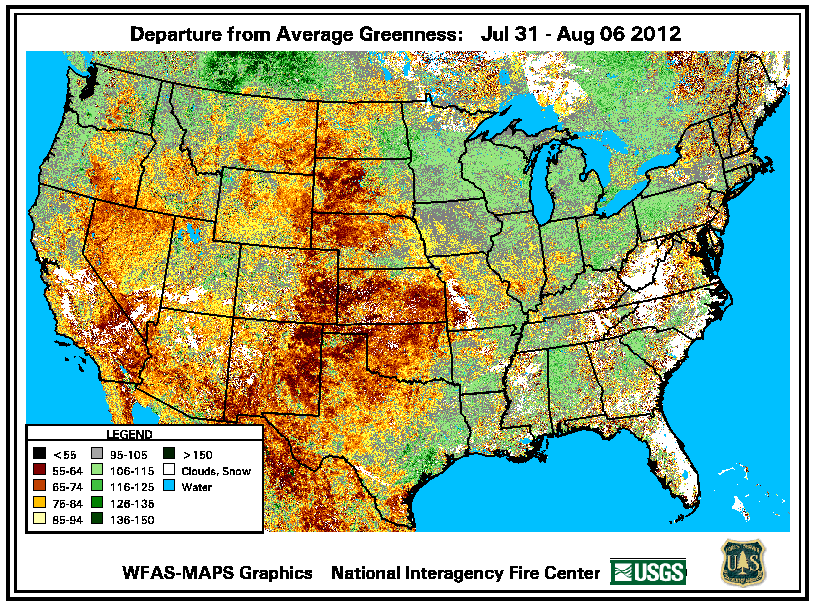
Holy cow, but that would look nice right about now. Unfortunately, no such
luck. Here is the latest departure from average greenness map. Don't get any
flames near this or it will spark up.
July 31-Aug 6: http://ticker.mesonet.org/archive/20120810/jul31-aug6-green.png
So a whole lotta green on its way to a whole lotta yellow.
*******************************************************************************
I mentioned yesterday about our (some previous month)-July periods going all
the way back to 24 months were the warmest on record. I'll try to put that in
tabular form with the official data from NCDC. If it doesn't work, I'll see you
down the page a bit.
-****-
Period Span Ave. Temp Dep./20th Cent. Avg. Rank since 1895
1-month July 2012 85.5F 4.0F 9th warmest
2-month Jun-Jul 2012 82.1F 2.9F 11th warmest
3-month May-Jul 2012 78.9F 3.5F 4th warmest
4-month Apr-Jul 2012 75.2F 3.9F 2nd warmest
5-month Mar-Jul 2012 72.1F 5.2F 1st warmest
6-month Feb-Jul 2012 67.3F 4.7F 1st warmest
7-month Jan-Jul 2012 63.7F 4.9F 1st warmest
8-month Dec 2011-Jul 2012 60.8F 4.4F 1st warmest
9-month Nov 2011-Jul 2012 59.5F 4.0F 1st warmest
10-month Oct 2011-Jul 2012 59.8F 3.6F 1st warmest
11-month Sep 2011-Jul 2012 60.8F 3.2F 1st warmest
12-month Aug 2011-Jul 2012 63.1F 3.5F 1st warmest
18-month Feb 2011-Jul 2012 64.0F 3.4F 1st warmest
24-month Aug 2010-Jul 2012 62.4F 2.8F 1st warmest
-***-
It worked! Welcome back. So our January-July is still easily the warmest, ahead
of now 2nd-place finisher 2006 at 62.4 degrees. The race is now on to try and
best the warmest year on record from 1954. Through July that year, 1954 was the
4th warmest on record at 61.7 degrees. It was able to capture the warmest year
on record by blazing through the warmest second half of the year.It's July-
Dec. was the warmest on record, as was its Aug.-Dec. July 1954 was the 2nd
warmest on record (#1 before last year's July, and the previous hottest month
for any state in U.S. history), August 1954 was the 5th warmest August on
record, September 4th warmest, October 17th warmest, November 28th warmest,
and finally December was the 27th warmest. The final tally was the warmest year
on record at 61.5 degrees.
Is our 2-degree head start on 1954 good enough for the win? August has already
been much above normal with a statewide average temperature of 88.7 degrees,
which is 6.5 degrees above normal (avg. high has been 103.8 degrees, avg. low
has been 74 degrees). But suppose we take a dip during the second half and
finish close to normal, then finish close to normal for September through
December? That would put us at 62.4 degrees for the year.
I won't hazard a guess as to our finish for the year, but I'm thinking August
gives us another pretty good boost. Last September was 1.2 degrees below normal.
We have El Nino staring us in the face this fall, which tilts our odds here in
the southern tier of states to a cooler/wetter regime.
The horse race is on!
Gary McManus
Associate State Climatologist
Oklahoma Climatological Survey
(405) 325-2253
gmcmanus@mesonet.org
==================================================
The OCS/Mesonet Ticker
https://ticker.mesonet.org/
To subscribe or unsubscribe from the Ticker
or for questions about the Ticker or its content
Phone or Email the Ticker Manager at OCS
Phone: 405-325-2253 Email: ticker@mesonet.org
---------------------------------------------------
-C- Copyright 2024 Oklahoma Climatological Survey
===================================================
|


 Tweet
Tweet