Ticker for May 14, 2015
MESONET TICKER ... MESONET TICKER ... MESONET TICKER ... MESONET TICKER ...
May 14, 2015 May 14, 2015 May 14, 2015 May 14, 2015
4.5 years of drought in 48 seconds
First and foremost, the new U.S. Drought Monitor map (drum roll, please)...
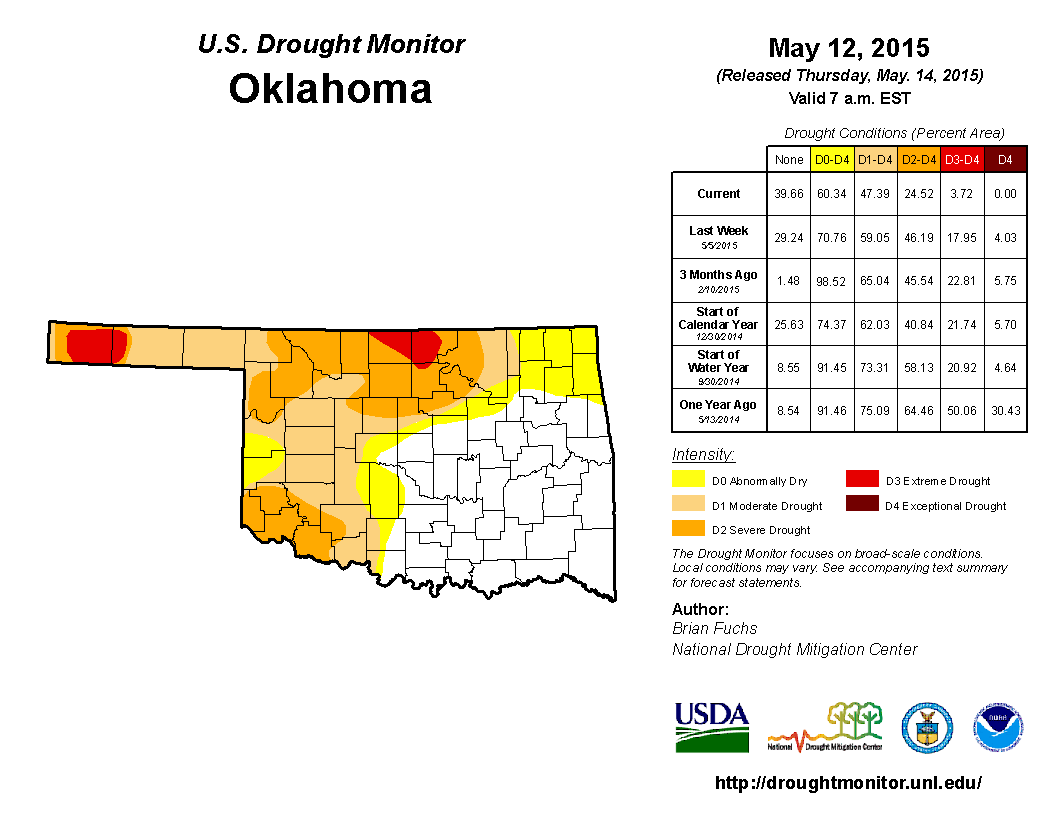
BOOM! That's about as dramatic of an improvement that I've seen in one week for
the DM, with D2-D4 (Severe through Exceptional) drought going down from 46% to
25%, a reduction of 21%. That matches the same reduction from the Nov. 15 to
Nov. 22 maps back in 2011. And for the first time since the July 17, 2012, map,
there is ZERO D4 (Exceptional) drought in the state. We also have 52% of the
state completely OUT of drought (DO-Abnormally Dry and below), matching that
figure from the Feb. 11, 2014, map. The reduction of drought from just three
weeks ago is equally as dramatic. A glance at the April 21 map shows what a
difference a few weeks of great rains can make. We see the amount of D3-D4
drought go from 37% to a mere 4% over that span.
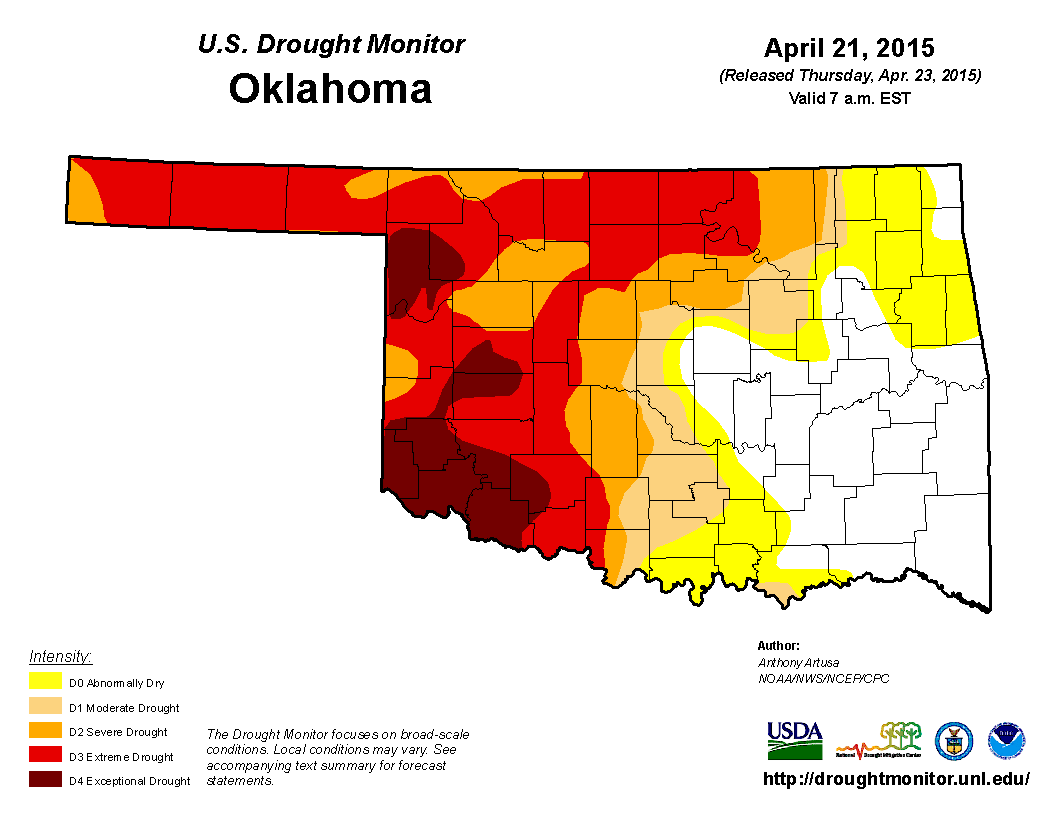
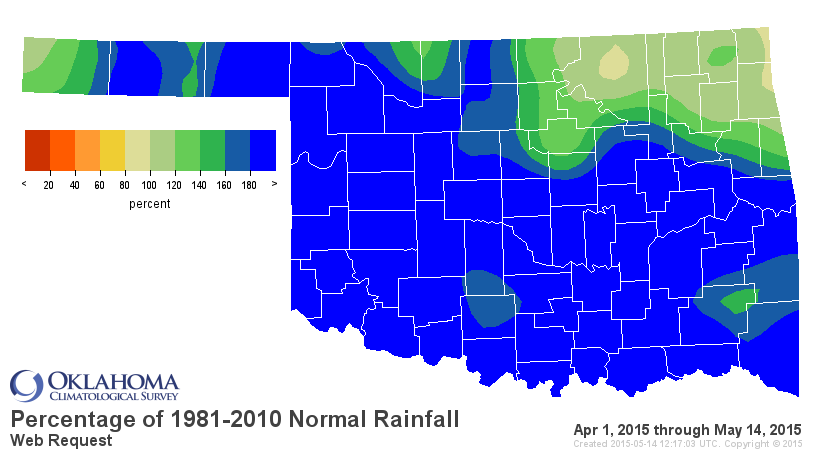
So a very nice and dramatic reduction of drought across the state following
the big rains of the first 10 days of May, which built upon the big rains of
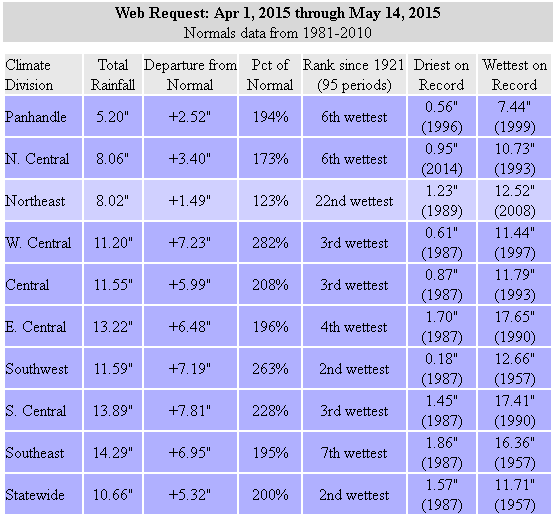
April. The statewide average for April 1st through this morning was 10.66",
5.32" above normal and the 2nd wettest Apr. 1-May 14 since at least 1921.
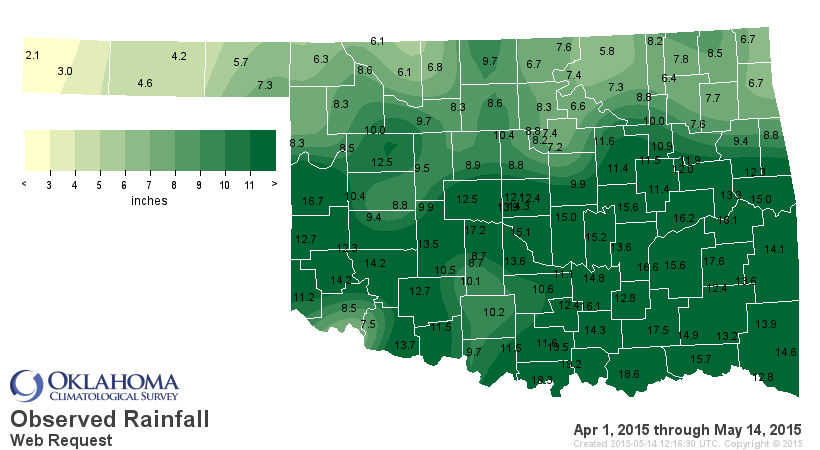
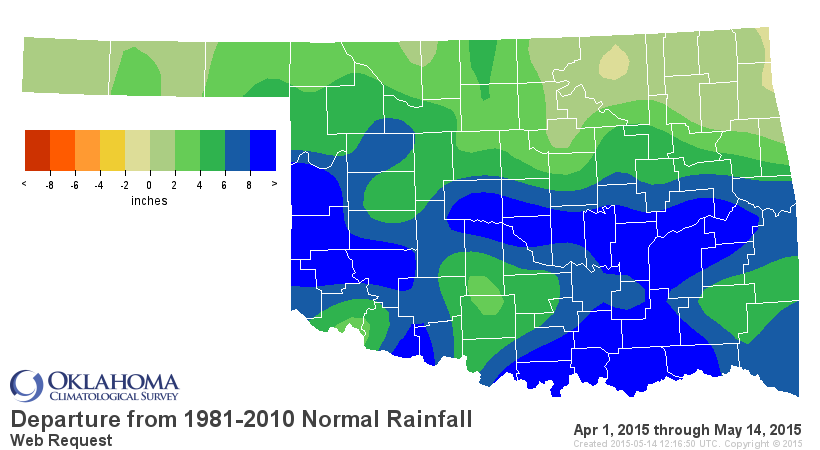
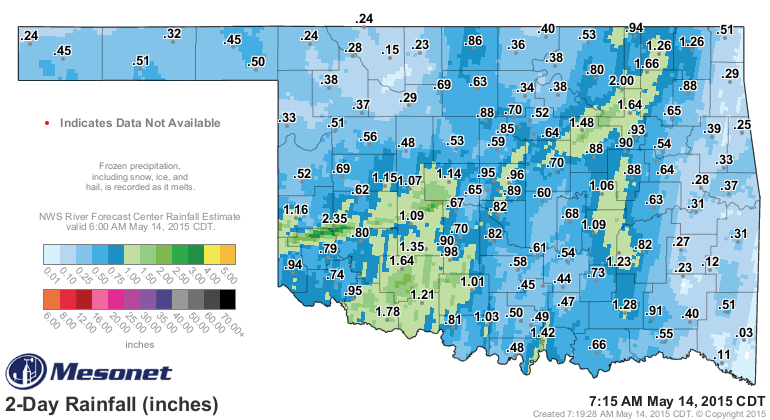
Now remember that the cutoff period for rainfall to be considered for the new
DM map is Tuesday morning, so whatever fell last night (and continues to fall
up in the NE today) will be considered for next week's map. Some nice additional
totals here.
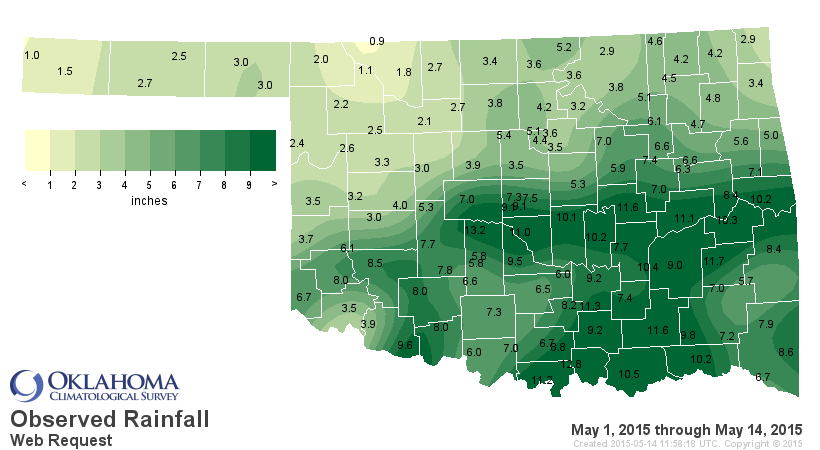
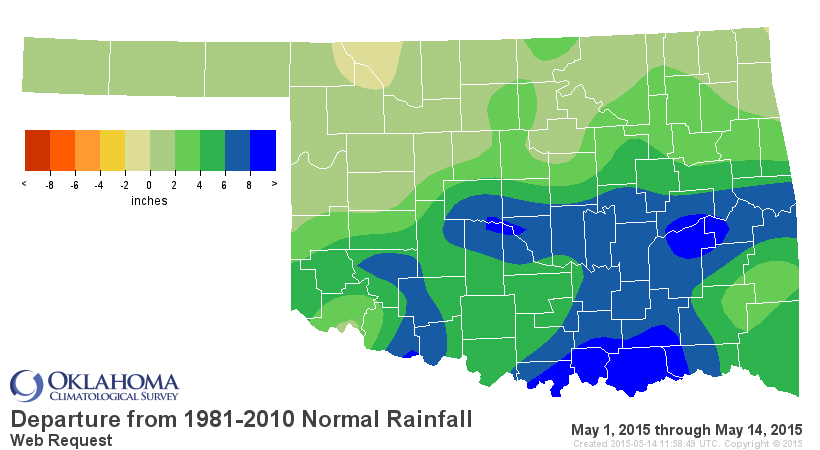
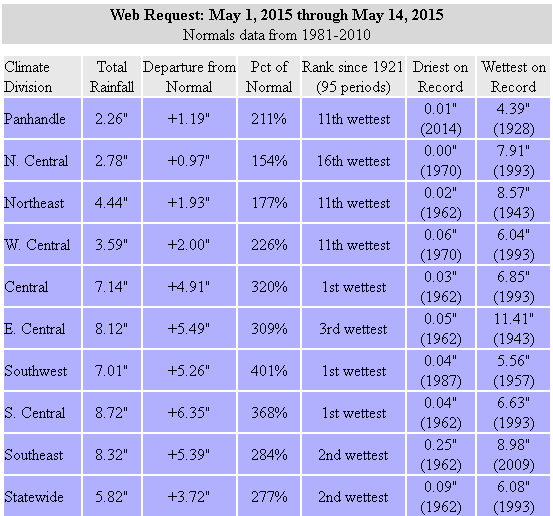
That brings the May total rainfall thus far up to 5.82", 3.72" above normal
and the 2nd wettest May 1-14 since at least 1921. That's makes this May the 32nd
wettest on record already with more than half of month left to go!
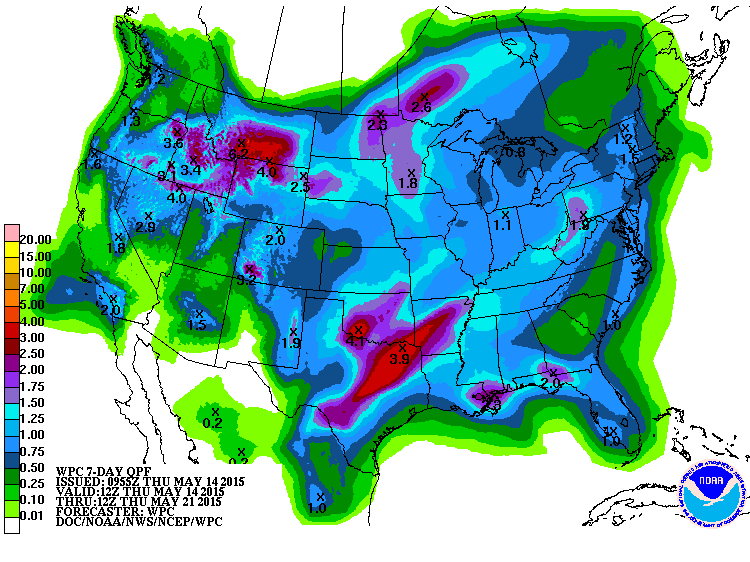
We definitely have a chance to add substantial amounts of moisture to those maps
coming up in the next week with storm systems lines up for this weekend and then
next week as well. The 7-day rain forecast is pinging parts of the state for
another 2-4 inches.
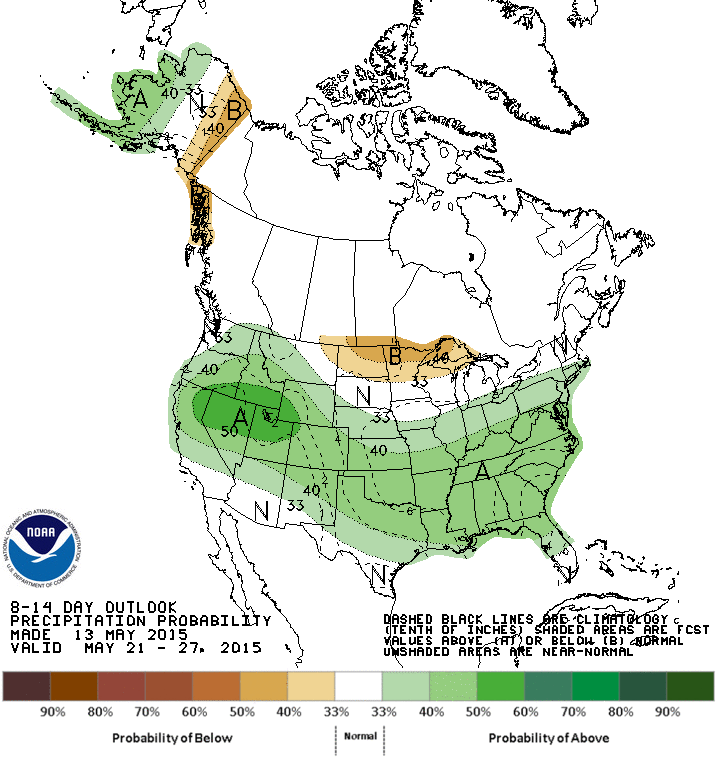
And the latest CPC outlooks call for increased odds of above normal precip after
that period as well.
These south-diving storms continue to line up and track across the southern tier
of the U.S., pounding the Southern Plains with rain when they tap into the rich
moisture source of the Gulf of Mexico. It's almost as if something is influencing
it...like the strengthening El Nino down in the equatorial pacific, perhaps?
-------------------------------------------------------------------------------
Now on to something awesomely cool, and I'm not talking about a re-release of
"Road House" (a guy can dream, can't he??). Brad Illston, who leads our Mesonet
research efforts, produced this loop of each and every Drought Monitor map from
the beginning of the drought in Oct. 2010 through this morning's map. This shows
the ebb and flow of the drought through the eyes of the Drought Monitor,
beginning with a nearly blank map in Oct. 2010 and ending with our current
situation. You can view this loop on the Mesonet's Youtube page.
https://www.youtube.com/watch?v=1u39DctaVTg
As you can see, we've had several really nice recovery periods before during the
drought. The drought peaked in early Oct. 2011 following that horrific summer
which ended as the hottest for any state on record. A lot of damage was done to
our ecosystem from which we are still trying to recover.
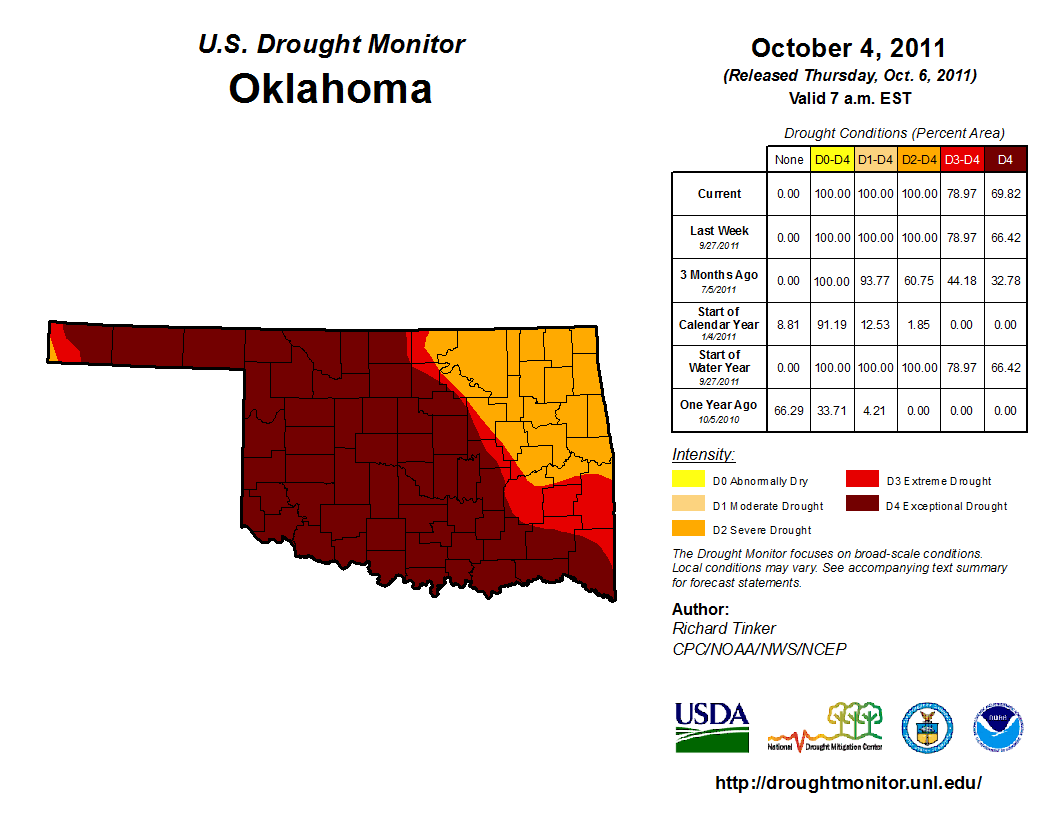
Late fall through early spring of 2011-12 took the state almost
completely out of drought. The May 15, 2012, map showed only 13.7% of the state
in drought.
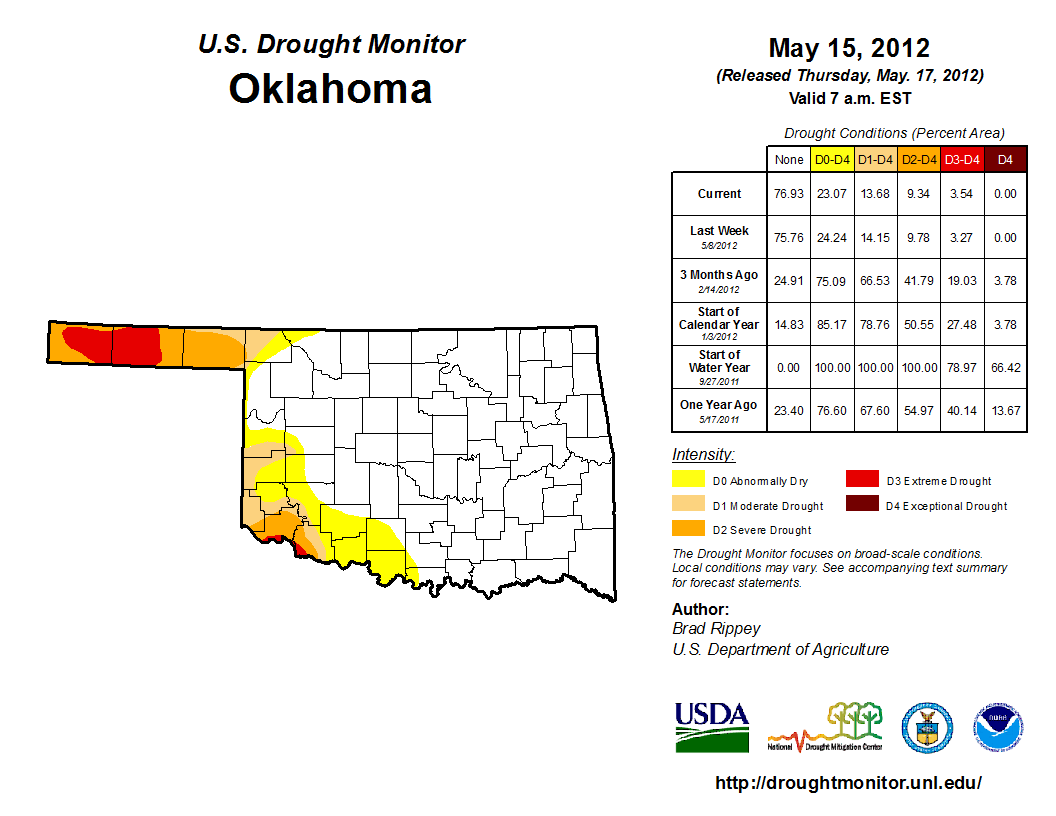
The loop clearly shows that we've had less drought in the state during the
overall dry episode, but this is certainly one of the more dramatic periods of
improvement that we've seen in such a short time period. Each one of those wet
periods was quickly followed up by another extended dry period and drought
intensification, especially across western Oklahoma. In fact, through most of
those recovery periods, western OK missed out entirely.
Several things give me hope that things are going to be different this time
around and we're going to see real and lasting drought relief for awhile:
1) The relief is occurring during the actual wet season, with plenty of that
season left to go. The normal wet season for Oklahoma runs about April through
mid-June.
2) Western Oklahoma is getting great relief this time!
3) El Nino has continued to strengthen, enough so that we are probably seeing
some impact when we wouldn't normally expect to (at least according to some
hints I've received from federal experts).
4) That El Nino looks promising to strengthen even more into next fall and
winter.
The impacts of this El Nino (if they are indeed occurring...the federal experts
warned me that they still need to do some "heavy lifting" to show attribution
to this strengthening event) will probably start to die out as we get into the
summer months, but building a good reserve supply of moisture to last us
through the hot season will do wonders if we pick up with a nice secondary
rainy season in the fall...especially if that fall rainy season is augmented
by the projected El Nino.
Some might have expected a complete elimination of drought over much of the
state. There is a reason we didn't see that, of course. There are fail safes
built into the DM process so you won't get a 3 or 4 category reduction of
drought, based on the scientific principles of the properties of drought. A 2-cat
improvement is pushing it, but we did see some of that. So let's remember that
some of the lakes across western Oklahoma, while they are responding, need a
lot more moisture.
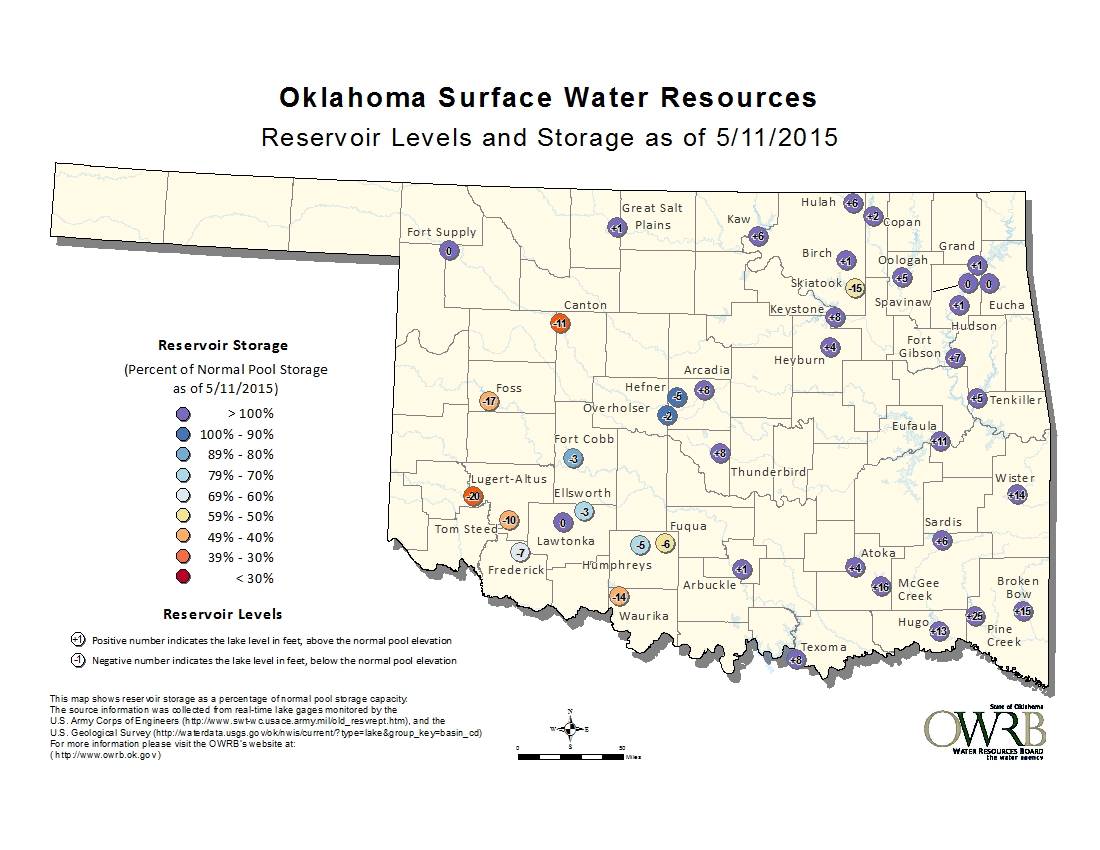
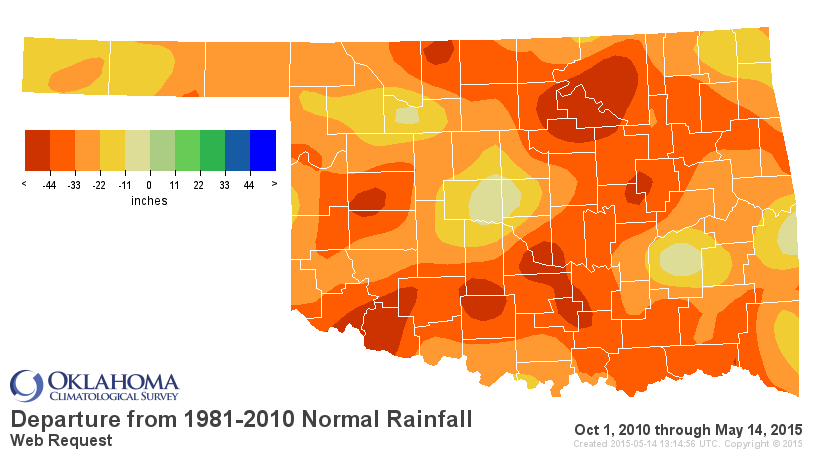
And we are still working with a backdrop of deficits on the order of 30-50
inches in some places throughout this drought period.
So despite the rosy picture I have tried to paint, I think it is important that
we continue to conserve water. Be thankful for what we have received, but just
in case...
Gary McManus
State Climatologist
Oklahoma Climatological Survey
Oklahoma Mesonet
(405) 325-2253
gmcmanus@mesonet.org
May 14 in Mesonet History
| Record | Value | Station | Year |
|---|---|---|---|
| Maximum Temperature | 99°F | ALV2 | 2018 |
| Minimum Temperature | 30°F | HOOK | 2004 |
| Maximum Rainfall | 3.44″ | CLOU | 2003 |
Mesonet records begin in 1994.
Search by Date
If you're a bit off, don't worry, because just like horseshoes, “almost” counts on the Ticker website!