Ticker for October 4, 2012
MESONET TICKER ... MESONET TICKER ... MESONET TICKER ... MESONET TICKER ...
October 4, 2012 October 4, 2012 October 4, 2012 October 4, 2012
Big rains beget big Drought Monitor changes
As expected, the big rains of last week resulted in big changes on the latest
drought map. The big blob of rain centered south of I-40 was a really nice target
to shoot improvements at. Take One more look at the rainfall from the Mesonet and
the radar estimates from the River Forecast Center in Tulsa. As a drought
observer, the map is so pretty I might make it my desktop picture (sorry, folks
up north)!
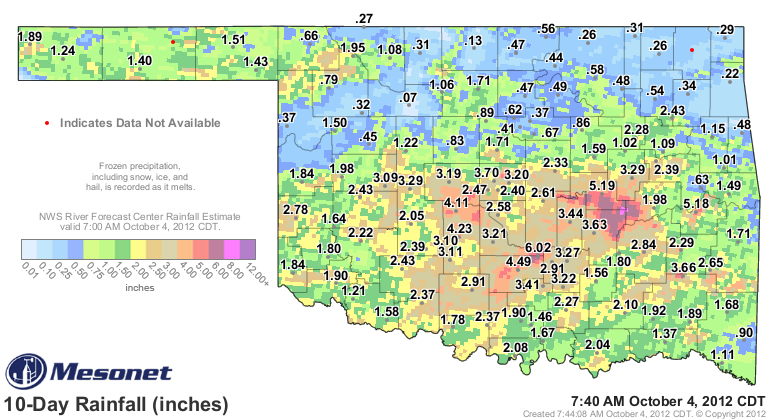
The end result, of course, is a large area of improvement on the latest U.S.
Drought Monitor map. The map looks a bit strange, but those changes will flesh
out a bit more next week.
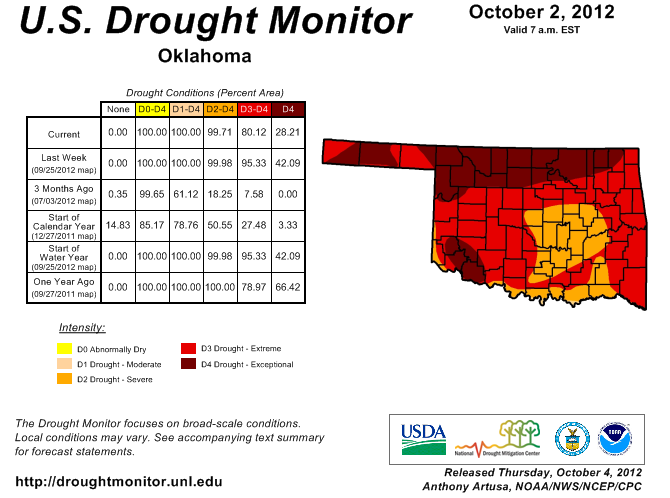
The amount of exceptional drought in the state was reduced from 42% to 28%, and
the amount of extreme-exceptional drought similarly lowered from 95% to 80%.
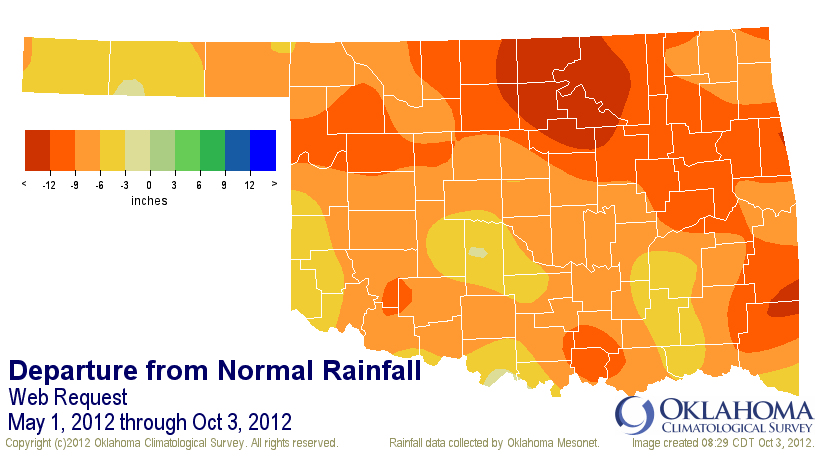
Exceptional drought actually expanded in northeastern Oklahoma, which largely
missed this last system and continues with large deficits since May 1. The entire
state remains in severe-exceptional drought.
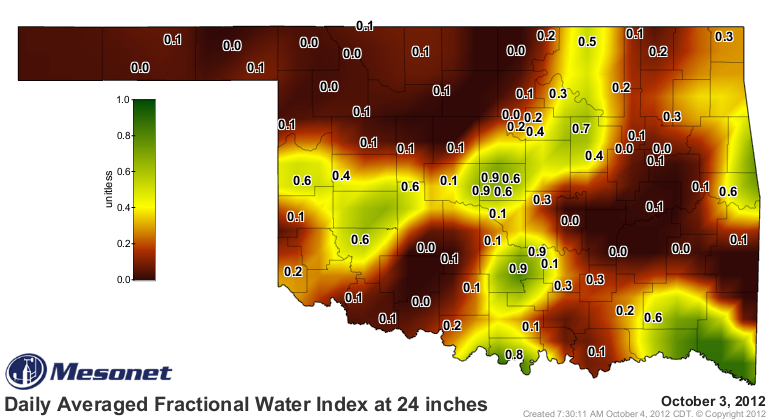
As mentioned yesterday, we paid a lot of attention to where the soil moisture
improved down to the 10-inch level. The 24-inch soil moisture still has a long
way to go.

One of the biggest concerns we had in looking at the aftermath of the rain was
the impact on the state's lakes and reservoirs. We certainly had hoped for more
recovery than what we saw, which ended up being fairly negligible. As we've
mentioned many times before, the soils tend to drink first and we had a LOT
of thirsty dirt across the state waiting for rain. Most areas reported a bit of
farm pond recovery as well, but still a lot more rain needed to see them full
again. Outside of those areas that got upwards of 6 inches, of course.
Here is a table we've used before, showing the percent of conservation pools
filled in Oklahoma's major reservoirs. We've thrown in the percentage change in
one week, month and year for comparison. The table is sorted by the lowest
levels as of October 4.
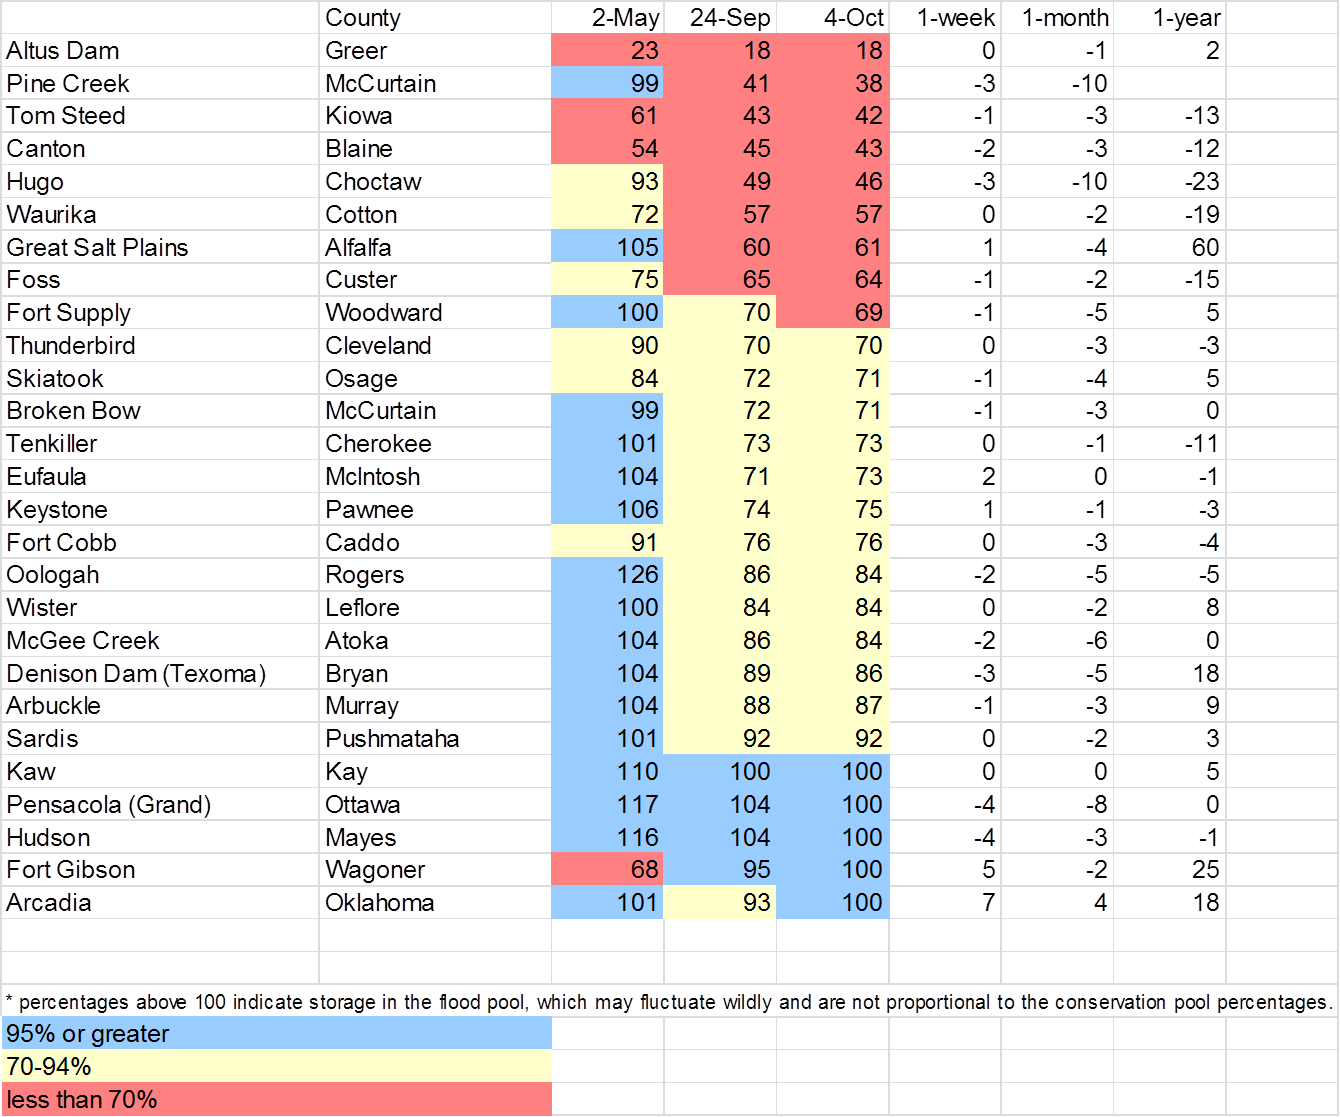
A lot of our state's lakes still have a long way to go, obviously. This is the
difference between long-term and short-term drought. Soils, especially at the
upper depths, are more of a short-term indicator. Lakes (and lower soil depths)
are more indicative of long-term drought impacts.
There is lots of optimism this go-round from the CPC's Seasonal Drought Outlook.
Lots of green painted over Oklahoma, meaning drought improvement is expected
between now and the end of the year. For the Panhandle and northwest, not so much.
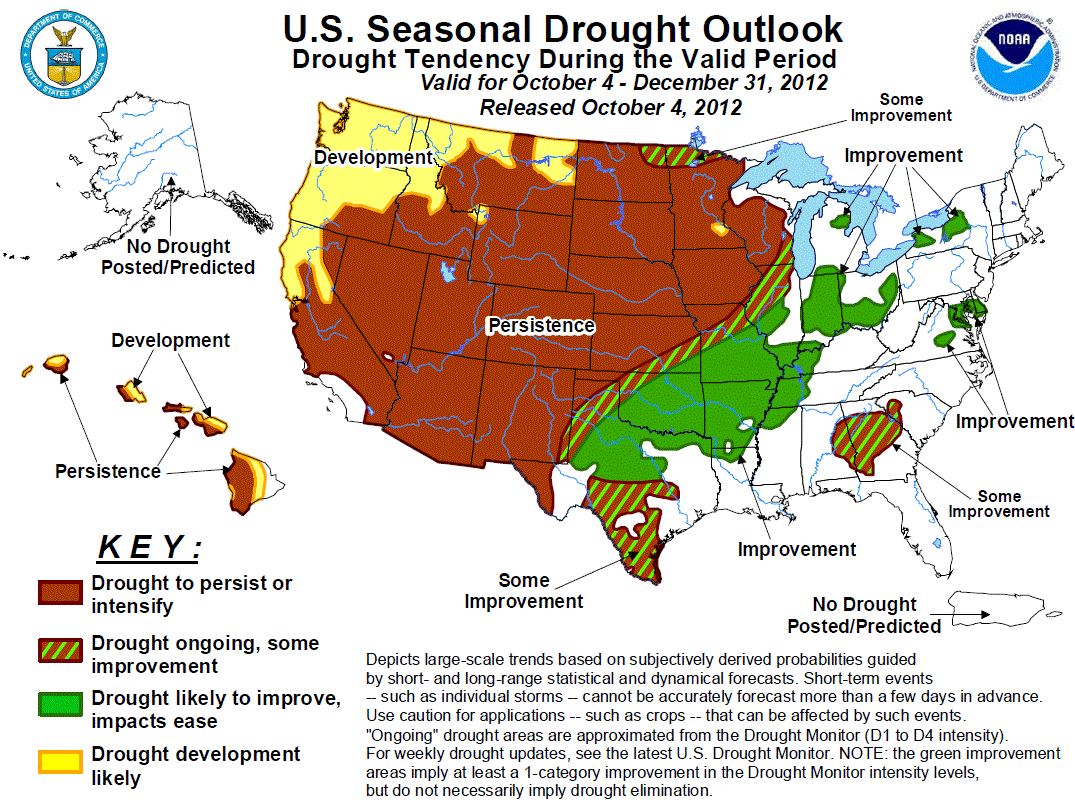
Here's the CPC's thinking on our drought situation through the rest of the year.
"According to the USDM, extreme to exceptional drought covers nearly all
of Oklahoma with varying drought intensity across Texas. A relatively
dry climatology favors persistence across the Oklahoma Panhandle and the
northwest Texas Panhandle. Prospects for improvement increase across the
remainder of Oklahoma and north Texas where climatologically, conditions
do not become significantly drier during OND. Other factors that support
some improvement or improvement across much of Oklahoma and Texas include:
several inches of precipitation indicated by the 384-hour forecasts from
the 0/6z gfs models, the 6-10/8-14 day outlooks from October 3 favoring
near to above median precipitation, and the CPC seasonal outlook for OND
calling for enhanced odds of above median precipitation across central and
south Texas. Forecast confidence for Oklahoma and Texas is moderate."
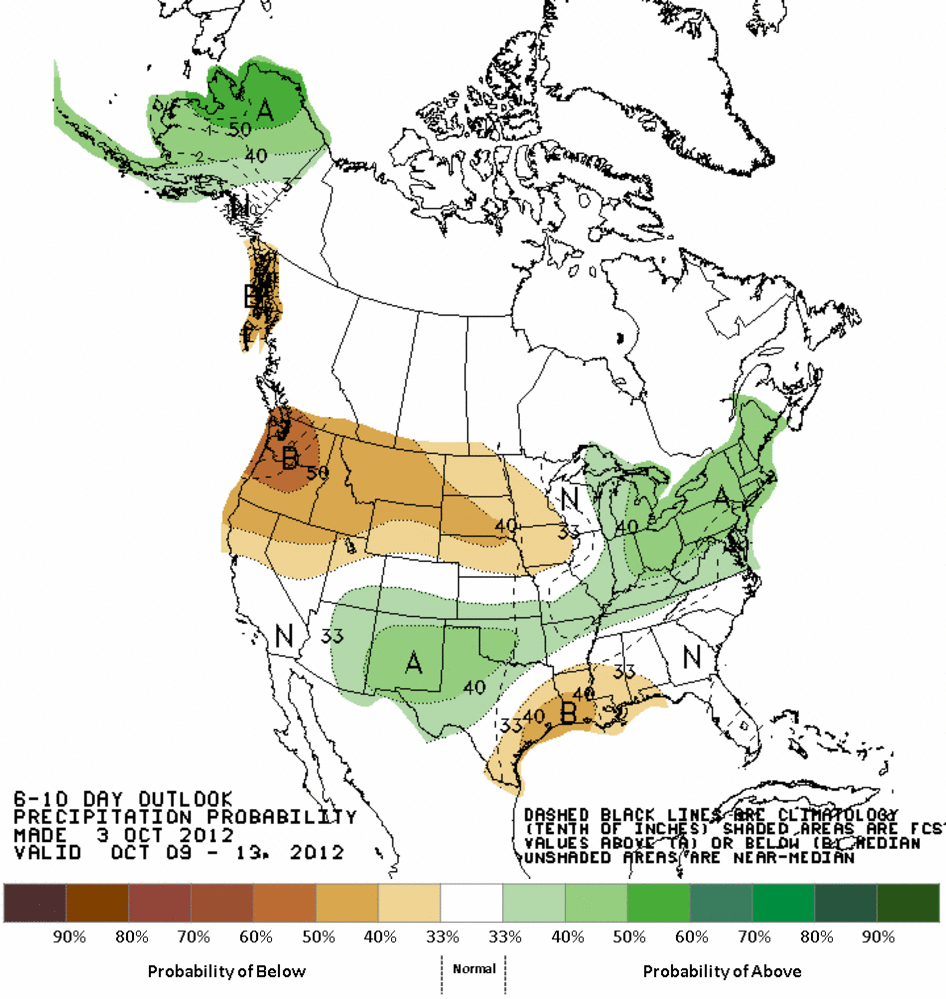
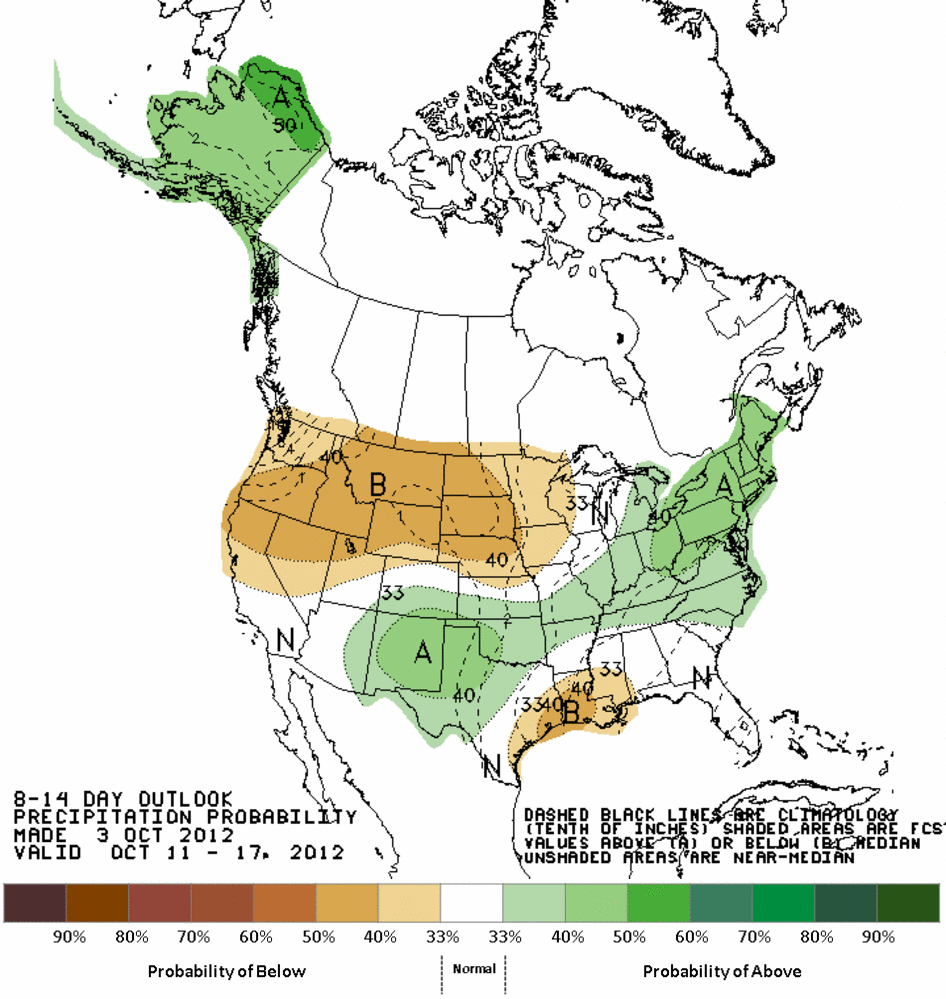
Here are those 6-10 and 8-14 day outlooks from the CPC mentioned above. They
indicate increased odds of above normal precipitation over Oklahoma for the Oct.
9-17 time period. Another note, looking at 384-hour forecasts is a bit like a
fantasy forecast, but it does fit with those 6-10/8-14 day outlooks.
Perhaps we're on our way to a recovery, much like last year at this time?
Gary McManus
Associate State Climatologist
Oklahoma Climatological Survey
(405) 325-2253
gmcmanus@mesonet.org
October 4 in Mesonet History
| Record | Value | Station | Year |
|---|---|---|---|
| Maximum Temperature | 99°F | WALT | 2000 |
| Minimum Temperature | 29°F | OILT | 2010 |
| Maximum Rainfall | 7.72″ | PAWN | 2017 |
Mesonet records begin in 1994.
Search by Date
If you're a bit off, don't worry, because just like horseshoes, “almost” counts on the Ticker website!